Série Scientifique
Scientific Series
98s-13"Informal Thinkering":
How Is It Important?
Pierre J. Tremblay
MontréalCIRANO
Le CIRANO est une corporation privée à but non lucratif constituée en vertu de la Loi des compagnies du Québec. Le financement de son infrastructure et de ses activités de recherche provient des cotisations de ses organisations-membres, d=une subvention d=infrastructure du ministère de l=Industrie, du Commerce, de la Science et de la Technologie, de même que des subventions et mandats obtenus par ses équipes de recherche. La Série Scientifique est la réalisation d=une des missions que s=est données le CIRANO, soit de développer l=analyse scientifique des organisations et des comportements stratégiques.
CIRANO is a private non-profit organization incorporated under the Québec Companies Act. Its infrastructure and research activities are funded through fees paid by member organizations, an infrastructure grant from the Ministère de l=Industrie, du Commerce, de la Science et de la Technologie, and grants and research mandates obtained by its research teams. The Scientific Series fulfils one of the missions of CIRANO: to develop the scientific analysis of organizations and strategic behaviour.
Les organisations-partenaires / The Partner Organizations $École des Hautes Études Commerciales
$École Polytechnique $McGill University $Université de Montréal
$Université du Québec à Montréal $Université Laval
$MEQ $MICST $Avenor
$Banque Nationale du Canada $Bell Québec
$Caisse de dépôt et placement du Québec
$Fédération des caisses populaires Desjardins de Montréal et de l=Ouest-du-Québec $Hydro-Québec
$Industrie Canada $Microcell Labs inc.
$Raymond, Chabot, Martin, Paré $Scetauroute
$Société d=électrolyse et de chimie Alcan Ltée $Téléglobe Canada
$Ville de Montréal
ISSN 1198-8177
Ce document est publié dans l=intention de rendre accessibles les résultats préliminaires de la recherche effectuée au CIRANO, afin de susciter des échanges et des suggestions. Les idées et les opinions émises sont sous l=unique responsabilité des auteurs, et ne représentent pas nécessairement les positions du CIRANO ou de ses partenaires.
This paper presents preliminary research carried out at CIRANO and aims to encourage discussion and comment. The observations and viewpoints expressed are the sole responsibility of the authors. They do not necessarily represent positions of CIRANO or its partners.
"Informal Thinkering": How Is It
Important?
*
Case Studies of Technical Change Processes:
An Industrialized-Industrializing Country Comparison
Pierre J. Tremblay
HRésumé / Abstract
*
Corresponding Author: Pierre J. Tremblay, CIRANO, 2020 University Street, 25th floor, Montréal, Qc, Canada H3A 2A5 Tel: (514) 985-4000 Fax: (514) 985-4039 e-mail: [email protected]
Cet article examine des processus d'innovation ou de génération de changements techniques au niveau de la firme. Il met l'emphase sur le fait que les paramètres clés connexes aux changements techniques et technologiques ayant un impact sur la croissance de productivité sont induits par des facteurs behavioraux internes à la firme. Les changements peuvent être le résultat d'investissement dans la R&D, mais aussi, et de façon significative, le résultat de processus de « conceptions informelles » à l'intérieur des firmes. Cette recherche examiner dans un premier temps des processus de changements techniques et la croissance de productivité en résultant. Dans un deuxième temps, elle fait une analyse comparative entre pays industrialisés et s'industrialisant. Cette étude empirique est basée sur des données de première main (observations directes, entrevues personnelles, documents internes) collectées dans neuf usines de pâtes et papiers dans deux pays (Canada et Inde). Ce papier met en évidence l'importance de gérer le changement comme un processus continu. L'introduction de changements techniques par « sauts » intermittents contribue peu à expliquer les différences de croissance de productivité entre les usines. Plus significatives sont (i) les séquences continues de petits investissements (changements techniques), souvent liés aux plus grands changements par "sauts", et (ii) l'existence d'un flux continu de changements et d'améliorations qui ne sont pas officiellement enregistrés (aux livres, de façon comptable) comme des investissements en capitaux.
This paper examines innovation processes or technical change-generation processes at the firm level. It emphasizes the notion that the element of technical and technological change that is a determinant of productivity growth is strongly induced by internal factors related to the firm’s behavior, via investment in R&D but also, and importantly, on the basis of "informal thinkering" within plants. This research is unique in that it seeks first, to examine the pattern of technical change and its ensuing productivity growth, and second, to make a comparison between an industrialized and an industrializing country. This comparison is conducted by empirically comparing mills in the pulp and paper manufacturing sector in two countries: Canada and India. The overall analysis is based on direct observations at the mill level, face-to-face interviews and on analysis of mill documentary records. This paper highlights the importance of
managing change as a continuous process. The introduction of intermittent, "step-jump" technical changes contributed little to explain the differences in performance between the mills. Much more important are (i) the continuing sequences of smaller investments in technical change, often linked to the larger step-jumps, and (ii) the existence of steady streams of changes and improvements that are unrecorded as capital expenditure.
Mots Clés : Changement technique, changements par incréments, mesures de performance, amélioration continue, investment capital, pâtes et papiers, Inde, Canada
Keywords : Technical change, incremental change, performance measure-ment, continuous improvemeasure-ment, capital investmeasure-ment, pulp and paper, India, Canada
1.
Introduction
This paper examines innovation processes or technical change generation processes at the firm level1. It emphasizes the notion that the element of technical and technological change that is a determinant of productivity growth is strongly induced by internal factors related to the firm’s behavior, via investment in R&D, as suggested in the work of Nelson (1981) and Mansfield (1968), but also, and importantly, on the basis of "informal thinkering" within plants. According to Rosenberg (1982, pp.121-122):
"... there are many kinds of productivity improvements, often individually small but cumulatively very large, that can be identified as a result of direct involvement in the productive process. This is a source of technological innovation that is not usually explicitly recognized as a component of the R&D process, and receives no direct expenditures - which may be the reason it is ignored."
This last type of productivity improvement is crucial for the present analysis, which focuses on changes initiated within firms that were very rarely the result of R&D laboratories, even if all the firms analyzed had R&D facilities at the corporate level (refer to appendix). Regardless of the presence of R&D facilities, some firms were generating changes whereas others were generating very little. The presumptions underlying this study are that "informal" type of changes make a very substantial contribution to productivity growth.
Industrial enterprises implicitly recognize the importance of technical change and at times, invest massively into it. Obviously, they expect a return on their investment. One may explicitly question whether there really is a significant relationship between these investments in technical change and productivity growth. Are there differences between firms’ patterns of technical change? Are there any significant differences in these patterns between industrialized and industrializing countries? Are there any strategic investments in technical change which could lead to better productivity growth?
Setting the scene for the present paper is important at this point. First of all, as mentioned by Bessant et al. (1993, 1994a, b), traditionally, studies on innovation have focused principally on "radical" or "breakthrough" innovations with a high degree of novelty. A large part of innovation studies
1
The results presented in this paper are part of a broader research program developed during my Ph.D. studies at the Science Policy Research Unit, University of Sussex, U.K.
concern high-tech firms such as electronics or bioengineering companies and this preoccupation might have overemphasized the role and contribution of R&D input to productivity growth as compared to their role in "low-tech" or mature industries. Therefore, the present study examines the process of technical change in firms that are not in the industrial high-tech sector. Furthermore, the study addresses issues orientated towards industrializing country development.
The aim of this research is first, to examine the pattern of technical change and its ensuing impact on productivity growth. Second, it seeks to make a comparison between an industrialized and an industrializing country. This is accomplished by empirically comparing mills in the pulp and paper sector in two countries: Canada and India. The overall analysis is based on direct observations at the mill level, face to face interviews and an analysis of mill documentary records.
2.
Theoretical Background
There are few studies which have examined productivity differentials at the micro-level (firm level) within an industrializing country context. Some studies such as those of Page (1980) and Cortes, Berry and Ishaq (1987) have compared static productivity levels, linking measures of education with technical efficiency. However, Pack (1988) argues that the results of these studies are inconclusive. Longitudinal (intertemporal), micro-level (firm-level) productivity studies in industrializing countries are even fewer. One example is the study by Nishimizu and Page (1982) which analyzes Total Factor Productivity (TFP) growth differentials for the industrial sector of Yugoslavia. They innovatively divided TFP in terms of "technological progress" (following the best practice frontier) and "technical efficiency" as defined by all other productivity changes such as learning by doing, diffusion of new technology, etc. Their main finding was that over extended periods, a country may have negative TFP changes, (i.e., technical efficiency was decreasing over time). Similarly, Handoussa, Nishimizu and Page (1986), studying Egyptian public sector industries, found that the increased TFP may be ascribed to improvement in capacity utilization for both firms at the production frontier and those behind it. None of the firms had improved their technical efficiency beyond the production function frontier.
An important implication of such studies is that improving the "technical efficiency" of a firm can improve productivity considerably by using available resources more efficiently without implementing new technology. In a
developing economy’s context where financial resources required to acquire state-of-the-art technology are scarce, this appears to be a less prohibitive solution to productivity improvement. However, the causes of inefficiency in the firms studied were not related to the underlying technical change processes, but were related to macro-economic variables such as trade liberalization.
Looking at innovation and productivity growth from a firm standpoint with firm level solutions, one may ask: "how does one improve "technical efficiency" without spending scarce capital resources?" "Would it be possible to achieve technical efficiency from small incremental improvements or innovations of an "informal thinkering" type as described earlier by Rosenberg (1982)?" "Why is it, that if such an incremental change process can improve productivity, there is so little empirical evidence?" Perhaps it is due to the difficulty of obtaining longitudinal data, but it may also be because most of the research was entrenched in a neoclassical economic framework.
The literature on small innovation has frequently been associated with literature on "learning-by-doing", "X-efficiency" and learning curves (for a review of the learning curve/progress function see Dutton & Thomas, 1984). This literature implicitly assumes that improvement occurs naturally and is inexorable. However, studies such as those of Abernathy and Wayne (1974) and Kimberly (1981) have demonstrated that there are limits to learning curves, such that they are conditional upon the ability of the management involved to extract the full potential from the resources at their disposal. Unfortunately, the debate on the learning curve has obscured the underlying processes leading to an assumed continuous improvement (Bell and Scott-Kemmis, 1990). While research has reached the stage where it is now recognized that learning rates can be different in any two learning/progress situations, underlying concepts have not been well developed.
Conventional measures of investment in technical change generation at the firm level in industry are not sufficient to grasp the issue raised in this paper. Studies on innovation have focused principally on "radical" or "breakthrough" innovations with a high degree of novelty. Except for classical studies like Hollander (1965) and Enos (1962) which have shown that the cumulated effects of minor changes can outweigh the productivity gains resulting from the introduction of capital intensive technical changes, the generation of technical change at the firm level has been overlooked for nearly three decades. Strong empirical evidence of the contribution of incremental change to productivity growth is lacking in the economic literature possibly because
of its underlying neoclassical framework which considered the firm as a kind of black box.
Fortunately, there is now a growing literature that addresses the importance of the contribution of incremental change to productivity growth and quality improvements. Numerous studies connected with Japanese manufacturing techniques or models (also referred to as "Toyota" models) have highlighted the importance of intra-firm characteristics in generating change and innovation. For example, the wide body of literature on total quality management (TQM) argues that the involvement of all employees, not just of specialists, is beneficial to performance growth. Likewise, the literature on continuous improvement (CI) relates similar findings (Robinson, 1991; Bessant et al. 1993, 1994a, b, 1997a, b). However, except for a very few recent studies on industrial organizations (Kaplinsky, 1994; World Development special issue, 1995) there is a dearth of empirical evidence of
such latter issues (i.e., understanding the underlying technical change pattern "à la Rosenberg") for industrializing countries. Though these excellent studies are clearly opening up new issues for industrial organizational change within industrializing countries, their evidence is based on case studies of discrete operation processes (e.g. garments, auto sector industries, etc.) that cannot easily be generalized to other situations. Moreover, these studies do not provide an international comparative analysis, nor comprehensive productivity growth data linked to technical change processes.
3.
Method
This research has explicitly explored the link between the technical change-generation process and the resulting productivity growth within a context of industrialized and industrializing countries. The following sections explain the choice of industry, countries, research strategies and measurements.
3.1 Choice of Industry and Countries
A primary focus in this paper is to analyze patterns of change, including informal change (i.e., not generated by official R&D laboratory) initiated within firms that are frequently omitted or underestimated in numerous studies. Therefore, to grasp the importance of change generation at the firm level, case studies were sought for an industry in which it would be possible to locate both formal and informal changes. It seems that the process of "informal" generation of change is particularly found (using Pavitt's (1984, 1988) taxonomy) in firms qualified as supplier dominated and to a greater
extent in scale intensive firms. As such, in a typical supplier dominated firm, most innovations originate from their supplier; the firm is only providing a minor contribution to its process or product technology. A typical scale
intensive firm is producing bulk materials through continuous processes.
"Cost-cutting through the exploitation of economies of scale and learning defines the dominant technological trajectory so that firms are typically large. In-house production engineering activities are essential, given that process technologies are complex, interdependent, difficult to operate, but capable of continuous improvement" (Pavitt, 1988, p.135).
Firms in the pulp and paper manufacturing industry could be qualified as being located at the frontier between "supplier dominated" and "scale intensive" firms. In this sector, the generation of technical changes at the firm level usually follows a pattern in which minor incremental changes are generated in-house by firms in the industry. These small changes are complemented by a set of sporadic large changes usually originating from suppliers to the industry such as pulp and paper machinery suppliers.
Regarding the international comparative analysis, two countries were chosen: an industrialized country, Canada, and an industrializing country, India. Considering the difficulty in obtaining permission to secure the necessary data, efforts were concentrated on areas of the industry known by the author. The familiarity of the author (who worked in the industry for a few years) with the Canadian pulp and paper industry played a major role in choosing Canada. The choice of an industrializing country was based on three comparative elements: first, the country would have a relatively established pulp and paper industry; second, it would have similar products and process technologies to those found in Canada and, as much as possible, a similar pattern of production. Given these criteria, India was the best choice.
3.2 Choice of Research Strategy
In order to understand the issue of technical change processes and patterns at firm level, the research was intensively based on empirical data gathered principally at the mill level. A generalized description of a mill visit follows to explain how, and what, data was gathered:
The visits to each mill site lasted between five and ten successive working days with an average of ten hours per day. The first step was usually a meeting with the general manager or his representative. General trends of the mill were discussed and action planning for the visit conducted. The second step was to
obtain all of the organizational records concerned with financial and physical data from the financial department. At this point, a request for a list of capitalized technical changes was made. The third step was to complete and gather more information about the list of technical changes and/or projects for the period covered by the study. This was done by visiting and interviewing personnel in the technical and production department(s). This list was crucial because it served as one of the research tools. Having done this, the fourth step involved face-to-face interviews with a number of supervisory and technical staff. The fifth step was to review the data, follow-up the missing data and for explanation of problems inherent in the data. This was supplemented by discussions with financial and operation personnel in each mill in order to standardize the data collection as much as possible, and to validate the data analysis. Therefore, two major sources of information were tapped during the gathering process: a) direct observation and face to face interviews, b) organizational records.
A) Direct observation and face to face interviews
The following members of the organization were interviewed at each mill visited:
• General Manager (Managing Director)
• Heads of following departments:
• Engineering and/or technical services, maintenance
• Production (Pulp mill, Paper mill, other production departments)
• R&D laboratory (when located at the mill)
• Marketing and Sales (when located at the mill)
• Financial, Costs accounting and Purchasing
• Human Resources and Training
A special effort was made during the interviews to identify groups (formal and informal), units or individuals who had participated in change activities. These people, in turn, were interviewed and they composed the major part of the group involved in the face-to-face interviews. The interviews were structured around an open-ended discussion related to each department, in connection with specific key issues of the technical change processes (see section 3.3). An average of about 20 to 30 hours of interviews were conducted at each mill site.
B) Organizational records
The following is a summarized list of information obtained at each mill on a yearly basis for five to seven years (1984-1991):
• Production data:
• Products: major grades produced and changes in products over time
• Gross and net production of each production unit
• Data on rejects and lost time (per production units)
• Energy production (sources and quantity)
• Energy consumption (per unit of production)
• Raw material: fibres processed at the mill per categories such as bamboo, bagasse, reed, agricultural residues, etc.; fibres from other sources such as market pulp (national and international), waste paper, etc.; chemicals
• Labor inputs
• Financial data
• Detailed profit and loss accounts
• Detailed balance sheets
• Detailed financial reports to shareholders
• Detailed capital plans and budgets
• Any other internal financial reports available
• These financial documents were searched to find data on the following costs: materials, energy, labor (including overhead), maintenance, capital (Financial cost), capital investments, depreciation, sales revenues adjusted for inventory, etc.
• Engineering data
• General technical audit: general description of processes and equipment and a list of all the capitalized technical and technological changes
• Detailed engineering records on specific projects 3.3 Choice of a Performance Indicator
Generating a suitable performance indicator was a major component of the research. This was necessary because adopting the multiple performance indicators already used by the surveyed mills could not permit an adequate comparative analysis. As found by Sumanth (1981), most of the firms measuring productivity (about 80 percent) use "nonstandard productivity measures". Indeed, firms in the pulp and paper industry generally use no
standard productivity (or performance) measures, even when national pulp and paper technical associations are capable of synthesizing data to compare mills. The case mills were no exception.
To help minimize difficulties that usually occur when comparing productivity indices between mills, a "Total Productivity" (TP) index is used in this study. The approach used in measuring total productivity at the firm level utilizes an elementary, additive model2. Compared with sophisticated functional forms using logarithmic and multiplicative techniques, the method used here may compromise mathematical elegance, but enjoys the overwhelming advantage of being intuitively understandable. Chew (1988) clearly stresses the importance of such understandability to gain feedback from the management of the firms studied. The present approach follows the methods developed by the American Productivity Center (Kendrick & Creamer, 1965; Kendrick, 1984), and other practitioners such as Craig and Harris (1973), Krauss (1978) and Hayes (1982).
TP is calculated by dividing the sum of the Outputs (earnings) by the sum of the Inputs (costs). The costs are broadly classified as material, energy, labor and capital3. Input and Output values are calculated in constant prices. The approach used in measuring deflation indexes is described in Tremblay (1994). The coherence, relevance and adequacy of the TP index has already been ascertained and demonstrated by "physical" efficiency indicators, specific to the pulp and paper industry (Tremblay, 1994). Since the research examines a dynamic process of technical change generation, productivity growth is assessed by calculating the slope of a linear regression of the total productivity index against time (years). The "TP Growth index" or TPG is the most important single element used throughout the research to compare the dynamics of mills and their patterns of change. Its value is a percentage of growth per year.
2
The formula is simple in principle, however, its calculation requires an enormous amount of information. Not only was access to detailed financial information (quantity and price) required for the TP calculation, but production data was also necessary to validate the TP indices by other performance indicators specific to the industry. In all the mills surveyed, access to financial data, production data and engineering records was granted without restriction to the researcher. The accessibility to data on such a scale has made this research most valuable.
3
A fifth cost component is sometimes included, but was not in this study: "Other Costs" such as insurance, local taxes, etc. These elements seldom exceeded 2 percent of the total costs and were typically less than 0.5 percent.
3.4 Measure of Underlying Patterns of Technical Change
Information about the pattern of technical change in each mill was obtained during interviews, generally supplemented by access to detailed documents and records. Three approaches were followed in obtaining the necessary information. First, in each mill, detailed information was obtained about fixed capital investment over as long a period of time as possible. Second, as complete a listing as possible was made of the individual changes (identifiable change projects). Finally, qualitative information was gathered about technical changes.
From this gathered information, the present analysis makes a distinction between two general categories of technical changes: technical changes recorded by the company as fixed capital expenditure (RFCE) vs. technical changes unrecorded as fixed capital expenditure (UFCE).
I. Technical changes recorded by the company as fixed capital expenditure (RFCE)
The review of the underlying pattern of change consists of three elements: A)The level of recorded fixed capital expenditure (RFCE) is identified for
each mill, in the form of a ratio of RFCE to the value of the total gross fixed assets (GFAe) taken at the end of the period covered by this study. The association between investment and performance is also examined. B) The composition of RFCE is analyzed in terms of two main components:
"Improvement" investment and "Maintenance and Non-productive" investment. The former category includes changes intended to generate an improvement in products, processes and/or procedures. "Maintenance and Non-productive" changes include those implemented to maintain existing operations as well as other changes having no impact on productivity such as safety and pollution abatement which are mandatory to satisfy local legislation. The analysis seeks to identify the relationship between productivity growth in the mills and the composition of investment in terms of these categories - especially the intensity of improvement-centred capital expenditure.
C) The distribution of RFCE is analyzed in terms of the size of technical changes and is defined as follows: "Large" technical changes are defined as individual changes having a capital cost equivalent to more than 10 percent of GFAe. "Small" technical changes are defined as individual changes having a capital cost of 1 percent of GFAe or less. "Medium" changes are individual changes having a value between the two previous
categories. Finally, a last category called "minor changes" is defined as technical changes of individual value below 0.3 percent of GFAe. These categories are represented by a number consisting of a yearly average percentage of GFAe for the total costs of all changes4.
II. Technical change unrecorded as fixed capital expenditure (UFCE). This category includes modifications to the "hardware" of production facilities that may have been incorporated in minor components and parts, the costs of which were charged to current operating costs rather than treated as fixed capital expenditure. This would include, for instance, replacement of items regularly changed during maintenance, but that result in small increases in efficiency. This category would also include technical changes that are the results of aggregate, small concerted efforts having a cumulated overall impact on performance but which are UFCE. Changes brought about by small Ad Hoc groups are an example.
Almost by definition, it was not possible to obtain very much quantitative information about this category. The contribution of UFCE to performance improvement is difficult to assess. However, the general impression gained from interviews is that this change process is a significant issue explaining productivity growth differentials. Therefore, technical changes UFCE are assessed semi-quantitatively by two measurements.
First, throughout the interviews, a list of technical changes (recorded and unrecorded) that had taken place during the surveyed period was cumulated. From this list, mills were ordered comparatively by the intensity at which technical changes UFCE were introduced. A semi-quantitative Likert-type scale was used, ranging from "negligible" to "very substantial". It is important to note that this evaluation does not compare financial values of technical changes, but rather, the intensity at which they were undertaken. Generally, those technical changes are small in size and comparatively similar.
Second, interviewees were asked to express their view on the availability of uncommitted resources to generate change activities. Their answers were quantified on four levels:
• Uncommitted resources unavailable
4
An example is a mill that has a book value of one billion dollars at the end of the period surveyed, an individual large technical change (>10% GFAe) worth more than $100 000, and a small technical change (<10% GFAe) of less than $10 000.
• Little uncommitted resources available in sporadic areas of the organization but usually informally and frequently discouraged by top management
• Limited uncommitted resources available at various areas of the organization for projects judged by management to have potential (request for funds is usually formal)
• Ample uncommitted resources available (usually through a slush fund managed by overlapping groups of individuals committed to change).
4.
Result and Discussion
This section examines the data for the Canadian and Indian mills (referred as A, B, C, D, E, and Q, R, S, T) and explores the relationship between productivity growth and patterns of technical change across the combined samples of firms.
4.1 Technical Changes Recorded as Fixed Capital Expenditure 4.1.1 Investment and Performance
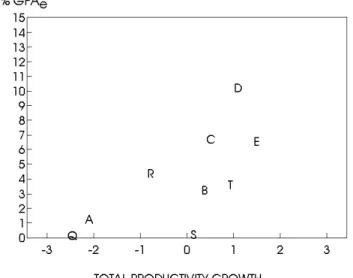
The relationship between yearly productivity figures and yearly capital investment, measured as annual total technical change RFCE and expressed as a ratio of gross fixed assets (GFAe), shows a clear relationship (pooled data analysis - coefficient = 2.7), but a weak one (with a constant of 905). Given this relationship, based on the sample mills, an increase of about 100% in fixed capital expenditure would increase total productivity by only 0.06%. Examining total technical change RFCE with total productivity growth gives a set of similar results. Figure 1 plots the relationship between total productivity growth (TPG) and total technical change RFCE (% GFAe). This plot suggests a weak relationship, with two kinds of anomalies. First, some mills have similar RFCE ratios, but very different rates of TPG (e.g., mill A and E). Second, some mills have a similar rate of TPG, but very different RFCE ratios (e.g., mill B and C on the one hand and mill T and D on the other). Spearman correlations also indicate similar findings, as shown in Table 1.
Table 1: Spearman correlation analysis between technical changes recorded as fixed capital expenditure and TPG.
Technical change recorded as fixed capital expenditure vs. TPG
All expenditure Improvement expenditure
TPG 0.6167 * 0.7667 **
Level of significance for the two-tailed test: * p<0.10, ** p<0.05
Figure 1: Technical changes recorded as fixed capital expenditure
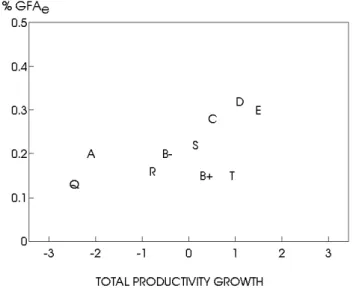
The relationship is stronger with regard to the total expenditure committed to improvement-type of changes as shown in Figure 2, depicting its relationship with TPG. The analysis of "improvement-type" change provides an interesting insight into company strategy. For example, mill D and E invested more than 80% of their total investment in improvement-type changes, whereas mill A invested more than 80% in maintenance and non-productive type of changes. It should be noted, however, that for the Indian mills, according to their accounting methods and fiscal incentives, it is mostly only improvement
projects that are capitalized upon. Therefore, the difference between all RFCE and improvement RFCE for the Indian cases resides mainly in "non-productive" changes such as safety and pollution abatement, whereas Canadian mills may capitalize on other kind of changes, such as new equipment needed for maintenance purposes.
Figure 2: Improvement technical changesrecorded as fixed capital expenditure
4.1.2 Size of Technical Changes
Due to the nature of the pulp and paper industry (supplier dominated and
scale intensive), it is expected that only a few large sporadic technical changes
would be identified. For all of the case mills, there are only four large identifiable improvement change projects (with a value of over 10% of GFAe) over the entire surveyed period, as shown in Table 2. It is relevant to note that the first three changes are generated entirely by external consultants and contractors. Since this paper focuses on the assessment of the intra-firm technical change process, it is important to evaluate a firm’s own contributions as opposed to external contributions. It is not possible to evaluate with complete accuracy the exact contribution of the large technical changes since they were introduced concomitantly with other smaller changes. However, it is possible to "remove" these changes by simply truncating the periods when large changes were introduced. This is workable since in mill B, the paper
machine modernization took place during the two first years surveyed, mill D had large changes only during the two last years and mill E had a large change only during the last year. Therefore, truncating those years leaves periods without large changes. Unfortunately, such a method has its drawbacks. As it will be argued in the next section, it underestimates the effect of minor changes introduced concomitantly with large ones since they are not accounted for during the truncated periods.
Table 2: Technical change processes - Firms’ contribution.
Large change Mill Generation TPG
Entire time period TPG Time period without large change Paper Machine Modernization B External 0.37 -0.47 Thermomechanical pulp plant E External 1.49 0.78 Sheeter Deinking plant D External In-house 1.09 0.53
The Paper Machine Modernization in mill B did have a substantial impact on productivity. However, one must bear in mind that the internal contribution to change and productivity in this mill is smaller than the overall figure made possible by external resources (suppliers).
The start-up in mill E of a new Thermomechanical pulp unit (TMP), coupled with the closure of the High Yield Sulphite (HYS) pulp unit is a major disruption to the trend, with both positive and negative effects, although overall, it is beneficial. The internal contribution to change and productivity in this mill is considerable since TPG is large even without the large sporadic change. Unfortunately, this figure underestimates the effect of other smaller changes that took place during the period when the large change was introduced.
The Sheeter at mill D was installed only in the last year of the period surveyed and did not have a significant effect on the productivity. However, the
important as the scale of investment in technical change in mill D was the particular way in which change was carried out. The implementation of change drew heavily on in-house capabilities. In particular, the deinking plant project was completely designed in-house. An estimate of the TPG before the introduction of the deinking plant gives a growth rate of 0.53% per year. Again, as for mill E, the internal contribution to change and productivity in this mill is considerable.
Though one should be aware that generalizing the present findings would be precarious (due to the small sample size of nine mills), a close examination of technical change sizes reveals important issues for the present analysis. First, the pattern of change analyzed in this paper corroborates that described by Pavitt (1984, 1988). A few large sporadic changes (originating mainly from external sources) are complemented with numerous medium and small changes. However, the large changes are not sufficient to explain productivity growth differentials between mills.
Second, there are no clear relationships between medium size changes RFCE and productivity growth. However, as discovered during the interviews, a significant element is that small technical changes surrounding the introduction of medium or larger change projects have an impact on the overall productivity5. This is also true for changes introduced as part of an overall change-generating program, as discussed in the next section. The relationship between minor technical changes RFCE (having an individual value of less than 0.3% GFAe) is found to be even more significant than for all of the small changes. Figure 3 depicts the annual average RFCE for minor changes and TPG. The capital letters refer to the entire time periods for mill B, D and E and the lowercase letters refer to shorter time periods - without large changes. It is pertinent to note (see Table 3) that in both mill D and E, the average values of minor changes are higher when analyzed over the entire survey period, than with shorter periods without large technical changes. This result clearly demonstrates the importance of minor changes in these two mills and their additional contribution to productivity growth. It also corroborates our previous statement that small changes are underestimated during periods when large changes are occurring. By contrast, in mill B the average value of minor changes is lower.
5
Figure 3: Minor technical changes recorded as fixed capital expenditure
Table 3: Minor technical changes recorded as fixed capital expenditure.
Mill B D E
Specific time periods
% GFAe % GFAe % GFAe
Entire time period 0.15 0.32 0.30 Time period without large changes 0.20 0.21 0.22
The pattern of minor change generation also seems to be associated with the generation of changes UFCE, as examined in the next section.
4.2 Technical Changes Unrecorded as Fixed Capital Expenditure
Technical changes UFCE appear to have a strong, semi-quantitative relationship with the rate of productivity growth (Table 4). These changes are important in explaining the differences between, for example, mill C and mill E: mill E had a greater TPG than mill C despite mill E’s smaller ratio of
improvement changes RFCE (Figure 2). The assessment of the technical changes UFCE can also explain the differences between mill D and mill E. At mill E, concerted improvement investments in small technical changes UFCE had a cumulative effect on the productivity growth, which added significantly to the impact of technical changes RFCE. This pattern of change is also corroborated by the availability of uncommitted resources for change-generating activities (Table 4). A close analysis of production and performance data clearly demonstrates the present relationship (Tremblay, 1994). Examples of the pattern of change in some mills are illuminating.
Table 4: Spearman correlation analysis between technical changes unrecorded as fixed capital expenditure and TPG.
Unrecorded as fixed capital expenditure
Uncommitted resources availability Entire time periods Time periods without large changes Entire time periods Time periods without large changes TPG 0.8464 ** 0.8768 ** 0.9619 **** 0.7353 **
Level of significance for the two-tailed test: * p<0.10, ** p<0.05;*** p<0.01, **** p<0.001
In mill E there was a substantial amount of technical change UFCE. These changes were included in operational and maintenance expenses. Within the former, "slush funds" were available for small project execution. There was an organizational system encouraging and sustaining the generation of small changes on a continuous basis. It is a written policy of the company to use such change-generating activities to increase the overall profitability of the mill. Changes were well orchestrated and were the results of concerted efforts. Most of them were performed by Ad Hoc groups and supervised by the Quality Improvement and Process Improvement departments. There was between 20 and 26 Ad Hoc groups per year (with six to ten people in each), each one performing specific improvement project leading. These groups generated a multitude of technical changes UFCE. The cumulative effect of these changes had a clear and definite impact on performance.
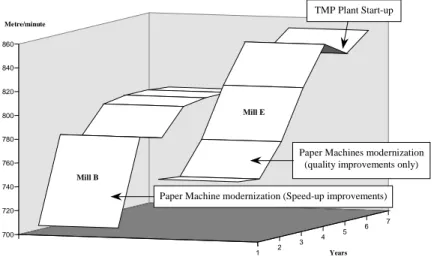
Many improvements in physical performance can only be explained by changes that are UFCE. This can be illustrated with reference to the key issue of the paper machine speed of mill E (Figure 4). Modifications RFCE to three
out of four paper machines were carried out during year 2. However, all four of the paper machines improved their speed. Moreover, the technical personnel clearly indicated that these changes were not intended to increase the speed of the machine, but the quality of the paper. It appears that speed was improved through small, concerted changes UFCE and not so much from the changes RFCE. Again, this pattern of change in the successfully productive mill E can be compared with the productivity-stagnant mill B, as shown in Figure 4. The average speed of all paper machines in mill E increased continuously even five years after they had been modified (excluding year 6 when the TMP plant started-up, causing disruptions due to a different pulp composition). By comparison, the strong paper machine speed (average) increase during year 1 in mill B was the result of one machine speed-up in that same year. However, the average speed did not continue to increase as it did in mill E. Interestingly, technical changes UFCE in mill B were assessed as being "meager" as compared to "substantial" in the case of mill E. Furthermore, the level of available uncommitted resources was lower for mill B than for mill E (3 vs. 7 on an 8 point scale).
Similar to mill E, in mill D there was a significant number of technical changes UFCE. These changes were usually included in the maintenance expenses as "special projects". They were also included in the operation costs. For example, over a period of three years there were only a few recorded changes greater than 0.3 percent GFAe, yet, the TP increased throughout that period. This increase can only be explained by internal factors and a stream of small unrecorded changes. The significance of this pattern of change was made obvious during the interviews.
1 2 3 4 5 6 7 700 720 740 760 780 800 820 840 860 Metre/minute Years
Figure 4: Paper Machine Speed - Mill B and E
Mill E
Mill B
TMP Plant Start-up
Paper Machines modernization (quality improvements only)
Paper Machine modernization (Speed-up improvements)
At the other end of the spectrum, in mill A, technical changes UFCE were negligible. Financial support for such changes was nonexistent. The generation of this latter type of change was difficult since strict management control procedures do not permit small expenditures on technical changes outside the fixed capital expenditure budget (expenditures with a value exceeding about 0.01 percent GFAe require the approval by the Managing Director). In addition, there were no incentives to generate such changes informally. Similarly, in mill Q, technical changes UFCE were at best, negligible. Financial support for such changes was nonexistent. Furthermore, there were strong management disincentives to generate such changes informally.
If it were possible to add the two categories of improvement type (UFCE and RFCE), it would probably show a relatively clear relationship between the commitment of resources to "improvement-type" technical change and productivity growth.
5.
Conclusion
The aim of this paper was to examine the change processes at the firm level--in particular, changes that were level--initiated withlevel--in the firms themselves. The research project therefore required in-depth data at the firm level and this limited the number of cases that it was possible to study. Nonetheless, one of the major strengths of this study is its comprehensive database. Very rarely
have studies had access to such a wide spectrum of data, both financial and technical, from mill records and direct access to mill personnel. Furthermore, the second most important strength of this study is its comparative framework and its longitudinal data set.
This section examines two aspects of the results, the inter-firm analysis and the inter-country comparison.
5.1 Inter-firm Analysis
The link between Total Productivity Growth (TPG) and the underlying pattern of technical change demonstrated three elements:
1. There was a weak relationship between TPG and the spending on technical changes recorded as fixed capital expenditure (RFCE).
2. There was a stronger relationship between TPG and the resources committed to "improvement-type" technical changes RFCE.
3. There was a relatively clear (semi-quantitative) relationship between TPG and the resources committed to "improvement-type" projects unrecorded as fixed capital expenditure (UFCE). A particularly important finding was that this was one of the most important elements explaining productivity growth differences between the two best mills (E and D) and the other mills. TPG differences could not be explained solely with technical changes RFCE.
This paper highlights the importance of managing change as a continuous process. The introduction of intermittent, step-jump technical changes contributed little to explain the differences in performance between the mills. Much more important (particularly with respect to the difference between Mills D and E and the others), are (i) the continuing sequences of smaller investments in technical change, often linked to the larger step-jumps, and (ii) the existence of steady streams of changes and improvements that are UFCE. Thus, the findings are consistent with other recent studies (see, for example, Bessant et al., 1993, 1994a, b; Ishikure, 1988; Melcher et al., 1990) that have highlighted the relationship between performance and technical/organizational changes, particularly continuous improvement.
It appears that it is not so much the amount of investment spent as the commitment to improvement that makes the difference. In a paper that focuses on capabilities embodied in organizational systems, Tremblay (1997, 1998) examines how mills that are committed to improvement are differentiated from those that are not.
5.2 Inter-country Differences
The comparative analysis of the rates of productivity growth does not indicate a clear difference between India and Canada. However, this analysis shows that, in general, the majority of the Indian mills have lower rates of productivity growth than the Canadian mills. The review of patterns of technical changes however, indicates that the total technical change annual RFCE - expressed as a ratio of gross fixed assets - is smaller in Indian mills than Canadian mills (Figure 1). This clear dichotomy disappears when the analysis focuses on spending committed to improvement-centred changes (Figure 2). Nevertheless, in general, the majority of the Indian mills have lower ratios of improvement than the Canadian mills. Inter-mill differences in productivity growth seem to be more strongly influenced by the efforts made by individual organizations to generate change than by the country’s context. In conclusion, since inter-country differences do not provide a convincing contrast, the research on developed/developing countries would probably be more fruitful if efforts were made to analyze the resources required to manage and actualize the generation of technical changes.
References
Abernathy, W.J. and Wayne, K.( 1974) Limits of the learning curve. Harvard
Business Review. 52, 109-119.
Bell, M. and Scott-Kemmis, D. (1990) The Mythology of Learning by Doing
in World War II Airframe and Ship Production. Science Policy Research
Unit, University of Sussex.
Bessant, J. (1997a) "Developing technological capability through manufacturing capability" International Journal of Technology
Management, 14, 177-195.
Bessant, J. (guest editor) (1997b) IJTM Special Issue on Continuous Improvement. International Journal of Technology Management, 14, No.1.
Bessant, J., Burnell, J., Harding, R., and Webb, S. (1993) Continuous Improvement in British Manufacturing. Technovation, 13, 241-254. Bessant, J., Caffyn, S., and Gilbert, J. (1994a) Mobilising incremental
innovation for strategic advantage. Centre for Research in Innovation
Management, University of Brighton, UK.
Bessant, J., Caffyn, S., Gilbert, J., Harding, R., and Webb, S. (1994b) Rediscovering Continuous Improvement. Technovation. 14, 17-29. Chew, B.W. (1988) No-Nonsense Guide to Measuring Productivity. Harvard
Business Review, Jan-Feb, 110-118.
Cortes, M., Berry, A., and Ishaq, A. (1987) What Makes for Success in Small
and Medium Scale Enterprises. Oxford University Press, Oxford.
Craig, C.E. and R.C. Harris. (1973) Total Productivity Measurement at the Firm Level. Sloan Management Review, Spring, 13-29.
Dutton, J.M. and A. Thomas. (1984) Treating Progress Functions as a Managerial Opportunity American Management Review, 9, 235-247. Enos, J.L. (1962) Petroleum Progress and profits; a History of Process
Innovation. MIT Press, Cambridge, MA.
Handoussa, H., Nishimizu, M., and Page J.M., Jr. (1986) Productivity change in Egyptian public sector industries after the "opening", 1973-79. Journal
Hayes, R.D. (1982) A Note on Productivity Accounting. Harvard Business
School Note 9-682-084. Boston, HBS Case Services, Harvard Business
School.
Hollander, S. (1965) The Sources of Increased Efficiency: A Study of Du Pont
Rayon Plants. MIT Press, Cambridge, MA.
Ishikure, K. (1988) Achieving Japanese Productivity and Quality Levels at a US Plant. Long Range Planning, 21, 10-17.
Kaplinsky, R. (1994) Easternisation. The Spread of Japanese Manufacturing
Techniques to Developing Countries. Frank Cass, Ilford.
Kendrick, J.W. (1984) Improving Company Productivity. Handbook with
Case Studies. John Hopkins University Press, London.
Kendrick, J.W. and Creamer, D. (1965) Measuring Company Productivity.
Studies in Business Economics, 89, National Industrial Conference Board,
New York.
Kimberly, J.R. (1981) Managerial innovation. in Starbuck, W.H. and Nystrom, P.C. (Eds) Handbook of organizational design. Vol. 1, Oxford University Press, New York. pp. 84-104.
Kraus, J. (1978) Productivity and Profit Models of the Firm. Business
Economics, Sept., 10-14.
Mansfield, E. (1968) The Economics of Technological Change, Norton, New York.
Melcher, A. et al. (1990) Standard Maintaining and Continuous Improvement Systems; Experiences and Comparisons. Interfaces. 20, 24-40.
Nelson, R.R. (1981) Research on Productivity Growth and Productivity Differences: Dead Ends and New Departures. Journal of Economic
Literature, 19, 1029-1064.
Nishimizu, M. Page, J.M. Jr. (1982) Total factor productivity growth, technological progress and technical efficiency changes: Dimensions of productivity change in Yugoslavia, 1956-78. Economic Journal, 92, 920-936.
Pack, H. (1988) Industrialization and Trade. in Chenery, H.B. and Srinivasan, T.N. Handbook of Development Economics. Elsevier, Oxford. pp.333-380. Page, J. (1980) Technical efficiency and economic performance: Some
Pavitt, K. (1988) International Patterns of Technological Accumulation. in Hood, N. and Vahlne, J-E. (Eds) Strategies in Global Competition. Croom Helm, London. pp.126-157.
Pavitt, K. (1984) Sectoral Patterns of Technical Change: Towards a Taxonomy and Theory. Research Policy, 13, 343-373.
Robinson, A (Ed.) (1991) Continuous Improvement in Operations. A
Systematic Approach to Waste Reduction. Productivity Press, Cambridge,
MA.
Rosenberg, N. (1982) Inside the Black Box: Technology and Economics. Cambridge University Press, London.
Rosenberg, N. (1976) Perspectives on Technology. Cambridge University Press, London.
Sumanth, D.J. (1981) Productivity Indicators Used by Major U.S. Manufacturing Companies: Results of a Survey. Industrial Engineering, May, 70-73.
Tremblay, P.J. (1998) Organize to generate innovation. Tools to measure technical change, productivity and change-generating efforts. CIRANO
Scientific Series 98s-12. Montreal, CIRANO.
Tremblay, P.J. (1997) Measurement of Productivity and Organizational Commitment to Change. in Thor, C.G. et al. (Eds) Productivity & Quality
Management Frontiers - VI. Engineering & Management Press, Norcorss.
pp. 165-176.
Tremblay, P.J. (1994) Comparative Analysis of Technological Capability and
Productivity Growth in the Pulp and Paper Industry in Industrialised and Industrialising Countries. Science Policy Research Unit, University of
Sussex, Unpublished Doctoral Dissertation.
Tremblay, P.J. (1988) Technical change, Information Technology and the
Paper Industry: Some Implications for Third World Countries. Science
Policy Research Unit, University of Sussex, Unpublished M.Sc. Dissertation.
World Development. (1995) Industrial Organization and Manufacturing Competitiveness in Developing Countries. World Development, 21 Special edition.
APPENDIX
Significance of R&D Inputs to the Change Process
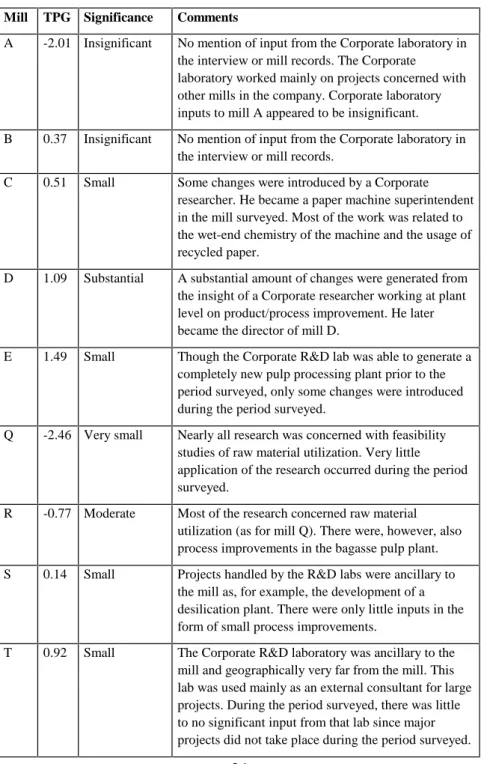
All case mills had Corporate R&D labs. However, information about how much capital is spent on R&D was not uniformly gathered for all case mills. The reason for this lack of consistency is that generally these labs are also engaged in activities with other mills than those specifically studied in this research. General accounting methods do not include these expenses as fixed capital expenditure, but rather as corporate overhead expenses. The latter is generally calculated using a ratio of a mill’s profit to the company total profit or production figures to company overall production. Such calculation has nothing to do with factual R&D expenditure inputs to the mill. Therefore, obtaining precise information about specific expenses was not possible. Nonetheless, the contribution of these labs to the change process was evaluated semi-quantitatively through interviews and an examination of mill documentary records. Overall, it was extremely surprising to discover that the input of R&D labs in the change process is, in most case mills, small or insignificant. Nonetheless, input was moderate in one mill and substantial in another (Table A). It is worth mentioning that in the “moderate” case, most of the research output was concerned with raw material utilization. In India, fibre availability is problematic. Thus, the research is conducted in order to discover new potential sources of fibres. However, this research has little impact on the overall productivity figures. In the “substantial” case, most of the R&D inputs came from a single researcher working at the plant level. His contributions were analyzed as unrecorded fixed capital expenditure.
Table A: Significance of R&D inputs to the change process Mill TPG Significance Comments
A -2.01 Insignificant No mention of input from the Corporate laboratory in the interview or mill records. The Corporate
laboratory worked mainly on projects concerned with other mills in the company. Corporate laboratory inputs to mill A appeared to be insignificant. B 0.37 Insignificant No mention of input from the Corporate laboratory in
the interview or mill records.
C 0.51 Small Some changes were introduced by a Corporate researcher. He became a paper machine superintendent in the mill surveyed. Most of the work was related to the wet-end chemistry of the machine and the usage of recycled paper.
D 1.09 Substantial A substantial amount of changes were generated from the insight of a Corporate researcher working at plant level on product/process improvement. He later became the director of mill D.
E 1.49 Small Though the Corporate R&D lab was able to generate a completely new pulp processing plant prior to the period surveyed, only some changes were introduced during the period surveyed.
Q -2.46 Very small Nearly all research was concerned with feasibility studies of raw material utilization. Very little application of the research occurred during the period surveyed.
R -0.77 Moderate Most of the research concerned raw material utilization (as for mill Q). There were, however, also process improvements in the bagasse pulp plant. S 0.14 Small Projects handled by the R&D labs were ancillary to
the mill as, for example, the development of a desilication plant. There were only little inputs in the form of small process improvements.
T 0.92 Small The Corporate R&D laboratory was ancillary to the mill and geographically very far from the mill. This lab was used mainly as an external consultant for large projects. During the period surveyed, there was little to no significant input from that lab since major projects did not take place during the period surveyed.
Liste des publications au CIRANO *
Cahiers CIRANO / CIRANO Papers (ISSN 1198-8169)
96c-1 Peut-on créer des emplois en réglementant le temps de travail ? / Robert Lacroix 95c-2 Anomalies de marché et sélection des titres au Canada / Richard Guay, Jean-François
L'Her et Jean-Marc Suret
95c-1 La réglementation incitative / Marcel Boyer
94c-3 L'importance relative des gouvernements : causes, conséquences et organisations alternative / Claude Montmarquette
94c-2 Commercial Bankruptcy and Financial Reorganization in Canada / Jocelyn Martel 94c-1 Faire ou faire faire : La perspective de l'économie des organisations / Michel Patry
Série Scientifique / Scientific Series (ISSN 1198-8177)
98s-12 Organize to Generate Innovation: Tools to Measure Technical Change, Productivity and Change-Generating Efforts / Pierre J. Tremblay
98s-11 Worksharing in Québec : Five Case Studies / Michael Huberman et Paul Lanoie 98s-10 Predictors of Hierarchical Success for Male and Female Canadian Managers / Denis
Chênevert et Michel Tremblay
98s-09 Managerial Career Success in Canadian Organizations: Is Gender a Determinant? / Denis Chênevert et Michel Tremblay
98s-08 Job Characteristics and the Form of Compensation / W. Bentley MacLeod et Daniel Parent
98s-07 Technological Capability and Productivity Growth: An Industrialized / Industrializing Country Comparison / Pierre J. Tremblay
98s-06 L'évolution du taux d'activité des femmes au Canada, 1976-1994 : Une analyse de cohortes / Paul Beaudry et Thomas Lemieux
98s-05 Dix exemples de rentabilité financière liés à une saine gestion environnementale / Paul Lanoie et Georges A. Tanguay
98s-04 Effects of Workers' Compensation: A Survey / Bernard Fortin et Paul Lanoie 98s-03 Dépendance à l'égard de l'aide sociale et réforme de la sécurité du revenu / Bernard Fortin 98s-02 Risk Aversion, Intertemporal Substitution, and Option Pricing / René Garcia et Éric
Renault
98s-01 Learning-by-Doing and Strategic Trade Policy / Hassan Benchekroun, Ngo Van Long et Huilan Tian
97s-42 Sector-Specific On-the-Job Training: Evidence from U.S. Data / Lars Vilhuber 97s-41 Competition and Access in Electricity Markets: ECPR, Global Price Cap, and Auctions /
Marcel Boyer et Jacques Robert
97s-40 Strategic Adoption of a New Technology under Uncertain Implementation / Marcel Boyer
* Vous pouvez consulter la liste complète des publications du CIRANO et les publications elles-mêmes sur notre site World Wide Web à l'adresse suivante :