Evaluation of floor accelerations and spectra in linear and
nonlinear regular RC frame buildings
by
Rahaf SHEIKH ALARD
THESIS PRESENTED TO ÉCOLE DE TECHNOLOGIE SUPÉRIEURE
IN PARTIAL FULFILLMENT FOR A MASTER’S DEGREE
WITH THESIS IN CONSTRUCTION ENGINEERING
M.A.Sc.
MONTREAL, JULY 15, 2020
ÉCOLE DE TECHNOLOGIE SUPÉRIEURE
UNIVERSITÉ DU QUÉBEC
This Creative Commons license allows readers to download this work and share it with others as long as the author is credited. The content of this work can’t be modified in any way or used commercially.
BOARD OF EXAMINERS THESIS M.SC.A.
THIS THESIS HAS BEEN EVALUATED BY THE FOLLOWING BOARD OF EXAMINERS
Mrs. Rola Assi, Thesis Supervisor
Department of Construction Engineering, École de Technologie Supérieure
Mr. Alan Carter, President of the jury
Department of Construction Engineering, École de Technologie Supérieure
Mr. Lotfi Guizani, Member of the jury
Department of Construction Engineering, École de Technologie Supérieure
THIS THESIS WAS PRENSENTED AND DEFENDED
IN THE PRESENCE OF A BOARD OF EXAMINERS AND PUBLIC JUNE 04, 2020
ACKNOWLEDGMENT
I would like to thank my Master's supervisor, Ms. Rola Assi, for her efforts in this project, availability, and financial support through the NSERC Discovery Grant. .
I wish to express my sincere thanks to École de technologie supérieure (ÉTS) for providing me with all the necessary facilities. I am grateful to the library team of ÉTS for their commitment to service and dedication to the job. I am also thankful to the team of ÉTS student services and ÉTS Student Association for their support and organizing friendly and helpful activities.
I take this opportunity to thank my family for almost four decades of love, support, and encouragement. And to my lover Mohamed, whose love, wisdom, and generosity have enriched my life.
I also express my gratitude to my friends and all who, directly or indirectly, have lent their hand for helping in this journey.
Évaluation des accélérations et des spectres de plancher dans les bâtiments réguliers à ossature en béton armé dans le domaine linéaire et non linéaire
Rahaf SHEIKH ALARD
RÉSUMÉ
Ce projet vise à étudier l'effet de la ductilité des bâtiments sur les demandes en termes d’accélérations des composants non structuraux (CNS). Il vise également à évaluer les méthodes simplifiées disponibles dans la littérature ainsi que l'équation proposée dans la récente norme NIST.GCR.18.917.43 pour calculer les demandes d'accélération des CNS dans les bâtiments inélastiques. À cette fin, un bâtiment typique de 6 étages est conçu selon l'édition 2015 du Code national du bâtiment du Canada (CNB) pour quatre cas : 1) cadre modérément ductile à Montréal, 2) cadre conventionnel à Montréal, 3) cadre ductile à Vancouver, et 4) cadre conventionnel à Vancouver. Montréal et Vancouver ont été choisies pour représenter la sismicité de l'est et de l'ouest du Canada, respectivement. Les structures susmentionnées ont été soumises à douze et dix-sept enregistrements artificiels avec une probabilité de 2 et 10% sur 50 ans à Montréal et Vancouver, respectivement. La sélection et l’étalonnage des enregistrements sont compatibles avec les spectres d’aléa uniforme spécifiés dans l'édition 2015 du CNB. Les demandes d'accélération sismique des CNS exprimés en termes de l’amplification en fonction de la hauteur (Ax), du facteur d'amplification de réponse (Ar) et de spectres de réponse du plancher (FRS) sont générées en effectuant une analyse dynamique linéaire et non linéaire, et en appliquant la méthode simplifiée de Kothari et al. (2017), à l'aide du logiciel SAP2000®. Le profil PFA/PGA obtenu et Ar sont comparés à ceux proposés dans le CNB 2015 et le rapport NIST.GCR.18.917.43. Les résultats ont montré que la ductilité du cadre tend à réduire les demandes d'accélération des CNS et que cet avantage est moindre dans les cadres de construction conventionnelle par rapport aux cadres ductiles et modérément ductiles. Les demandes d'accélération sismique des CNS à Vancouver sont plus élevées qu'à Montréal pour tous les cas étudiés. Les FRS générés par la méthode simplifiée sont en bon accord en termes de forme avec ceux obtenus par l'analyse dynamique non linéaire, mais sous-estiment les ordonnées des FRS. Enfin, la demande PFA/PGA suggérée par le CNB 2015 est conservatrice pour les bâtiments inélastiques alors que la valeur de Ar est sous-estimée. Les demandes suggérées par NIST.GCR.18.917.43 correspondent mieux aux demandes requises que le NBC 2015.
Mots-clés: Spectres de réponse du plancher, composants non structuraux, composants
opérationnels et fonctionnels, analyse non-linéaire, ductilité, béton armé et cadres résistants aux moments.
Evaluation of floor accelerations and spectra in linear and nonlinear Regular RC Frame Buildings
Rahaf SHEIKH ALARD
ABSTRACT
This project aims to investigate the influence of building ductility on nonstructural components (NSCs) acceleration demands. It targets also to evaluate simplified methods available in the literature as well as the equation proposed in the recent report NIST.GCR.18.917.43 to compute the NSCs acceleration demands in inelastic buildings. For this purpose, a typical 6- story frame building is designed according to 2015 edition of National Building Code of Canada (NBC) for four cases: 1) moderately ductile frame in Montreal, 2) conventional frame in Montreal, 3) ductile frame in Vancouver, and 4) conventional frame in Vancouver. Montreal and Vancouver were chosen to represent the seismicity in east and west of Canada, respectively. The aforementioned structures were subjected to twelve and seventeen artificial records with 2 and 10% per 50 year probability in Montreal and Vancouver, respectively. The selected and scaled records are compatible with the Uniform Hazard Spectra specified in the 2015 edition of the NBC. The seismic acceleration demands of NSCs in terms of height factor (Ax), component amplification factor (Ar), and floor response spectra (FRS) are generated by performing linear and nonlinear dynamic analysis, and applying the simplified method of Kothari et al. (2017), using SAP2000® software. The obtained factors A
x and Ar are compared to the ones proposed by NBC 2015 and the report NIST.GCR.18.917.43. The results showed that the frame ductility tends to reduce the NSCs acceleration demands and this benefit is less in the conventional construction frames as compared to the ductile and moderately ductile frames. Also, it was found that the seismic acceleration demands of NSCs are higher in Vancouver than in Montreal. The FRS generated by the simplified method are in a good agreement in terms of the shape with the ones obtained from the nonlinear dynamic analysis, but underestimate the ordinates of the FRS. Finally, the PFA/PGA demand suggested by the NBC 2015 is conservative for the inelastic building while the value of Ar is underestimated. The demands suggested by NIST.GCR.18.917.43 fit the required demands better than NBC 2015.
Keywords: Floor response spectra, nonstructural components, operational and functional
TABLE OF CONTENTS
Page
INTRODUCTION ...1
CHAPITRE 1 LITERATURE REVIEW ...7
1.1 Introduction ...7
1.2 The importance of NSCs seismic design ...9
1.3 Approaches to estimate the seismic demands of NSCs ...11
1.3.1 Code provisions for horizontal seismic force demands on NSCs ... 12
1.3.2 Floor acceleration demands according to NIST.GCR.18.917.43 ... 17
1.3.3 Floor Response Spectra approach ... 19
1.4 Proposed methods to determine seismic demands on NSCs mounted to inelastic buildings ...22
1.4.1 PFAs distribution along the relative height ... 22
1.4.2 Peak component acceleration (PCA) ... 23
1.5 Summary ...31
CHAPITRE 2 SEISMIC DESIGN OF REINFORCED CONCRETE MOMENT RESISTING FRAMES ...33
2.1 Introduction ...33
2.2 Description of building ...34
2.3 Load combinations ...34
2.4 Seismic design considerations ...36
2.5 Modal Analysis ...36
2.6 Determination of seismic design forces ...38
2.6.1 Gravity loads ... 38
2.6.2 Seismic base shear forces ... 40
2.7 Static Analyses ...43
2.8 Seismic design ...44
2.8.1 Design of the ductile frame ... 44
2.8.2 Design of the moderately ductile frame ... 46
2.8.3 Design conventional construction frames ... 47
2.9 Drift ratio ...50
2.10 Summary ...51
CHAPITRE 3 SELECTION AND SCALING OF GROUND MOTION RECORDS ...53
3.1 Introduction ...53
3.2 Selection and scaling of ground motion records ...53
3.2.1 Moderately ductile frame in Montreal ... 55
3.2.2 Conventional construction frame in Montreal ... 58
3.2.3 Ductile frame in Vancouver ... 61
3.2.4 Conventional construction frame in Vancouver ... 65
CHAPITRE 4 LINEAR AND NONLINEAR ANALYSIS OF THE CASE STUDY
BUILDINGS ...70
4.1 Linear Dynamic Analysis ...70
4.2 Nonlinear Dynamic Analysis ...71
4.3 Simplified method of Kothari et al. (2017) ...77
4.3.1 Ductile frame in Vancouver ... 77
4.3.2 Conventional construction frame in Vancouver ... 84
4.3.3 Moderately ductile frame in Montreal ... 89
4.3.4 Conventional construction frame in Montreal ... 93
4.4 Summary ...97
CHAPITRE 5 RESULTS ...98
5.1 Evaluation the effect of ductility ...98
5.1.1 Height factor Ax ... 98
5.1.2 Floor response spectra (FRS) ... 100
5.1.3 Component amplification factor, Ar ... 105
5.2 Effect of building location ...108
5.3 Evaluation the simplified method of Kothari et al. (2017) ...110
5.3.1 Height factor Ax ... 110
5.3.2 Floor response spectra (FRS) ... 112
5.4 Evaluation of NIST GCR 18-917-43 (2018) ...114
5.4.1 Height factor Ax ... 114
5.4.2 Component amplification factor Ar ... 116
5.5 Evaluation of the product (Ax.Ar) ...118
5.6 Summary ...121
CONCLUSIONS ...123
RECOMMENDATIONS ...127
APPENDIX I SELECTION AND SCALING OF GROUND MOTIONS ...128
APPENDIX II SECTION ANALYSIS OF PHB1 SECTION BY RESPONSE 2000...132
APPENDIX III PLASTIC HINGES PROPERTIES AND ACCEPTTANCE CRITERIA ...134
APPENDIX IV FRS, Rcb, and Ar IN FLOORS 1, 3, 4, and 5 ...145
LIST OF TABLES
Page
Table 1.1 Codes formulas of horizontal seismic design forces on NSCs ...13
Table 1.2 Design ground accelerations and amplification factors in the codes formulas ...13
Table 1.3 PCA/PFA and component ductility values ...19
Table 1.4 Suggested frequencies in (Hz) for generating FRS ...20
Table 1.5 Values of parameter α ...22
Table 1.6 Values of parameter β ...23
Table 1.7 Values of m1, mr, and Armax ...26
Table 1.8 Values of a, b and Ar for different ranges of structural periods ...27
Table 2.1 The values of gravity loads used in the design ...34
Table 2.2 Load combinations considered for seismic design of building as per NBC ...34
Table 2.3 Types of flexural resistance and their relationship as per CSA A23.3 ...36
Table 2.4 Modal periods, NBC 2015 limit, and the considered period in the seismic design ...37
Table 2.5 Force modification factors in concrete structures as per NBC 2015 ...41
Table 2.6 Factors Mv for moment resisting frames as per NBC 2015 ...42
Table 2.7 Base shear force calculations for case of studied buildings ...42
Table 2.8 Lateral loads for each floor level for buildings in Vancouver ...43
Table 2.9 Lateral loads for each floor level for buildings in Montreal ...43
Table 2.10 Shear resistance of frame joints at different levels of ductility as per CSA A23.3 ...45
Table 3.1 Modal periods and ranges for ground motion scaling for the studied
buildings ...55
Table 3.2 Scaling factors of selected records of moderately ductile frame in Montreal ...56
Table 3.3 Scaling factors of selected records of moderately ductile frame in Montreal ...56
Table 3.4 Scaling factors of selected records of conventional frame in Montreal ...59
Table 3.5 Scaling factors of selected records of conventional frame in Montreal ...59
Table 3.6 Scaling factors of selected records of ductile frame in Vancouver ...62
Table 3.7 Scaling factors of selected records of ductile frame in Vancouver ...62
Table 3.8 Scaling factors of selected records of conventional frame in Vancouver ..66
Table 3.9 Scaling factors of selected records of conventional frame in Vancouver ..66
Table 4.1 Obtained parameters from idealized relationship ...79
Table 4.2 Equivalent stiffness and stiffness reduction factors at IO and LS performance levels for the 2D ductile frame in Vancouver ...79
Table 4.3 Ground motion records and scaling factors (SF) at IO and LS performance levels used in the 1st iteration for the ductile frame in Vancouver ...81
Table 4.4 Mean values of maximum roof displacement, maximum base shear, and SRF at IO and LS performance level of the ductile frame in Vancouver ...82
Table 4.5 Iterations results at IO and LS performance levels for the ductile frame in Vancouver ...83
Table 4.6 Obtained parameters from idealized relationship ...85
Table 4.7 Equivalent stiffness and stiffness reduction factors at IO and LS performance levels for the 2D conventional construction frame in Vancouver ...85
Table 4.8 Used ground motion at IO and LS performance levels in the 1st iteration for the conventional construction frame in Vancouver ...86
Table 4.9 Mean value of maximum roof displacement, maximum base shear, and SRF at IO and LS performance levels of the conventional
construction frame in Vancouver ...87 Table 4.10 Equivalents stiffness and damping iterations results at IO and LS
performance levels for conventional construction frame in Vancouver ....88 Table 4.11 Obtained parameters from idealized relationship ...90 Table 4.12 Equivalent stiffness and stiffness reduction factors at IO and LS
performance levels for the 2D moderately ductile frame in Montreal ...90 Table 4.13 Used ground motion at IO and LS performance levels in the 1st
iteration for the moderately ductile frame in Montreal ...91 Table 4.14 Mean value of maximum roof displacement, maximum base shear,
and SRF at IO and LS performance levels of the moderately ductile frame in Montreal ...91 Table 4.15 Equivalents stiffness and damping iterations results at IO and LS
performance levels for moderately ductile frame in Montreal ...92 Table 4.16 Obtained parameters from idealized relationship ...94 Table 4.17 Equivalent stiffness and stiffness reduction factors at IO and LS
performance levels for the 2D conventional frame in Montreal ...94 Table 4.18 Used ground motion at IO and LS performance levels in the 1st
iteration for the conventional frame in Montreal ...95 Table 4.19 Mean value of maximum roof displacement, maximum base shear,
and SRF at IO and LS performance levels of the conventional frame in Montreal ...95 Table 4.20 Equivalents stiffness and damping iterations results at IO and LS
LIST OF FIGURES
Page
Figure 1.1 Structural and nonstructural components of a typical building ...8
Figure 1.2 Relative investments in typical buildings ...9
Figure 1.3 Failure of suspended lighting fixtures in an office building in 2001 Nisqually earthquake (Mw=6.8) ...10
Figure 1.4 Severe damage to the masonry cladding of the former Montreal East City Hall during the 1988 Saguenay earthquake (Mw=5.9) ...10
Figure 1.5 Nonstructural damage in 2011 Christchurch earthquake (Mw= 6.2) ...11
Figure 1.6 The distribution of PGA amplification along the relative height according to the NBC 2015, ASCE 7-16 and Eurocode 8 ...15
Figure 1.7 The component amplification factor Ar according to the current codes ....16
Figure 1.8 Time history and direct spectra to spectra methods to generate FRS ...21
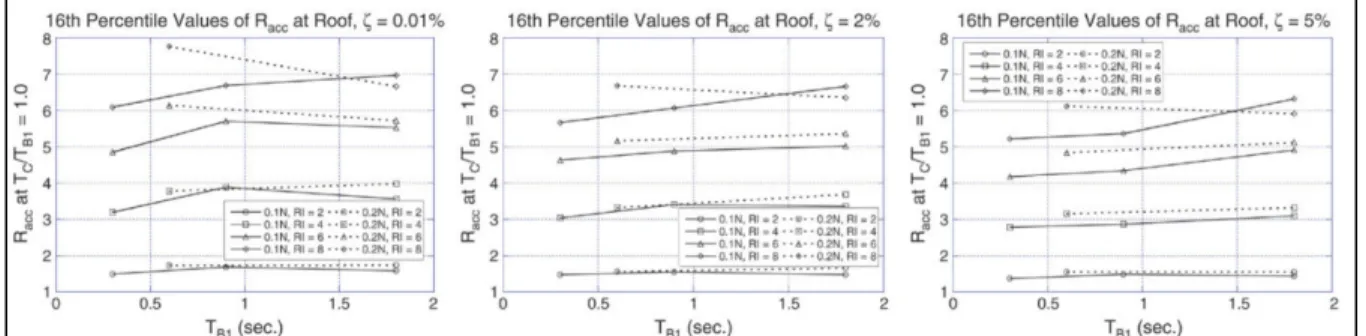
Figure 1.9 Racc values at roof level for various component damping ratios at the 1st period...24
Figure 1.10 Racc values at roof level for various component damping ratios at the 2nd period ...24
Figure 1.11 Flowchart for the simplified method...29
Figure 2.1 Plan view of RC moment resisting frame building model ...35
Figure 2.2 Elevation view of the RC moment resisting frame building model ...35
Figure 2.3 Three dimensional model of a case study building created by SAP2000® ...37
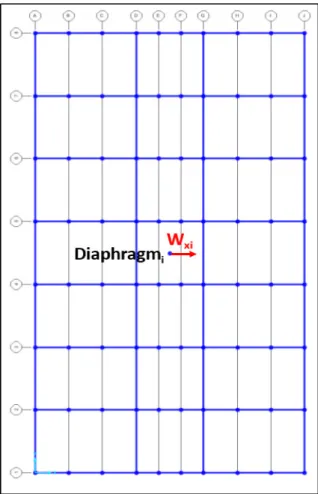
Figure 2.4 Assigning the floor seismic mass as a weight in the floor diaphragm of the SAP2000® model ...38
Figure 2.5 Unfactored gravity loads considered to design a typical interior ductile frame in Vancouver and moderately ductile frame in Montreal. Values include only the self-weight of beams (Unit is kN) ...39
Figure 2.6 Unfactored gravity loads considered in design of typical interior conventional constructed frame in Vancouver and Montreal. Values
include only the self-weight of beams (Unit is kN) ...39
Figure 2.7 UHS with a probabilities of exceedance 2% per 50 years (a) Vancouver, and (b) Montreal ...41
Figure 2.8 Arrangement of longitudinal reinforcement in beams in ductile frames ...45
Figure 2.9 Arrangement of longitudinal reinforcement in beams in moderately ductile frames ...46
Figure 2.10 Dimensions of beams and columns for buildings in Vancouver ...47
Figure 2.11 Dimensions of beams and columns for buildings in Montreal ...48
Figure 2.12 Reinforcing details of the ductile frame members in Vancouver ...48
Figure 2.13 Reinforcing details of the conventionally constructed frames in Vancouver ...49
Figure 2.14 Reinforcing details of the moderately ductile frame members in Montreal ...49
Figure 2.15 Reinforcing details of the conventionally constructed frames in Montreal ...50
Figure 2.16 Inter-storey drift ratio for frame models in (a) Vancouver; (b) Montreal ..50
Figure 3.1 Target spectrum with probabilities of exceedance of 2% and 10% per 50 years (a) Montreal, and (b) Vancouver ...54
Figure 3.2 Acceleration spectra of the selected and scaled input ground motion for the moderately ductile frame in Montreal using the target spectrum at a probability of exceedance 2% per 50 years in (a) TR1, and (b) TR2 ...57
Figure 3.3 (a) Mean acceleration spectra for scenarios 1 and 2 compared with the target spectrum (b) Difference between the mean acceleration spectra of the scaled records and the target spectrum at a probability of exceedance 2% per 50 years within TR1 and TR2 ...57
Figure 3.4 Acceleration spectra of the selected and scaled input ground motion for the moderately ductile frame in Montreal using the target spectrum at a probability of exceedance 10% per 50 years in (a) TR1, and (b) TR2 ...58
Figure 3.5 (a) Mean acceleration spectra for scenarios 1 and 2 compared with the target spectrum (b) Difference between the mean acceleration spectra of the scaled records and the target spectrum at a probability of
exceedance 10% per 50 years within TR1 and TR2 ...58 Figure 3.6 Acceleration spectra of the selected and scaled input ground motion
for the conventional construction frame in Montreal using the target spectrum at a probability of exceedance 10% per 50 years in (a) TR1, and (b) TR2...60 Figure 3.7 (a) Mean acceleration spectra for scenario 1 and 2 compared with the
target spectrum (b) Difference between the mean acceleration spectra of the scaled records and the target spectrum at a probability of
exceedance 2% per 50 years within TR1 and TR2 ...60 Figure 3.8 Acceleration spectra of the selected and scaled input ground motion
for the conventional frame in Montreal using the target spectrum at a probability of exceedance 10% per 50 years in (a) TR1, and (b) TR2 ...61 Figure 3.9 (a) Mean acceleration spectra for scenarios 1 and 2 compared with the
target spectrum (b) Difference between the mean acceleration spectra of the scaled records and the target spectrum at a probability of
exceedance 10% per 50 years within TR1 and TR2 ...61 Figure 3.10 Acceleration spectra of the selected and scaled input ground motion
for the ductile frame in Vancouver using the target spectrum at a
probability of exceedance 2% per 50 years in (a) TR1, (b) TR2, and (c) TR3 ...63 Figure 3.11 (a) Mean acceleration spectra for scenario 1, 2 and 3 compared with
the target spectrum (b) Difference between the mean acceleration spectra of the scaled records and the target spectrum at a probability of exceedance 2% per 50 years within TR1, TR2, and TR3 ...64 Figure 3.12 Acceleration spectra of the selected and scaled input ground motion
for the ductile frame in Vancouver using the target spectrum at a
probability of exceedance 10% per 50 years in (a) TR1, (b) TR2, and (c) TR3 ...64 Figure 3.13 (a) Mean acceleration spectra for scenario 1, 2 and 3 compared with
the target spectrum (b) Difference between the mean acceleration spectra of the scaled records and the target spectrum at a probability of exceedance 10% per 50 years within TR1, TR2, and TR3 ...65 Figure 3.14 Acceleration spectra of the selected and scaled input ground motion for
spectrum at a probability of exceedance 2% per 50 years in (a) TR1, (b) TR2, and (c) TR3 ...67 Figure 3.15 (a) Mean acceleration spectra for scenario 1, 2 and 3 compared with
the target spectrum (b) Difference between the mean acceleration spectra of the scaled records and the target spectrum at a probability of exceedance 2% per 50 years within TR1 TR2,and TR3 ...67 Figure 3.16 Acceleration spectra of the selected and scaled input ground motion
for the conventional frame in Vancouver using the target spectrum at a probability of exceedance 10% per 50 years in (a) TR1, (b) TR2, and (c) TR3 ...68 Figure 3.17 (a) Mean acceleration spectra for scenario 1, 2 and 3 compared with
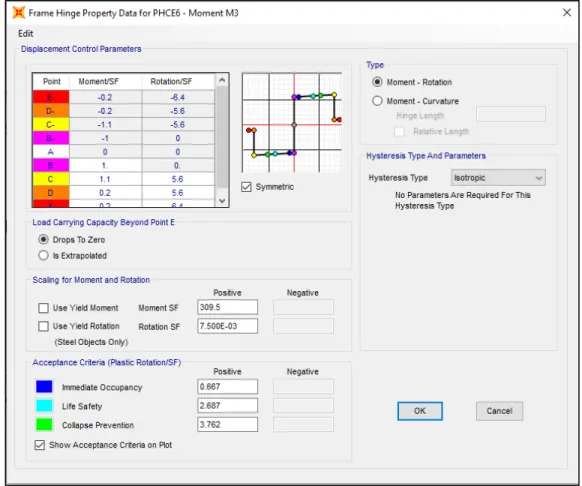
the target spectrum (b) Difference between the mean acceleration spectra of the scaled records and the target spectrum at a probability of exceedance 10% per 50 years within TR1, TR2, and TR3 ...68 Figure 4.1 Floors seismic weight applied to floor nodes in a typical model ...71 Figure 4.2 Typical frame model with assigned plastic hinges ...72 Figure 4.3 Definition of plastic hinge properties of a symmetric section in SAP2000
...73 Figure 4.4 Definition of plastic hinge of a non-symmetric section in SAP 2000 ...74 Figure 4.5 Generalized Force–Deformation Relation for Concrete Elements or
Components ...74 Figure 4.6 Isotropic hysteresis model ...75 Figure 4.7 Hinges formation at the end of pushover analysis of ductile frame in
Vancouver ...78 Figure 4.8 Obtained pushover capacity curve of ductile frame in Vancouver ...78 Figure 4.9 The roof displacement and base shear time histories obtained from the
linear dynamic analysis of 2D ductile frame in Vancouver subjected to W6C1_02 record, considering SRFIO=0.324,ζeqIO =22.01% ...80 Figure 4.10 Hinges formation at the end of pushover analysis of conventional
Figure 4.11 Computed pushover capacity curve of conventional frame in Vancouver ...85 Figure 4.12 Hinges formation at the end of pushover analysis of moderately ductile
frame in Montreal ...89 Figure 4.13 Computed pushover capacity curve of moderately ductile frame in
Montreal ...90 Figure 4.14 Hinges formation at the end of pushover analysis of conventional
frame in Montreal ...93 Figure 4.15 Computed pushover capacity curve of conventional frame in Montreal ...94 Figure 5.1 Computed mean Ax factor along the height of the studied buildings
compared to NBC 2015 provision: (a) elastic analyses (b) inelastic analyses using ground motion with 10% per 50 years probability of exceedance, and (c) inelastic analyses using ground motion with 2% per 50 years probability of exceedance ...99 Figure 5.2 Effect of building ductility on the roof level mean FRS with
component damping ratio 5% ...100 Figure 5.3 Effect of building ductility on the 2nd floor mean FRS with
component damping ratio 5% ...101 Figure 5.4 Effect of building ductility on the amplitudes of mean FRS in the
2nd and 6th floor for component damping ratio 5% and ground
motion with 2% per 50 years probability of exceedance ...102 Figure 5.5 Effect of ground motion level on Rcb factor in the 6th floor of the
studied frames using component damping ratio 5% ...103 Figure 5.6 Effect of ground motion level on Rcb factor in the 2nd floor of the
studied frames using component damping ratio 5% ...104 Figure 5.7 Effect of building ductility on the shape of mean FRS in the 2nd and
6th floors for component damping ratio 5% ...105 Figure 5.8 Effect of building ductility on Ar in the 6th floor for component
damping ratio 5% ...106 Figure 5.9 Effect of building ductility on Ar in the 2nd floor for component
Figure 5.10 Computed mean Ar factor along the height of the studied buildings compared to NBC 2015 provision: (a) elastic analyses (b) inelastic analyses using ground motion with 10% per 50 years probability of exceedance, and (c) inelastic analyses using ground motion with 2% per 50 years probability of exceedance ...108 Figure 5.11 Mean inelastic FRS at each floor for ductile and conventional studied
buildings in Vancouver ...109 Figure 5.12 Mean inelastic FRS at each floor for moderately ductile and
conventional studied buildings in Montreal ...109 Figure 5.13 Mean PFA/PGA ratio along the height of the case of study buildings
obtained from the Kothari’s simplified method at IO and LS performance levels and the nonlinear dynamic analysis: (a) ductile frame in Vancouver, (b) conventional frame in Vancouver, (c) moderately ductile frame in Montreal, and (d) conventional frame in Montreal ...111 Figure 5.14 Computed mean FRS in the 6th floor obtained from the simplified
method and from nonlinear dynamic analysis ...113 Figure 5.15 Mean FRS in the 2nd floor obtained from the simplified method in
the studied frames compared to those obtained from nonlinear
dynamic analysis ...114 Figure 5.16 Comparison of computed mean elastic and inelastic Ax profiles with
the NIST.GCR.18-917-43 (2018) provisions...115 Figure 5.17 Comparison of computed Ar values in the 6th floor compared to the
value proposed in NIST.GCR.18-917-43 (2018) ...117 Figure 5.18 Comparison of computed Ar values in the 2nd floor compared to the
value proposed in NIST.GCR.18-917-43 (2018) ...118 Figure 5.19 Comparison of computed mean (Ax.Ar) in the 6th level of the studied
buildings compared to NBC 2015 and NIST.GCR.18-917-43 (2018) provisions ...119 Figure 5.20 Comparison of computed max Ax.Ar factor of the studied buildings
along the building height to NBC 2015 and NIST.GCR.18-917-43 (2018) provisions ...120
LIST OF ABREVIATIONS
ASCE American Society of Civil Engineers
CC Conventional construction
CSA Canadian Standards Association D Ductile
EC8 Eurocode 8
E-W East – West direction
FEMA Federal Emergency Management Agency FRS Floor response spectrum
GRS Ground response spectrum
IO Immediate Occupancy performance level LDP Linear dynamic procedure
LS Life safety performance level
MD Moderately ductile
MDOF Multi degree of freedom
NBC National building code of Canada NDP Nonlinear dynamic procedure
NEHRP National Earthquake Hazards Reduction Program N-S North – South direction
NSCs Nonstructural components NSP Nonlinear static procedure
OFCs Operational and functional components PCA Peak component acceleration
PFA Peak floor acceleration PGA Peak ground acceleration
RC Reinforced concrete
LIST OF SYMBOLS Greek alphabet
α Post-yield slope of idealized bilinear relationship as per FEMA 356
a
γ Component importance factor as per EC 8
avg
δ Average of displacements at the extreme points of the diaphragm at level x
max
δ Maximum displacement at any point of the diaphragm at level x
LS
Δ Displacement at life safety performance level
y Δ Yield displacement 0 ζ Structural damping eq ζ Equivalent damping hys ζ Hysteretic damping
λ Factor to account for low-density concrete
c
φ Resistance factor for concrete
y
φ Yield rotation
i
ω Angular frequency at mode i
Lowercase Latin alphabet
a Parameter used to measure deformation capacity in component load–deformation curve given by ASCE 41-17
a0 Mass proportional coefficient a1 Stiffness proportional coefficient
ai The maximum acceleration at level i obtained from the modal analysis ag Design ground acceleration on type A ground as per Eurocode 8 ap The dynamic amplification factor as per ASCE 7-16
b Parameter used to measure deformation capacity in component load–deformation curve given by ASCE 41-17
c Parameter used to measure residual strength in component load–deformation curve given by ASCE 41-17
fc' Concrete compressive strength at 28 days
fy Yield strength of longitudinal reinforcing steel bars fyt Yield strength of transverse reinforcing steel bars hn The total height of the supporting structure
hx The height of NSC in the building starting from the ground level as per NBC 2015
ke Initial effective slope of idealized bilinear relationship as per FEMA 356 keq Equivalent stiffness of a structure
ki Initial stiffness of a structure before cracking qa Component response modification factor
z The height of NSC in the building starting from the ground level as per ASCE 7-16
Uppercase Latin alphabet
Aj Minimum cross-sectional area within a joint in a plane parallel to the axis of the reinforcement generating the shear in the joint
Ar The dynamic amplification factor as per NBC 2015
Ax Height factor in NBC and accidental torsion amplification factor in ASCE 7-16 Cp The component factor
D Dead load
E Earthquake load
Ec Young modulus of concrete Es Young modulus of steel
Fa The acceleration-based site coefficient
Fp Component seismic design force applied horizontally at the center of gravity of the component
Ft Concentrated force applied at the top of the building Fx Portion of design base shear that is located at level x
hi The height above the base to level i hx The height above the base to level x
IE The importance factor of the building as per NBC 2015 Ip Component importance factor as per ASCE 7-16 L Live Load
M Moment magnitude of an earthquake event
Mn Nominal flexural resistance Mp Probable flexural resistance Mr Factored flexural resistance
Mv Factor accounts for higher mode effect on the base shear force My Yield moment
R Fault distance
Rcb The ratio of elastic FRS to the inelastic FRS Rd Ductility-related force modification factor Ro Overstrength-related force modification factor Rp Component response modification factor S Snow load
Sa(0.2) The spectral acceleration value for a period of 0.2 s S(T) The spectral acceleration value for a period of T
SDS Design spectral acceleration at short period Sp Horizontal force factor
ST(T) Spectral acceleration of target spectrum
Ta Building period defined by code expression (Equation 1-10) Tp Nonstructural component period
T1Bldg The fundamental period of the building TiBldg The building period of mode i
Tmax The upper limit of period range TR Tmin The lower limit of period range TR
T90% The period of the highest vibration mode required to cumulate a minimum participating mass of 90% of the structure mass
V Design base shear
Vmax Upper limit of design base shear Vmin Lower limit of design base shear Vy Base shear force at yielding point W Seismic weight of building
Wi Portion of W that is located at level i Wp Nonstructural component weight Wx Portion of W that is located at level x
INTRODUCTION Background and problem definition
Several regions in Canada are seismically active. The most active region is western Canada such as the coastal area of British Columbia including Victoria and Vancouver, and to a lesser extent, the eastern Canada such as the region from the St. Lawrence River Valley to the Ottawa Valley including Quebec City, Montreal and Ottawa.
The largest earthquake in eastern North America in the last 50 years struck Quebec on November 25, 1988 with a moment magnitude of 5.9. This earthquake, referred to as the Saguenay earthquake, did point out the tremendous impact of the failure of the NSCs of buildings and economic losses upon life safety. In this event, a great majority of the injuries, property damage and economic loss was caused by the failure of NSCs in buildings while very little structural damage was observed (Foo & Cheung, 2004).
In 1995, National Building Code of Canada (NBC) expressed the force modification factor, R in the minimum lateral seismic force at the base of the structure to design and detail the building components for different levels of ductility. This factor reflected the capability of a structure to dissipate energy through inelastic behaviour. The values of R ranged from 1.0 for very brittle systems to 4.0 for the most ductile systems. Each value of R factor must be used only in conjunction with the corresponding design and detailing requirements of a structural system, and design level of ground motion. In the 2005 to 2015 editions of the NBC, two force modification factors, Rd and Ro are proposed in the base shear equation for seismic design (Mitchell et al., 2003), where Rd is the ductility-related factor and Ro is the overstrength-related factor. Consequently, the reinforced concrete moment-resisting frame buildings can be designed according to NBC 2015 as ductile (D), moderately ductile (MD) or conventional construction (CC).
On the other hand, the proposed equation in all editions of NBC to determine the seismic design forces on NSCs considers their supporting structure as elastic and ignores the impact of force modification factors of the building. Thus, evaluating the NSCs acceleration demands in terms
of height factor (Ax) and the component amplification factor (Ar) in inelastic buildings is a very essential research need.
Recent studies have shown that the building ductility affects the NSC response expressed in terms of the height factor, Ax, and the shape and peak values of floor response spectra (FRS) (Chaudhuri & Villaverde, 2008; Medina et al., 2006; Miranda & Taghavi, 2009; Oropeza et al., 2010; Petrone et al., 2015; Shooshtari, Saatcioglu, Naumoski, & Foo, 2010; Sullivan, Calvi, & Nascimbene, 2013; Surana et al., 2016, 2017; Vukobratović & Fajfar, 2017; Wieser et al., 2011). In fact, if an earthquake event induces inelastic response in the supporting structure, the component response reduces. Several methods were proposed to consider the benefit of building nonlinearity in reducing NSC demands in terms of Ax and FRS (Fathali & Lizundia, 2011; Medina et al., 2006; Petrone et al., 2015; Shooshtari et al., 2010; Surana et al., 2016; Wieser et al., 2013). These methods proposed the distribution of Ax factor along the building height as a function of the relative height, the ground motion intensity, and the period of the supporting structure. As for FRS, proposed methods were in general amplification functions to generate the FRS from the ground response spectrum (GRS) or the uniform hazard spectra (UHS). However, these methods either consider the shaking intensity of the study location as a surrogate of building ductility; thus ignoring the corresponding building design and detailing requirements for each ductility level or are limited to one level of building ductility. On the other hand, simplified methods were recently suggested to carry out nonlinear static analysis (pushover) together with linear time history analysis to generate inelastic FRS (Jha et al., 2017; Kothari et al., 2017). The method proposed by Kothari et al (2017) was derived for a conventional RC frame with three stories, and was not evaluated for other levels of ductility nor different number of stories. In addition to the aforementioned methods, a new equation was proposed in the document NIST GCR 18-917-43 (2018) to determine the seismic design forces for NSCs attached to inelastic buildings. This equation considers that the building ductility only affects the Ax factor.
The current study aims to investigate the influence of different levels of building ductility on seismic demands expressed in terms of Ax, Ar, and FRS of light acceleration-sensitive NSCs. For this purpose, a 6-story regular reinforced concrete frame office building assumed to be
located in Montreal and Vancouver was used in this project. The building was designed according to requirements stated by CSA A23.3 (2014a)14 as ductile and conventional construction in Vancouver, moderately ductile and conventional construction in Montreal. Ground motion records with probability of exceedance of 2 and 10% per 50 years were selected and scaled to be compatible with the uniform hazard spectra (UHS) of Montreal and Vancouver. Linear and nonlinear dynamic analyses were performed to compute the elastic and inelastic NSCs seismic demands in the four mentioned case studies using SAP2000® software (CSI, 2019). In addition, this project is interested in evaluating the most recent simplified method available in the literature (Kothari et al., 2017) as well as the new equation proposed in NIST GCR 18-917-43 (2018) to evaluate the aforementioned seismic demands of NSCs.
Objectives
The main objective of this study is to evaluate the seismic demands of acceleration sensitive NSCs attached to regular reinforced concrete moment resisting frames buildings that can develop inelastic deformations when subjected to strong and moderate ground motions in Canada.
The specific objectives of this project are as follows:
1) Evaluate the influence of building ductility and severity of ground motion on the NSCs acceleration demands in terms of Ax, Ar and FRS.
2) Investigate the influence of building location (east and west of Canada) on the seismic acceleration demands of NSCs.
3) Evaluate the following approaches to compute the NSCs acceleration demands (PFA, the PCA and FRS) in inelastic buildings:
- The simplified method of Kothari et al. (2017), - The simplified equation of NBC (2015)
Methodology
The methodology used to achieve the general and the specific objectives includes the following steps:
1) Perform a literature review on the seismic response of NSC with a focus on the different methods proposed to consider the influence of building ductility on the acceleration seismic demands of light NSCs.
2) Select the 6-story case study RC frame building and carry out the seismic design process. Excel sheets have been created in order to design it according to the standard CSA A23.3-14 (20A23.3-14a). Four cases studies were considered as follows:
- Ductile and conventional construction in Vancouver,
- Moderately ductile and conventional construction in Montreal.
3) Create 2-D linear and nonlinear models for the aforementioned cases studies using SAP2000® software. Properties of concentrated plastic hinges were calculated according to ASCE 41-17 (2017).
4) Select and scale the input ground motions with probability of exceedance 2 and 10% per 50 years. Excel sheets were created to select and scale ground motions as per to method A proposed in NBC 2015 – Appendix J. The considered ground motions are extracted from the synthetic time histories database provided by Atkinson (2009) for the east and west of Canada.
5) Perform linear and nonlinear dynamic analysis procedures to the aforementioned studied cases in order to determine acceleration demands on NSCs attached to them.
6) Apply the steps of the simplified method in Kothari et al. (2017) to the aforementioned case study buildings.
7) Discuss the results of the aforementioned analyses and compare them to those stated by NBC 2015 and NIST GCR 18-917-43 in order to achieve the current project objectives.
Limit of study
This study is limited to the following points:
1) The structural system consists of regular symmetric reinforced concrete moment-resisting frames. Irregular structural systems and building with shear walls are beyond the scope of this study.
2) The height of the selected building is limited to 6 stories.
3) The case study buildings were considered as two-dimensional frames subjected to uni-directional seismic excitation.
4) Only site class C (based on NBC 2015) was considered. Other soil types are not included. 5) Only lightweight acceleration-sensitive NSCs were considered in this study, and the
dynamic interaction with the building was neglected.
6) NSCs considered in this study are linear elastic, and NSCs ductility was not taken into account.
Thesis organization
The thesis consists of five chapters in addition to this introduction and the conclusions. The first chapter overviews the approaches of determining the seismic acceleration demands on acceleration sensitive NSCs. In addition, the first chapter critically reviews the proposed methods in previous studies to consider the building ductility in determining the NSCs seismic acceleration demands. The second chapter describes the selected building (geometry, loads, and material properties), and the seismic design process of four case study buildings. The selection and scaling of the input ground motions are given in the third chapter. In chapter four, the linear and nonlinear analyses of case study buildings are presented. The fifth chapter presents the analyses, and discusses the obtained results in each part of the study. Finally, conclusions from the current work and recommendations for future work are presented.
CHAPITRE 1 LITERATURE REVIEW
This chapter gives a brief information about NSCs classification and their seismic performance in recent earthquakes followed by an overview of the code approaches for determining the seismic demands on NSCs. This chapter presents also a detailed literature review about the influence of building ductility on NSCs seismic response as well as the proposed methods in the previous studies to include the effect of building ductility in the NSCs seismic demands computation.
1.1 Introduction
A building is composed of various components that can be divided into two groups, structural components and nonstructural components (NSCs). The structural components (or primary system) of a building are designed to resist and transfer vertical and horizontal loads such as gravity, earthquake, wind loads. These components include columns, beams, braces, slabs, load-bearing walls and foundations. NSCs are elements within or attached to buildings to provide them with essential services and functions and do not contribute to the building’s resistance such as suspended ceiling, heating and ventilation systems and building contents as shown in Figure 1.1. The NSCs can be also named operational and functional components (OFCs) according to CSA S832 (CSA, 2014b), or secondary systems (FEMA 74, 2005). NSCs can be divided into three categories of sub-components based on their function (CSA, 2014b) as follows:
1) Architectural that are either external such as cladding, glazing, roofing, balconies, etc. or internal such as partitions, ceilings, atriums, etc.
2) Building services that include mechanical, plumbing, electrical and telecommunications. 3) Building contents that are either common such as movable partitions, office equipment,
storage lockers, etc. or specialized such as antiques, works of art, hazardous materials, medical supplies, etc.
Figure 1.1 Structural and nonstructural components of a typical building Taken from CSA S832 (CSA, 2014b)
In addition, NSCs can be classified according to the main reason causing their seismic damage as follows (FEMA74, 2005):
1) Acceleration-sensitive components: the main cause of seismic damage in this category (such as parapets and suspended ceilings) is the building seismic inertial forces.
2) Displacement-sensitive components: the main cause of seismic damage in this category (such as windows and elevator cabins) is the building displacement or inter-story drift. 3) Both acceleration- and displacement-sensitive components: the seismic damage in this
category (such as fire sprinklers and heavy infill walls) is due to the inertia forces and building displacement.
NSCs can also be classified based on their fundamental period (Tp) into rigid and flexible. According to NEHRP (2009), rigid components are short period elements (Tp ≤0.06s) while
flexible components are longer period elements (Tp >0.06s).
Finally, NSCs can be categorized into light and heavy based on the ratio of their weight to that of the supporting structure. According to CSA S832 (2014b), NSCs are considered light when their weight doesn’t exceed 20% of the total weight of the floor on which they are located or 10% of the total weight of the supporting structure.
1.2 The importance of NSCs seismic design
Proper seismic design of NSCs is important for several reasons. First, the failure of NSCs can cause injuries or deaths. For instance, the failure of cladding panels in precast buildings was the main cause of fatalities in the 2012 Emilia earthquake in north Italy (Magliulo et al., 2014). Second, the cost of NSCs represents the largest portion of construction cost in facilities such as hospitals, offices and hotels as shown in Figure 1.2 (Miranda & Taghavi, 2009).
Figure 1.2 Relative investments in typical buildings Taken from Miranda and Taghavi (2009)
The economic costs resulting from damage to NSCs include not only the physical repair work, but also downtime cost when the damage affects the building occupancy. For example, the damage of NSCs in Santiago airport during 2010 Maule, Chile Earthquake (Mw 8.8) led airline
companies to suffer US$10 million loss as a result of business interruption (Filiatrault & Sullivan, 2014). Finally, NSCs are very sensitive to ground motion shaking so low or moderate earthquakes, which cause very little structural damage, can lead to severe economic losses due to NSCs damage or failure. For example, the 1988 Saguenay earthquake (Mw 5.9) that struck Quebec, Canada caused very little structural damage while a great majority of the properties damage and economic loss was caused by the failure of NSCs in buildings (Foo & Cheung, 2004; Mitchell et al., 1990). Examples of NSC damage in different earthquakes are illustrated in Figures 1.3 to 1.5.
Figure 1.3 Failure of suspended lighting fixtures in an office building in 2001 Nisqually earthquake (Mw=6.8)
Taken from Filiatrault et al. (2001)
Figure 1.4 Severe damage to the masonry cladding of the former Montreal East City Hall during the 1988 Saguenay earthquake (Mw=5.9)
Figure 1.5 Nonstructural damage in 2011 Christchurch earthquake (Mw= 6.2) Taken from Baird and Yeow (2016)
1.3 Approaches to estimate the seismic demands of NSCs
The seismic force demands of NSCs can be determined by four approaches summarized as follows:
1) Simplified formulas suggested by current code provisions such as NBC (2015), CSA S832 (2014b), ASCE 7-16 (2016), ASCE 41-17 (2017), Eurocode 8 (2004), and NIST GCR 18-917-43 (2018). These simplified formulas are based on equivalent static methods that are usually applied in the current design practice for ordinary and industrial structures and serve as convenient means when no or just little information about the NSCs and the supporting structure are available at the design phase.
2) Simplified formulas enhanced by refined determination of peak floor accelerations (PFA) by means of modal superposition methods available in ASCE 7-16 (2016) and ASCE 41-17 (2041-17), and require knowing the building dynamic properties.
3) Decoupled time history analyses also known as floor response spectrum method. They are usually used when dealing with critical facilities such as nuclear power plants (ASCE 4-98, 2000; CSA N289.3-10, 2010). In these methods, only the supporting structure is modelled, so they are recommended for light components where the dynamic interaction between supporting structure and NSCs is neglected.
4) Coupled time history analyses where the supporting structure and NSCs are modelled as an integral part. Although this approach gives accurate responses of NSCs, it is not widely used because it involves several difficulties such as large differences between supporting structure characteristics (mass and stiffness) and that of NSCs, and large number of degrees-of-freedom in a combined system (Chen & Soong, 1988).
1.3.1 Code provisions for horizontal seismic force demands on NSCs
In Canada, the seismic design of NSCs in new buildings is addressed in the CSA-S832 standard (2014b) and NBC (2015). The previous versions of NBC also contained some provisions regarding the seismic design of NSCs in terms of the seismic force and inter-story drift demand requirements (Assi & McClure, 2015). In the United States, the seismic design of NSCs is addressed in the National Earthquake Hazard Reduction Program (NEHRP) documents, ASCE 7-16 (2016) and ASCE 41-17 (2017). In Europe, it is addressed in the Eurocode 8 (EN 1998-1, 2004).
Table 1.1 presents the proposed equations in NBC 2015, ASCE 7-16, and Eurocode 8 to determine the horizontal seismic design force acting on the mass center of a NSC. These are inertia forces equal to the product of NSC weight, Wp and the peak component acceleration, PCA. According to these formulations, the product of design ground acceleration and the height factor, Ax (see Table 1.2) gives the peak floor acceleration (PFA) where the NSC is attached. Then the PFA is scaled by two factors to determine the PCA: the component dynamic amplification factor, Ar and the component response modification factor, Rp (see Table 1.2). The factor Ar is explained in details in section 1.3.1.2, while the component response modification factor represents the energy absorption capacity of the element and its attachment. The term Fa is the acceleration-based site coefficient while Sa(0.2) is the spectral acceleration value for a period of 0.2 s. The terms SDS and ag are the design ground acceleration in ASCE and Eurocode 8, respectively.
The term IE is the importance factor of the building and the term Cp is the seismic coefficient for components of mechanical and electrical equipment. The terms Ip and γa are the component importance factor in ASCE and Eurocode 8, respectively.
Table 1.1 Codes formulas of horizontal seismic design forces on NSCs
Code Seismic horizontal design force
NBC 2015 0.3FaSa(0.2)IE(CpAr /Rp)(1+2hx/hn)Wp (1.1) ASCE 7-16 0.4SDS(apIp /Rp)(1+2hx/hn)Wp (1.2) Eurocode 8 agS
[
3(1 z/hn)/(
1 (1 Tp/T))
0.5]
( a/qa)Wp 2 γ − − + + (1.3)Table 1.2 Design ground accelerations and amplification factors in the codes formulas
Code
Design ground acceleration
Height factor Component dynamic amplification factor NSC response factor Importance factor NBC 0.3FaSa(0.2) (1+2hx/hn) Ar Rp IE ASCE 0.4SDS (1+2hx/hn) ap Rp Ip EC 8 agS
[
1.5(1+hx/hn)−0.5]
[
1[
.5(
1 /)
0.5]
]
5 . 0 ) / 1 ( 3 − + − + n x n x h h h h a q γaEquations 1.1 to 1.3 are mainly empirical and do not rely on analytical analysis or experimental works (Bachman et al., 1994; Filiatrault & Sullivan, 2014).
In case more information about the supporting structure is available in terms of modal periods and shapes, ASCE 7-16 and NEHRP (2009) permit to use Equation 1.4 to determine the seismic force demand on NSCs at any level based on the dynamic properties of the structure as follow: x p p p p i p R I A W a a F = / (1.4)
Where ai is the acceleration at level i obtained from the modal analysis procedure explained in ASCE 7-16 and Axis the torsional amplification factor used to amplify the accidental torsional moment at each level and is given by Equation 1.5 as follow:
2 max 1.0 3.0 1.2 x avg A δ δ ≤ = ≤ (1.5)
Where
δ
maxand δavg are the maximum and average displacements at level x, respectively. This method gives more realistic results than the simplified codes formulas because ai is determined by using modal analysis method. More details about using the refined approach to determine the amplification of PFA along the height are available in Pinkawa et al. (2014) and Wieser et al. (2011).Common limitations were pointed out concerning the code approaches for horizontal seismic demands on NSCs and criticized in several studies as follows:
1.3.1.1 Height factor, Ax
The factor Ax represents the amplification of PGA along the building height, it is equal to the ratio (PFA/PGA). This distribution is linear and ranges from 1.0 at ground level to 3.0 at the roof level as per NBC and ASCE, while it ranges from 1.0 at ground level to 2.5 at the roof level as per EC8 as shown in Figure 1.6.
The linear increase of Ax factor (Figure 1.6) is a function of the relative height hx/hn, where hx is the height of the NSC relative to the ground level, and hn is the total height of the supporting structure. However, it is shown in Miranda and Taghavi (2009) that a longer fundamental period of elastic building resulted in a lower ratio of PFA/PGA for shear wall buildings, moment-resisting frame buildings, and buildings with lateral system stiffness somewhere in between. In Fathali and Lizundia (2011), it was shown that the distribution of Ax factor is affected by the level of seismicity along with fundamental period of the supporting structure and relative height. It has been concluded in that study that the profile of Ax proposed in ASCE 7-16 is a good fit just for short-period buildings (fundamental period less than 0.5 s) in low-seismicity areas (PGA < 0.067 g), but conservative for the other ranges of periods. It was also
observed that the PFAs are relatively constant over most of the building height in the long-period buildings (fundamental long-period larger than 1.5 s).
Figure 1.6 The distribution of PGA amplification along the relative height according to the NBC 2015, ASCE 7-16 and Eurocode 8
In addition to the effect of building fundamental period on Ax factor, a sudden increase in the PFA in the top stories was reported in recent studies (Petrone et al., 2015; Rodriguez, Restrepo, & Carr, 2002; Taghavi & Miranda, 2005) due to the large contribution of the higher modes to the PFAs. This phenomenon called whiplash happens in the most top floors of mid and high-rise buildings.
Beside the aforementioned parameters, building ductility has also an effect on the Ax factor along the building height. Typically, the ratio PFA/PGA tends to be lower when the building is inelastic. This is due to the fact that the yielding in the structure leads to elongation of the building period during the response (Surana et al., 2016; Wieser et al., 2013; Wieser et al., 2011). According to Petrone et al. (2015) whose studies are oriented to the Eurocode 8. A linear trend that varies from 1.0 at the base to 3.0 at the top is on the safe side for the linear response of RC frames supporting structures, while this range is conservative based on the nonlinear analysis results and a linear trend that goes from 1.0 at the base to 2.0 at the top would better fit the outcomes of the nonlinear analyses.
1.3.1.2 Dynamic amplification factor, Ar
The Codes approaches consider the dynamic interaction between the NSC and the building by means of a component amplification factor, Ar, which is defined as the floor response spectrum normalized by the PFA of the elastic frame (Medina et al., 2006).
The factor Ar is given in different codes and standards (ASCE 7-16, 2016; NBC, 2015) as a tabulated value. A value of 1.0 is given for a rigid NSC while a value of 2.5 is given for a flexible NSC. This is because the flexible NSC vibrates independently around its point of attachment to the building leading to dynamic amplification of acceleration at the attachment point. The values of Ar are assumed constant for all the building floors. Unlike ASCE 7-16 (2016) and NBC (2015), NEHRP (2009) and EC8 (2004) give the Ar factor as a function of the ratio of NSCs periods to fundamental period of building (Tp/T1Bldg) as shown in Figure 1.7.
Figure 1.7 The component amplification factor Ar according to the current codes
Several studies showed that the aforementioned codes recommendations underestimate the Ar factors. In Medina et al. (2006), it was observed that the maximum value 2.5 of Ar underestimates the component amplification in elastic buildings, where the value of Ar reaches a value up to 5.5 at the roof of a low-rise elastic building (3 stories) and reduces to 2.5 at the roof of a mid-rise elastic building (9 stories). As for the case of inelastic response of supporting structures, the Ar value of 2.5 is on the safe side if the damping ratio of NSCs exceeds 5%. Otherwise, it should be increased based on the selected damping ratio.
In Fathali and Lizundia (2011), it was shown based on recorded floor accelerations in 169 buildings in Los Angeles that the value of Ar exceeds the code value of 2.5 and reaches a maximum value of 3.3 for a range of Tp between 0.1 s and 0.75 s. On the other hand, the code value outside this range of periods is conservative. These results are in a good agreement with those found by Wieser et al. (2013) in a study on steel resisting moment frames, which showed that the peak value of Ar that corresponds to the first mode is reduced as the level of yielding in the structure increases while no remarkable reduction was observed at the second modal period. In Petrone et al. (2015) study on RC moment resisting frames, the value of Ar given in the codes was also criticized, and a linear distribution for Ar along the height was proposed to range from 3.0 at ground level to 5.2 at roof in elastic supporting structures and from 2.6 to 4.8 in inelastic buildings. Recently, NIST GCR 18-917-43 (2018) gives the value of Ar based on the relative height and ductility of the component. For example, for an elastic component, Ar equals 2.5 at the ground floor and 4.0 in the roof and elevated floors (see section 1.3.2).
1.3.2 Floor acceleration demands according to NIST.GCR.18.917.43
The proposed NSCs design equation by NIST GCR 18-917-43 (2018) is given in Equation 1.6:
p pcomp Bldg p p I R PFA PCA R PGA PFA PGA W F × × = μ (1.6) Where: p
F Horizontal design force for NSCs
p
W Component operating weight
PGA Peak ground acceleration and considered equal to 0.4Sa (0.2), where Sa (0.2) is the spectral acceleration at structure period of 0.2 s.
PFA/PGA Peak ground acceleration to peak floor acceleration ratio given by the following equation:
10 2 1 1+ + = h z h z PGA PFA α α (1.7) Where: 5 . 2 ) / 1 ( 1 = TaBldg ≤ α (1.8)
[
1 (0.4/ )2]
0 2 = − TaBldg > α (1.9) x t aBldg Ch T = (1.10)where Ct and x are defined by standards according to the lateral force resisting system of the building
Bldg
Rμ = (Rd)1/2 where Rµbldg is a reduction factor to account for building global ductility calculated based on the value of Rd (see Table 2.5).
PCA/PFA Factor to account for component amplification, inherent component damping, and component ductility. Values of PCA/PFA shown in Table 1.3 are based on the location of NSCs and the component ductility assuming the inherent component damping is 5%.
pcomp
R Inherent component reserve strength margin factor that accounts for its ductility.
p
I Component importance Factor
We can note that PFA/PGA is affected by the building parameters such as the lateral force resisting system (LFRS), modal periods, ductility, and vertical location of the component term. While PCA/PFA is affected by the component period, its ductility, and its damping, so the PFA/PGA and PCA/PFA terms are separated for simplicity.
Equation 1.6 is a refinement of Equation 1.2, whereas the building period, relative height, type of lateral force resisting system, and building ductility are taken into account to compute (PFA/PGA). As for (PCA/PFA) value in Equation 1.6, it becomes a function to the component ductility and height instead of component period in Equation 1.2.
Table 1.3 PCA/PFA and component ductility values Taken from NIST GCR 18-917-43 (2018)
1.3.3 Floor Response Spectra approach
Floor Response Spectra (FRS) is a decoupled analysis method called also systems-in-cascade method (Villaverde, 1996). This method is used for light weight NSCs, so the dynamic analysis is performed for the supporting structure without considering the effect of the NSCs. FRS represents the peak acceleration response of a nonstructural component and is typically used to estimate the acceleration demands on flexible NSCs while PFA is used to estimate the acceleration demands on rigid NSCs (Flores et al., 2015).
This method is simple in concept, somewhat rational and far from the numerical complexity in the coupled analyses. However, it doesn’t account for multiple points of NSCs attachments, and requires lengthy numerical integrations when using time history analysis. More details about the advantages and limitations of this method are available in Villaverde (1997) and Chen and Soong (1988).
The procedure of floor response spectra is described in a number of official documents related to the seismic analysis of nuclear structures such as the CSA N289.3-10 (2010) and ASCE 4-98 (2000). ASCE 4-4-98 states the nonlinear time history and direct spectra-to-spectra as methods to generate floor response spectra, and gives recommendation about frequency interval, treatment of uncertainties and damping ratio. For example, ASCE 4-98 recommends a frequency increment to compute FRS at each frequency range listed in Table 1.4 to produce an accurate FRS including the significant peaks that are expected at the natural frequencies of the supporting structure. It also recommends to consider the uncertainties in the supporting structure frequencies by broadening the peaks of FRS by a minimum of ±15%. Explanation about nonlinear time history method and direct spectra to spectra method is given in the following sections.
Table 1.4 Suggested frequencies in (Hz) for generating FRS Taken from ASCE 4-98 (2000)
Frequency range 0.5-3.0 3.0-3.6 3.6-5.0 5.0-8.0 8.0-15 15-18 18-22 22-34
Increment 0.10 0.15 0.20 0.25 0.50 1.0 2.0 3.0
1.3.3.1 Time history method
In this method, the supporting structure is subjected to a set of recorded or synthetic time histories compatible with a given seismic design spectrum. Then, the floor acceleration at the locations of the NSCs attachments can be obtained and utilized as the input to a single degree-of-freedom oscillator to generate a floor response spectrum (FRS), which is a plot of the maximum responses of the oscillator versus the frequency of the oscillator (Villaverde, 1997). To obtain a reliable FRS, a large number of sets of earthquake time histories may be required (Villaverde, 1997).
1.3.3.2 Direct spectra to spectra method
To avoid the complexity of the aforementioned time history method, several methods were proposed to generate FRS directly from a specified ground response spectrum, or design spectrum. These methods use as input a specified ground response spectrum and the dynamic properties of the structure (modal frequencies, damping ratios, mode shapes and modal participation factors). Figure 1.8 illustrates the procedure of both time history and direct spectra to spectra methods.
Figure 1.8 Time history and direct spectra to spectra methods to generate FRS Taken from Jiang (2016)
There are different direct approaches to generate the floor response spectra from the design response spectra such as random vibration (Der Kiureghian, 1980), perturbation method (Singh & Suarez, 1986) and Duhamel integral (ASCE 4-98, 2000). Recently, new and simplified methods were proposed (Surana et al., 2016; Vukobratović & Fajfar, 2017) to generate elastic and inelastic floor response spectrum directly from the ground response spectra. In Surana et al. (2016), amplification functions have been proposed to amplify the ground response spectrum in case of elastic and inelastic supporting structure depending on incremental
dynamic analysis performed on 3D RC frame buildings. Whereas, a new method that takes into account the dynamic properties of the structure is proposed in Vukobratović and Fajfar (2017) and can be used for both elastic and inelastic multi-degree-of-freedom structures, based on the response spectrum concept. However, the results for inelastic supporting systems was considered approximate and not accurate enough when compared with results obtained by nonlinear response history analysis.
1.4 Proposed methods to determine seismic demands on NSCs mounted to inelastic
buildings
In the following sections, a critical review of the most recent proposed methods to include the effect of building ductility on the seismic acceleration demands of NSCs in terms of PFA/PGA distribution along the relative height and PCA.
1.4.1 PFAs distribution along the relative height
Fathali and Lizundia (2011) proposed Equation 1.11 to determine PFA/PGA ratio based on recorded data from instrumented buildings. In Equation 1.11, PFA/PGA ratio is a function to the relative height, α and β parameters which are determined based on the PGA and the building fundamental period, TBldg1, as shown in Tables 1.5 and 1.6.
β α( / ) 1
/PGA z h
PFA = + (1.11)
Table 1.5 Values of parameter α Taken from Fathali and Lizundia (2011)
0.4SDS =PGA<0.067g 0.067≤0.4SDS=PGA<0.2 g 0.4SDS =PGA≥0.2 g TBldg1 < 0.5 s 1.26 1.04 0.99 0.5 s < TBldg1 < 1.5 s 1.52 1.02 0.65 TBldg1 > 1.5 s 0.90 0.72 0.00