HAL Id: hal-00299094
https://hal.archives-ouvertes.fr/hal-00299094
Submitted on 15 Apr 2004
HAL is a multi-disciplinary open access
archive for the deposit and dissemination of
sci-entific research documents, whether they are
pub-lished or not. The documents may come from
teaching and research institutions in France or
abroad, or from public or private research centers.
L’archive ouverte pluridisciplinaire HAL, est
destinée au dépôt et à la diffusion de documents
scientifiques de niveau recherche, publiés ou non,
émanant des établissements d’enseignement et de
recherche français ou étrangers, des laboratoires
publics ou privés.
monitoring rock-slope movements: the example of the
top of Randa rockfall scar
M. Jaboyedoff, P. Ornstein, J.-D. Rouiller
To cite this version:
M. Jaboyedoff, P. Ornstein, J.-D. Rouiller. Design of a geodetic database and associated tools for
monitoring rock-slope movements: the example of the top of Randa rockfall scar. Natural Hazards
and Earth System Science, Copernicus Publications on behalf of the European Geosciences Union,
2004, 4 (2), pp.187-196. �hal-00299094�
Natural Hazards and Earth System Sciences (2004) 4: 187–196 SRef-ID: 1684-9981/nhess/2004-4-187
© European Geosciences Union 2004
Natural Hazards
and Earth
System Sciences
Design of a geodetic database and associated tools for monitoring
rock-slope movements: the example of the top of Randa rockfall scar
M. Jaboyedoff1,2, P. Ornstein2, and J.-D. Rouiller21Quanterra, Ch. de la Tour Grise 28, 1007 Lausanne, Switzerland
2Centre de Recherches sur l’Environnement Alpin, 1950 Sion, Switzerland
Received: 25 September 2002 – Revised: 20 January 2004 – Accepted: 22 January 2004 – Published: 15 April 2004 Part of Special Issue “Geo-databases for Natural Hazards and Risk Assessment”
Abstract. The need for monitoring slope movements
in-creases with the increasing need for new areas to inhabit and new land management requirements. Rock-slope monitoring implies the use of a database, but also the use of other tools to facilitate the analysis of movements. The experience and the philosophy of monitoring the top of the Randa rockfall scar which is sliding down into the valley near Randa village in Switzerland are presented. The database includes data cor-rection tools, display facilities and information about bench-marks. Tools for analysing the movement acceleration and spatial changes and forecasting movement are also presented. Using the database and its tools it was possible to discrimi-nate errors from critical slope movement. This demonstrates the efficiency of these tools in monitoring the Randa scar.
1 Introduction
Increasing population density in inhabited areas multiplies the number of sites affected by slope movements (Swiss As-sociation of Road and Transportation Experts, 2000). For instance, according to a preliminary inventory compiled by the Office F´ed´eral de l’Economie des Eaux (OFEE), about 6 to 8% of the Swiss territory is actually affected by land-slides (OFEE, 1997). A part of the management strategy for slope instability risk mitigation includes monitoring over sites likely to induce damage in inhabited zones and/or to fa-cilities (Bromhead et al., 1988; Rochet, 1992; Keaton and DeGraff, 1996). Slope movement monitoring, which is often performed over long periods of time, generates large volumes of data, especially following the use of automatic measure-ment devices (e.g. extensometer, GPS, radar, weather station, etc.). Relevant information ranges from survey data to sensor specifications including monitoring network topology, pic-tures, map documents, etc. The storage and the maintenance
Correspondence to: M. Jaboyedoff
of all these data lead to the need for efficient, structured and flexible data management systems.
Many problems arise in slope movement monitoring. These problems may have various sources and occur at dif-ferent levels of the monitoring process (Rochet, 1992). The use of a well-designed database and the related data analysis tools can solve a great part of the monitoring issues and the infrastructure maintenance problems.
Missing or erroneous data are inherent to all data acquisi-tion processes. Thus a database designed for slope instability monitoring must include functions that help to maintain a co-herent data set by allowing corrections and avoiding errors. Furthermore, tools linked to a database must be efficient to detect the changes in the general trends of the relevant pa-rameter alert threshold values, in order to give an alarm to the concerned specialists.
On one hand, the analysis of slope movements must in-dicate if a catastrophe is imminent or can be forecasted. For example, if an acceleration, which can lead to failure, is detected, an alarm process must be triggered. On the other hand, if the movements suffer simple changes with-out consequences, the monitoring tools may have to be up-dated, based on an updated analysis of the relevant parame-ters, or the monitoring system can become irrelevant. Thus, a database must be designed with respect to a monitoring system adapted to each case and based on relevant alarm pa-rameters or analyses. The data must be acquired in real-time or with a delay depending on the type of data and reaction time of instabilities.
Originally the presented database was developed for the monitoring of the scar of the Randa rockfall. In April and May 1991, about 30 million m3fell down in the valley near the Randa village situated 10 km north of Zermatt in Switzer-land. The proposed approach is based on the past 12 years of experience gained from surveying the movements affecting the top of the Randa rock fall scar. As a result, this paper deals with databases that are needed when events present a time delay between the time at which the threshold warn-ing parameter value is reached and the expected catastrophic
N 200m Scar Deposit Pres ent d ay movin g sec tor Randa Rockfall A A B B C C N 40 km Scar Deposit
Fig. 1. (A) Location of Randa rockfall (DEM RIMINI Federal
of-fice of Topography (DS033032)). (B) Situation of the rockfall and present active area (arrow). (C) Oblique view to the SW of the rockfall which took place on 18 April 1991 (22 million m3) and 9 May 1991 (7 million m3).
event. The present example possesses many similarities with published monitoring systems. Electronic Distance Meter (EDM) is often used as well as triangulation (Archbold et al., 1988; Bromhead et al., 1988; Pingue et al., 1998; Ro-chet, 1992; Keaton and DeGraff, 1996; Young et al., 2000). At present GPS and radar of synthetic aperture radar (InSAR) are more and more used (Dzurisin, 2003). But a few papers focus directly on databases dedicated to slope monitoring.
The database structure and the associated tools imple-mented for the handling and analyses of Randa monitoring data are discussed below. New monitoring tools and data cor-rection procedure are also presented. The monitoring system also provides pictures and graphs.
2 The 1991 Randa rockfall and associated movements
2.1 Geological and geomorphological settings
On 18 April 1991, 22 million m3of rock fell from the steep-est cliff of the Matter valley near the village of Randa (10 km north of Zermatt, Switzerland) (Schindler et al., 1993; Sar-tori et al., 2003). On 9 May 1991 a retrogressive rockslide of about 7 million m3fell down from the upper part of the 18 April scar (Fig. 1). Fortunately no fatalities were reported except for forty head of cattle. The main road, the railway and thirty-one chalets were destroyed.
The Randa steep cliff is composed of a competent or-thogneiss (Bearth, 1964) at its base, in which most of the first event took place. The orthogneiss is overlain by a less competent paragneisses shaping gentler slopes than in the othogneisses. Sartori et al. (2003) identified several pre-existing field conditions that affected the stability of the area: (1) unfavourable structural settings (large scale
discontinu-ities); (2) the steepness of the cliff; (3) the massive lithology (mainly orthogneiss), (4) the location on a topographic ridge outcropping at the confluence of a glacial cirque and the main valley; and (5) the existence of previous instability events.
The top of the scar, located within the paragneisses, is now affected by slow ongoing deformation, with a maximum ve-locity of 1–2 cm per year. The moving rock mass represents approximately 2.5 million m3(Eberhardt et al., 2001). This moving rock mass underlines the retrogressive erosion pro-cess affecting the slope. Based on geodetic data, the calcu-lated displacement vectors are in accordance with a sliding mechanism along preexisting structures which acted during the 9 May 1991 rockslide.
2.2 Slope movement monitoring
After the first event in April 1991, a monitoring network with alarm devices was installed. It consisted of three compo-nents: (1) a geodetic network, (2) an extensometer network, (3) meteorological stations (Jaboyedoff, 1995; Ornstein et al., 2001). After the events of April and May 1991, geode-tic points were installed above and at the top of the rock fall scar. During the last 12 years, between 15 and 25 points have been monitored at least 4 times a year by EDM (Distomat Wild DI1001; Leica, 1990) (Fig. 2). The EDM measure-ments are performed from the valley bottom, at 1400 m a.s.l., up to 2500 m a.s.l., at distance ranging from 1 to 2 km. This network was completed by the installation of 25 extensome-ters, of which twenty are measured manually once a year and five are automatically recorded with time step ranging from minutes to days. Triangulations have been performed during the last 5 years on a limited set of points. This method gives additional information on the direction of the displacement vectors, which are partially estimated through EDM data.
3 Methodology
3.1 Questions to be answered
The goal of a monitoring system is to monitor relevant pa-rameters and to give warnings for catastrophic events. The parameters must be descriptors of the evolution of slope sta-bility and must give the necessary information on precursory movements or others warning parameters such as rainfall (Crosta, 1998), acceleration leading to rupture (Azimi et al., 1988; Fukuzono, 1990) or high constant velocities. Based on velocity analysis of the Ruinon landslide (Italy), Crosta and Agliardi (2003) showed that it is possible to predict a veloc-ity threshold for warning purposes. Such interpretations are only possible if movements have undergone acceleration.
Three dimensional movement data (x, y, z) are, in the-ory, required for a fine understanding of the instability; in this case GPS or a standard geodetic network can be used (Evrard et al., 1990a). But often 1-D data are sufficient to give warnings; in this case, extensometer data or EDM can be used (Guerricchio et al., 1988; Gili et al., 2000).
M. Jaboyedoff et al.: Note on the design of a geodetic database 189
Fig. 2
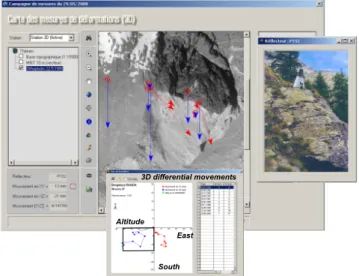
Fig. 2. Window of data displayed by
the RandaDB. On the left, tree structure of the data sets (like in Microsoft Win-dows explorer) with names of bench-marks. On the right, displacement graph of the points measured from the same point by EDM. The RandaDB is developed under Windev (2000). The negative values indicate the distance covered by the benchmark down to the valley.
In the surroundings of the Randa rockfall scar, the slope movement monitoring, mainly by EDM, has demonstrated that the data storage must be flexible because of the changes induced by: 1) the ageing or degradation of material that may be produced by slope movement, 2) human errors, or 3) changes in the positioning of reference points. The cli-matic parameters (humidity, snow, clouds etc.) may also dis-turb optical measurement devices. The Randa rockfall area monitored by EDM have led to problems like: distance er-ror caused by temperature gradient or variation of air optical properties with humidity for long sighting, reflector changes, changes in station movement, or new location points.
The geographical situation of the slope instability has a great influence on the selection of monitoring methods and devices. The case of Randa scar, which is mainly located above 1800 m a.s.l., is a good example because of the thick snow pack. As a consequence most of monitoring work has to be executed from the valley, which had led to choose the EDM measurement method. The choice of suitable monitor-ing parameters depends on the knowledge of the instability mechanisms, which also helps to place monitoring devices in appropriate places. The interpretation of measurements is greatly refined if the mechanisms are well understood. Because monitoring is often initiated during critical condi-tions, the understanding of the instability mechanism is re-fined with time. As a consequence, the monitoring system is updated and instability knowledge increases. New interpreta-tion of mechanisms can lead to a new design of the monitor-ing devices, therefore the monitormonitor-ing methods must be modi-fied to be consistent with the instability mechanism (Rochet, 1992). The 3-D geodetic network implemented within and above the Randa scar has been designed according to the in-terpretation of EDS data.
If the monitoring programme lasts for a long period of time, measurement points are often damaged or abandoned and then replaced with new points. These breaks in mea-surement continuity have to be resolved. To respect the data integrity three tasks must be performed:
1. The data stored in the database have to remain acces-sible with time, in order to be used in new monitoring software or in new monitoring criteria (e.g. change in alarm parameters).
2. For 1-D data, the acquisition of total movement data must start on the same date, in order to compare data and to map movements.
3. Analysis of data must be performed rapidly, to detect any changes in the behaviour of instability.
In the light of the first years of the Randa scar monitoring, an appropriate data management must be based on software comprising a database and associated tools dedicated to data correction and data analysis. Such a program must facilitate the data maintenance and reduce the delay between data ac-quisition and data analysis. Data without any correction must first be documented. The method used to maintain the data sets and history must be recorded within the database. Also, measurement point descriptions and specifications, including pictures, must be available for an effective monitoring. 3.2 Database design
Part of the database design was directly the result of the Randa scar monitoring; the structures and the tools were de-signed to be applied to other types of landslides. The fun-damental associated monitoring tools are time-displacement
Movement maps with several representation
Data, devices and related corrections and descriptions
Interpretation and products
...
...
Fig. 3. Simplified structure of the tables and tools implemented
in the RandaDB for slope movements monitoring. The data and devices and interpretation products contain more informative tables than shown. The procedure consists of first archiving original data, correction parameters and all events affecting the monitoring, and exporting these and producing various monitoring documents.
plots, time-precipitation plots, and maps of the point trajec-tories or displacement values projected on a plane such as the x−y plane (Wieczorek et al., 1990). These allow a quick view of slope evolution. It can also be complemented with other documents such as pictures, reports, extra measure-ments, etc. All benchmarks used for the measurement can be documented by text, history, pictures and working dates. A point distance measurement is linked to a fixed position of electronic distancemeter from which measurements are per-formed.
The measurement campaigns are stored by date in dif-ferent forms (x, y, z or distance d); benchmarks are de-scribed and corrections are recorded (Fig. 3). Both measure-ment campaigns and benchmarks can be easily found within data tree structures (Figs. 2 and 4). Movements for one or more points can be represented on time-displacement graphs (Fig. 2). The data can be represented on various maps us-ing different kinds of symbols that represent the
displace-V e rti c a l m o v e m e n t Ho riz on talm ov em ent 3D differential movements East South Altitude Fig. 4
Fig. 4. Illustration of the output possibility of the RandaDB
us-ing Mapobjects library (MapObjects, 2000). The orthophoto is dis-played with arrows representing the horizontal displacement and the vertical displacement of each point. For 1-D data, different sized circles represent the displacement values. Benchmarks are described by pictures and texts. The displacements can also be rep-resented in a projection of the 3-D space.
ments. For instance, arrows depict the 3-D movement paths of benchmarks. Information and documents related to points can be viewed by clicking on each of them (Fig. 4).
Arrows or variable sized circles that are superimposed on various backgrounds (e.g. digital elevation model or geo-referenced map, air photos) can represent 1-D, 2-D as well as 3-D displacements (Fig 4).
It is then possible to plot benchmark displacements versus another benchmark displacements. Data for a given date can be exported as x, y, z or apparent displacement (d) to be input in an interpolating and mapping program.
4 Results
Numerous tools and procedures were developed in using the above-mentioned principles for the monitoring of Randa movements. The present section presents the principal re-sults of this approach applied to the Randa case study.
The database software for the Randa rockslide (Ran-daDB) was developed at the CREALP (Centre de recherche sur l’environnement alpin) using the Windev environment (Windev, 2000). Windev provides an effective database man-agement and programming languages for data treatment. The Mapobjects library (MapObjects, 2000) is implemented for map representation.
4.1 Displacements
The EDM displacements were calculated using an assumed stable point near the slope movement area. Because of air
M. Jaboyedoff et al.: Note on the design of a geodetic database 191
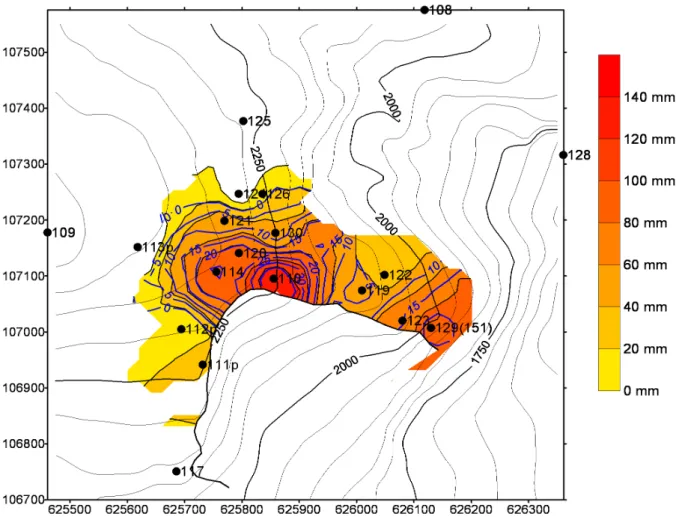
Fig. 5. Example of the tool implemented in the RandaDB using Surfer (1999) allowing the interpretation of movement homogeneity by
using map of displacements during two periods of time: 1 July 1991 to 21 February 1997 and 1 July 1991 to 30 May 1994. The coloured background represents the displacement map from 1 July 1991 to 21 February 1997, and the isolines are the difference of movements from 1 July 1991 to 30 May 1994. The mapping of the movement values of benchmarks down to the valley are represented in absolute values (positive). Points indicate the label of the benchmarks. Note that if velocities of displacement were constant, the ratio of displacements measured from 1 July 1991 to 21 February 1997 and from 1 July 1991 to 30 May 1994 would be in a ratio of 3. Because of the decelerating movement up to approximately 1995, the ratio is a little over 2. However the spatial distributions of displacements are identical, indicating that no relative acceleration has occurred.
stratification and hot winds, the atmospheric correction is dif-ficult to be estimated.
During 1992–1993 the highest recorded movement veloc-ity (EDM from valley) was about 2 mm/year. Since the mid-dle of 1994 the velocity has stabilized at around 1 mm/year (Fig. 2). As indicated in the EDM displacement map (Fig. 5), movements are greater around the scar and increase locally on top of hills. The 3-D data show that the overall movement direction is down towards the southeast (Fig. 4).
4.2 Data maintenance
For an optimal analysis, data sets must be corrected for sys-tematic measurement errors, like the difference between suc-cessive data caused by accidental measurement point dis-placement or benchmark redis-placement, etc. It is possible to correct data for a time range by using a linear or a polyno-mial interpolator.
In the case of an unexplained large discrepancy between two successive measurements, the displacement error can be estimated by using linear regression in a time-displacement graph depicting the previous values of displacements. The corrected value is obtained using the regression to estimate the displacement value at the time of the erroneous data (Fig. 6). When a new point is introduced, in order to have an effective monitoring, the initial displacement must be estimated with respect to the time at the beginning of the displacement recording, t0 (Fig. 7). This can be achieved,
by correlating its movement with other points, preferably nearby and only after several point measurements have been attained. The regression line calculated between the pre-existing point (123F) displacements and the new one (129F) makes it possible to estimate the value that must be added to the new point (129F) displacement. Thus the first value of displacement at t0for (129F) is equal to the regression line
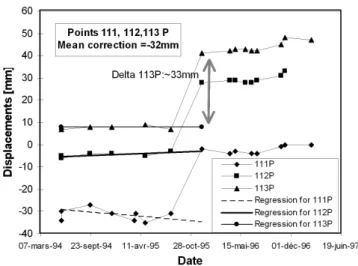
Fig. 6
Fig. 6. Example of a correction procedure when a fixed point (P) ofmeasurement moved by accident. All the benchmark (111P, 112P, 113P) measures are affected, thus the discrepancy with the expected value can be estimated. In this case the data were reduced by 32 mm from October 1995.
intercept. This procedure is appropriate only if movements are proportional. It is better to use regression line type such as Reduced Major Axis or principal axis (Davis, 1986), in order to take into account uncertainty on both axes.
The maintenance must lead to data sets which are cor-rected as much as possible for all errors and having the same
t0. Note that GPS is only partially affected by the problems
above because GPS measurements give absolute positions, thus limiting the possibility of errors. However, positioning of the GPS device can be also affected by human ones or caused by a malfunctioning of the device.
All data acquisition is affected by error, thus a proper data maintenance results in identifying and managing punctual er-rors or systematic erer-rors. The first is quite easy to manage, but the second needs solution as proposed above.
4.3 Variation and homogeneity of velocities
A plot of the total displacements at a time ti, starting from
t0, of all available successive benchmarks measurement
dis-placement sets versus those for ti +n−ti, gives changes of
the movements. Assuming benchmarks velocities are all in a constant ratio, the plot displays sets of aligned points pass-ing through the origin and where slope increases with time (Fig. 8A). If some points are not aligned, it means that they have undergone acceleration compared to the other points. This representation allows verifying if the movements for different points are proportional; making velocity variations quickly detectable, or defining a signature of the entire move-ment for monitoring purposes. Curved lines or dispersion of points displacements are indicative of acceleration of the dis-placement in a certain area that can be considered as a first level of alarm if the points were aligned in the previous sur-vey. If all the points accelerate together, this tool is irrelevant considering only a linear fitting.
T o ta ld is p la ce m en t o f la n d -m a rk Lb st a rt in g fr o m tj
∆∆
d
d
jj t J t iA
B
tt00 tt TToottaall ddiissppllaacceemmeenntt ooff llaannddmmaarrkkLLaassttaarrttiinngg ffrroomm tt00
Fig. 7
Resul ts for thepe riod tJ totiFig. 7. Example of a correction procedure for new benchmark used
for data maintenance in the RandaDB. (A) Synthetic example: The measurements of displacement of the benchmark Lbbegins at time
tj, its total displacement from time t0is estimated using a
neigh-bouring benchmark Lathat has been recorded since t0. 1djis the
displacement to be added to the new benchmark displacements to obtain the same total displacement since t0. (B) Example for a new
point 129F using the 123F as a reference.
Figure 8B displays an example from the Randa database, which indicates that movements are homogenous for the measurements campaigns before the 29 July 1998. All the measurement of each campaign are aligned, no relative movements are observed. It means that the rock mass is slowly moving down and decelerating as indicated on Figs. 2 and 5 This deceleration state can be used as the reference state of the instability, implying that any detected relative movements or acceleration can be considered as a warning. 4.4 Displacements maps
The comparison of maps established for different dates gives a basic estimation of overall slope movement. An im-provement on this method is to compare the differences of
M. Jaboyedoff et al.: Note on the design of a geodetic database 193
Total displacement of landmark at ti
D
is
p
la
ce
m
en
t
st
a
rt
in
g
fr
o
m
t
io
f
la
n
d
m
a
rk
a
t
n
x
∆
t
Regression for ti+∆
t Regre ssion f orti+ 2 x∆
t Pred iction for t i + 3x∆
t Resu ltsof regr essio nfo r t+i 3x∆
t∆∆
tt Measurements at 3 x∆
t 2 x∆
t 1 x∆
tFig. 8
A
B
Fig. 8. (A) Synthetic example of
the tool implemented in the RandaDB analysing the interpretation the homo-geneity of movements. The veloci-ties are assumed to be constant for the two first displacement measure-ments made after 1 × 1t and 2 × 1t starting from ti, indicating a weak
dispersion. After 3 × 1t the veloc-ities are more dispersed and some points suffered acceleration, indicat-ing a change in behaviour. (B)
Ex-ample from the RandaDB (note that that movements are negative); displace-ment measuredisplace-ment sets prior to or dated 17 July 1997 are compared to a more recent (2 July 1998) displacement mea-surement sets. The graph indicates that movements have been proportional dur-ing the previous years.
displacements between different periods (Figs. 9 and 5). It allows a quick visualisation of the spatial changes in bench-marks velocities, which can be an indicator of instability mechanism change and/or in precursory movements of a movement crisis. By mapping difference in velocity, the zone of increasing velocity can be detected by an increase of area of a given value.
Any map produced must be inserted in the database as archived documents in order to be used as reference. This always implies using the same interpolator, the same data point position, and a database that can maintain and correct a constant set of data points.
4.5 Movements forecasting
Benchmarks that are representative of the overall slope movements can be studied in a more detailed way (Fig. 10). Simple and effective monitoring can be achieved through a forward-looking curve for point displacement. These curves
fit to the benchmark displacement data, which include dif-ferent types of seasonal variations. For instance, the Randa data set has seasonal (or daily) variations resulting from the change of air temperature due to long distance geodesic in-frared measurements (Figs. 2 and 10). In Fig. 10, the fore-cast curve (time-displacement) fits to displacements using a power law with an additional seasonal variation expressed by a sine. A discrepancy between forecast values and ac-tual measurements might lead to a first level of alarm. If the difference cannot be explained by methodological prob-lems (Fig. 10), the discrepancy can be considered as a second level alarm. A detailed analysis of the movement changes with respect to the assumed mechanism must be completed in order to give the next level of alarm. Note that sys-tematic variations can produce imperceptible drifts to some measurements. These appear only after several measurement campaigns. Thus, the curve must be periodically readjusted overall.
∆
d
1∆
d
2∆
d
4B
∆
d
3∆
d
1∆
d
2∆
d
3∆
d
4y
x
A
t
1-t
0t
2-t
1t
3-t
2Change with time of
∆
d
4
isoline
C
t
1-t
0=t
2-t
1=t
3-t
2=
∆
t
Fig. 9
Fig. 9. Schematic illustration of monitoring by mapping
move-ments. The arrows show the velocities (lengths are proportional to the displacements, and direction indicate movement direction). The three isolines sets are displayed for successive identical periods of time 1t. The displacements increments are displayed by chrono-logical order respectively blue, green and red. (A) Two mapping with no variation in the distribution of velocities, i.e. isolines for
t1−t0and t2−t1are similar. (B) Illustration of a warning
situ-ation: Velocity increase for some points and dispersion of veloc-ity (the red isolines correspond to t3−t2measurement period and
1d1< 1d2< 1d3< 1d4) compared to the previous displacement
data, indicating a change in mechanism, the greyed area indicates the zones where the movements have accelerated. (C) Detail of (B) showing a rapid change of shape of isoline which highlights differ-ential movements and movement accelerations.
Fig. 10
Fig. 10. Example of movement forecasting that leads to
identifi-cation of defective devices (a fixed point was moving). The fore-cast takes into account a seasonal distance variation and a slow de-crease of the movement using the relationship for the considered point 1d = 0.438 × t0.72+2 sin(2π t /365). Note the slow drift of the erroneous data.
5 Discussion
Slope monitoring over a long period of time implies increas-ing number of erroneous data, and benchmark defects lead predictably to very confused data sets. As a consequence, distinction between error and changes in the slope behaviour might be missed. Thus a database and associated tools are mandatory.
During the monitoring, warning parameters must be cho-sen and defined. Threshold values or rules must be es-tablished for variables, such as benchmark displacements, benchmark displacement velocities, rainfalls or others. The-ses value must be updated over time. In the case of Randa, the warning parameters are the mean velocity of each bench-mark deduced from the year preceding the measurement.
If a subsequent analysis demonstrates erroneous correc-tions, then original data must be accessible. If possible, all movements must refer to an initial time t0.
Monitoring is often a routine job where simple procedures are repeated. Alarm variables can be as simple as high dis-placement velocities, but this is not sufficient for a true and effective monitoring system. The development of an insta-bility mechanism model is a key point for a middle term catastrophe forecast. As demonstrated by the monitoring of the Randa scar, the tools presented above are effective for such a purpose. These tools can help to extract informa-tion on movement changes. Forecasting curves proved to be
M. Jaboyedoff et al.: Note on the design of a geodetic database 195 especially useful. For instance, at Randa, the forecast for one
of the fastest point was found to be larger than the measured value (Fig. 10). On the other hand, the map of slope displace-ment or apparent slope displacedisplace-ment indicates no change in the overall slope movement (Fig. 2). Because the distance measurements are corrected with respect to a fixed point, a detailed analysis of the measured value and the map of move-ments revealed that the fixed point was also moving. As a consequence, all the data of the Randa scar monitoring sys-tem were corrected assuming that the mean of three other points were considered as fixed.
In the case of large landslide movements, it is necessary to frequently update the monitoring devices and analysis. The geometry of the instability varies with time and the mean-ing of measurements also varies due to the large movements of benchmarks. Thus an expert must continuously update the model by constant reinterpretation. For long term implemen-tation of monitoring systems, the expected geometry and in-stability mechanism must be assessed. Such a forecast can be based on field observations or observed displacements after a few months or a few years. In the case of Randa, the suc-cessive displacement maps clearly show that the movements are homothetic in time (Fig. 5), which means that all veloc-ities are changing proportionally to each other. As a con-sequence the map of movements displays always the same shape. In other words, if benchmark velocities are constant the displacement map for successive identical time interval leads to similar maps (Fig. 9).
The possible mechanisms affecting the slope can be de-duced from the movement maps. The displacement isolines traced on the topography define in three dimensions nearly planar surfaces within the upper part of the Randa scar. This can be explained by assuming a simple shear band affecting the slope in the direction 135◦/40◦. This assumption must be refined with time using the 3-D data that are still too un-certain. The more distant a point is from the sliding base, the faster it moves. In addition, fractures perpendicular to the sliding direction are observed above the Randa scar in the sloping ledges. These open fractures confirm the above interpretation. Thus the higher a benchmark is above the basal surface and, simultaneously more down the slope it is located; the larger is its displacement (Fig. 11).
Understanding of any steady state movement, acceleration or change in the overall instability movements is of primary importance. For instance, a rockslide in a steep cliff mov-ing 10 cm/day will most likely end up to a rockfall within a few days or months, because in 3 months the movement will reach an equivalent of roughly 10 m of displacement. For in-stance, the second Randa rockslide occurred after only 40 cm of displacement at one of the monitored tension cracks.
Triangulation, which uses angle, and trilateration, which uses distance to estimate point position, are tools that can be implemented in a monitoring plan. On-line monitoring is now a more and more common tool (Evrard et al., 1990b), but it is based on certain limits defined by a preliminary modelling. Meteorological and piezometric data can be in-troduced as monitoring variables.
Fig. 11
5
5
Dis plac em ent Disp lacem ent x z Displacement scale 5 units 4 3 3 1 Appro ximate direction of slid ing along J4 orJ4-J2 (135°/40°)5 un
its
Fig. 11. Assumed mechanisms and associated displacements above
and in the upper part of the Randa scar. The direction measured by 3-D devices and 1-D interpretation is approximately 135◦/40◦, which may correspond to the direction J4 (125◦/45◦) or by the wedge formed by J4/J2 (135◦/43◦) (structure data from Sartori et al., 2003).
6 Conclusion
The slope monitoring principles presented above have the advantage of linking the database maintenance and simple monitoring tools needed for analysing movements. The main components of a monitoring system include data storage, data corrections, different ways to represent data and the forecast of warning parameters in space and time in order to estimate threshold limits.
The data analysis of the Randa scar, using the software RandaDB, has been greatly improved by the quick verifi-cation of data since this software requires a systematic ap-proach in data treatment and analysis. Using the Randa monitoring system, it was shown that no significant accel-erations were reported. Furthermore the development of the monitoring tools, which make it possible to distinguish between measurement errors and movement pattern changes, certainly helps in forecasting the next rockslide.
The development of this software based on the princi-ple linking data management and monitoring tools is use-ful in the Alps areas because the monitoring of landslides
mostly follows the same principles that prevail the develop-ment of the RandaDB software. In other regions, volcanic and seismic dangers are often monitored using geodetic de-vices (Archbold et al., 1988; Pingue et al., 1998; Young et al., 2000). Such a monitoring system based on RandaDB will certainly find applications in those cases because the eco-nomic implications of volcanic catastrophes are enormous.
Acknowledgements. We are grateful to the NHESS guest editor
R. Couture for advices and for organizing the session about databases. We thank G. B. Crosta from Milano Biccoca University, and D. Hantz from Grenoble Joseph Fourier University for their detailed reviews. Another anonymous reviewer is also thanked. We would also like to thank C. Levesque from Laval University for proofreading the article.
Edited by: R. Couture
Reviewed by: G. B. Crosta and two other referees
References
Archbold, M. J., McKee, C. O., Talai, B., Mori, J., and de Saint Ours, P.: Electronic distance measuring network mon-itoring during the Rabaul seismicity-deformational crisis of 1983–1985, J. of Geophys. Res., B 93, 12 123–12 136, 1988. Azimi, C., Biarez, J., Desvarreux, P., and Keime, F.: Pr´evision
d’´eboulement en terrain gypseux, in: Landslides - Glissements de terrains, Proc. 5th Int. Symp. on Landslides, edited by Bon-nard, C., A.A. Balkema, Rotterdam, Netherlands, 531–536, 1988.
Bearth, P.: Geologischer Atlas der Schweiz, Blatt N◦1328 Randa mit Erkl¨arungen, Schweizerische Geologische Kommission, 1964.
Bromhead, E. N., Curtis, R. D., and Schofield, W.: Observation and adjustment of a geodetic survey network for measurement of landslide movement, in: Landslides - Glissements de terrains, Proc. 5th Int. Symp. on Landslides, edited by Bonnard, C., A.A. Balkema Publishers, Rotterdam, Netherlands, 383–386, 1988. Crosta, G.: Regionalization of rainfall thresholds: an aid to
land-slide hazard evaluation, Env. Geol., 35, 131–145, 1998. Crosta, G. B. and Agliardi, F.: Failure forecast for large rock slides
by surface displacement measurements, Can. Geotech. J., 40, 176–191, 2003.
Davis, J. C.: Statistics and data analysis in geology, Second edition, New York: John Wiley & Sons, 1986.
Dzurisin, D.: A comprehensive approach to monitoring volcano de-formation as a window on the eruption cycle, Rev. of Geophys., 41, doi:10.1029/2003RG000134, 2003.
Eberhardt, E., Willenberg, H., Loew, S., and Maurer, H.: Active rockslides in Switzerland – Understanding mechanisms and pro-cesses, in: International Conference on Landslides – Causes, Im-pacts and Countermeasures, 17–21 June 2001, Davos, Switzer-land, edited by K¨uhne, M., Einstein, H. H., Krauter, E., Klap-perich, H., and P¨ottler, R., VGE, Essen, 25–34, 2001.
MapObjects: ESRI’s powerful GIS and mapping components, ESRI, 2000.
Evrard, H., Gouin, T., Benoit, A., and Duranthon, J.-P.: S´echilienne, Risques majeurs d’´eboulements en masse – Point sur la surveil-lance du site, Bull. Liaison Lab. Ponts Chauss, 165, 7–16, 1990a.
Evrard, H., Leger, P., and Spinnler, Y.: T´el´esurveillance des falaises de l’autoroute A40, Rev. G´en, Routes A´erodr., 680, 25–28, 1990b.
Fukuzono, T.: Recent studies on time prediction of slope failure, Landslide News, 4, 9–12, 1990.
Gili, J. A., Corominas, J., and Rius, J.: Using Global Positioning System techniques in landslide monitoring, Eng. Geol., 55, 167– 192, 2000.
Guerricchio, A., Melidoro, G., and Rizzo, V.: Instrumental observa-tions of the slope deformaobserva-tions and deep phenomena in Maratea Valley (Italy), in: Landslides – Glissements de terrains, Proc. 5th Int. Symp. on Landslides, edited by Christophe, B., A.A. Balkema Publishers, 415–422, 1988.
Jaboyedoff, M. : Note pr´eliminaire sur l’interpr´etation des donn´ees de d´eplacement des abords du Bergsturtz de Grossgufer, in: Bergsturtz Grossgufer – Randa, Rapport de surveillance Nr 2, Rapport CRSFA/95.06, 1995.
Keaton, J. R. and DeGraff, J. V.: Surface observation and geo-logic mapping, in: Landslides investigation and mitigation, 176, Transport Research Board, NRC, edited by Turner, A. K. and Schuster, R. L., National Academy Press, Washington D.C., 178–230, 1996.
Leica: Distomat Wild DI1001 Manuel d’utilisation, Wild, Heer-brugg, 1990.
OFEE, Recommandations: Prise en compte des dangers dus aux mouvements de terrain dans le cadre des activit´es de l’am´enagement du territoire, in Dangers naturels, Office f´ed´eral de l’am´enagement du territoire, 42, 1997.
Ornstein, P., Jaboyedoff, M., and Rouiller, J.-D.: Surveillance g´eod´esique du site de Randa (VS): gestion des mesures 1-D et 3-D, Publication Soc. Suisse M´ec. Sols Roches, 143, 82–91, 2001.
Pingue, F., Troise, C., De Luca, G., and Grassi, V.: Geodetic mon-itoring of Mt. Vesuvius Volcano, Italy, based on EDM and GPS survey, J. Volc. Geoth. Res., 82, 151–160, 1998.
Rochet, L.: Auscultation; diagnostic; surveillance, Bull. Int. Assoc. Eng. Geol., 45, 43–57, 1992.
Sartori, M., Baillifard, F., Jaboyedoff, M., and Rouiller, J.-D.: Kine-matics of the 1991 Randa rockslides (Valais, Switzerland), 2003, Natural Hazard Earth System Sciences, 3, 423–433, 2003. Schindler, C., Cuenod, Y., Eisenlohr, T., and Joris, C.-L.: Die
Ereignisse vom 18 April und 9 Mai 1991 bei Randa (VS) – ein atypischer Bergsturz in Raten, Eclogae geol. Helv., 86, 643–665, 1993.
Surfer: Surface Mapping System, Golden Software Inc., Golden Colorado, 1999.
Swiss Association of Road and Transportation Experts: VSS-670305, Auscultation des ouvrages implant´es en terrains insta-bles, Union des professionnels suisses de la route (VSS), Z¨urich, 2000.
Wieczorek, G. F., Wilson, R. C., Mark, R. K., Kiefer, D. K., Harp, E. L., Ellen, S. D., Brown, W. M., and Price, P.: Land-slide warning system in the San Francisco Bay region, Califor-nia, Landslide News, 4, 5–8, 1990.
Windev: Windev 5.5, Montpelier, PCSOFT, 2000.
Young, K. D., Voight, B., Subandriyo, Sajiman,, Miswanto,, and Casadevall, T. J.: Ground deformation at Merapi Volcano, Java, Indonesia; distance changes, June 1988–October 1995, J. Volc. Geoth. Res., 100, 233–259, 2000.


![La notion du pouvoir dans le projet de l’Iṣlāḥ [Islam]](data:image/gif;base64,R0lGODlhAQABAIAAAP///wAAACH5BAEAAAAALAAAAAABAAEAAAICRAEAOw==)