Série Scientifique
Scientific Series
Nº 94s-18
TECHNOLOGICAL PENETRATION AND CUMULATIVE BENEFITS IN SMEs
Élisabeth Lefebvre, Louis A. Lefebvre, Marie-Josée Roy
Ce document est publié dans lintention de rendre accessible les résultats préliminaires de la recherche effectuée au CIRANO, afin de susciter des échanges et des suggestions. Les idées et les opinions émises sont sous lunique responsabilité des auteurs, et ne représentent pas nécessairement les positions du CIRANO ou de ses partenaires.
This paper presents preliminary research carried out at CIRANO and aims to encourage discussion and comment. The observations and viewpoints expressed are the sole responsibility of the authors. They do not necessarily represent positions of CIRANO or its partners. CIRANO
Le CIRANO est une corporation privée à but non lucratif constituée en vertu de la Loi des compagnies du Québec. Le financement de son infrastructure et de ses activités de recherche provient des cotisations de ses organisations-membres, dune subvention dinfrastructure du ministère de lIndustrie, du Commerce, de la Science et de la Technologie, de même que des subventions et mandats obtenus par ses équipes de recherche. La Série Scientifique est la réalisation dune des missions que sest données le CIRANO, soit de développer lanalyse scientifique des organisations et des comportements stratégiques.
CIRANO is a private non-profit organization incorporated under the Québec Companies Act. Its infrastructure and research activities are funded through fees paid by member organizations, an infrastructure grant from the Ministère de lIndustrie, du Commerce, de la Science et de la Technologie, and grants and research mandates obtained by its research teams. The Scientific Series fulfils one of the missions of CIRANO: to develop the scientific analysis of organizations and strategic behaviour.
Les organisations-partenaires / The Partner Organizations
Ministère de lIndustrie, du Commerce, de la Science et de la Technologie. École des Hautes Études Commerciales.
École Polytechnique. Université de Montréal. Université Laval. McGill University.
Université du Québec à Montréal. Bell Québec.
Caisse de dépôt et de placement du Québec. Hydro-Québec.
Banque Laurentienne du Canada.
Fédération des caisses populaires de Montréal et de lOuest-du-Québec.
Technological Penetration and
Cumulative Benefits in SMEs
Élisabeth Lefebvre , Louis A. Lefebvre and Marie-Josée Roy
Résumé / AbstractThe relative importance of the benefits derived from the adoption of computer-based administrative and production applications depends to a large extent on the level of technological penetration attained by a particular firm. This evolutionary perspective is investigated in an empirical study carried out in manufacturing firms operating in one specific sector of industrial activity.
Limportance relative des bénéfices provenant de ladoption des nouvelles technologies de linformation et de production sont fonction en grande partie du niveau de pénétration technologique atteint par la firme. Cette perspective évolutionniste est étudiée dans le cadre dune recherche empirique menée auprès de petites et moyennes entreprises manufacturières innovatrices oeuvrant dans le secteur du métal.
1.0 Introduction
In an increasingly open and competitive business environment, small manufacturing enterprises (SMEs) must meet higher standards and respond more effectively to the needs of both local and international customers. This translates into competitive advantages such as highly differentiated products and services, improved quality, increased dependability, lower costs, reduced lead times to market and shorter delivery cycles. Yet in order to gain such advantages, firms must in many cases rely on new computer-based technologies, which may be associated with administrative applications or production applications. Advanced manufacturing technologies have been shown to dramatically improve the competitive performance of manufacturing firms (Naik and Chakravarty, 1992). Similarly information technologies applied to administrative applications have also been positively associated with improved performance (Bradley et al., 1993). In a manufacturing environment, it becomes increasingly difficult to dissociate technologies on the grounds that they are dedicated to either administrative or production applications. The new approaches to manufacturing aimed at rapid turnaround and time-based competition and referred to as flexible manufacturing practices based on small manufacturing cells require technology integration in order to support the coordination of a firms internal and external activities with customers and suppliers.
2.0 Research focus
The importance of effectively exploiting and managing cross-functional activities within firms is one of the important issues facing managers today (Moynihan, 1990). In order to do this, many managerial challenges beyond the technical or technological aspects must be dealt with. One such challenge has to do with the traditional split between administrative employees (marketing, sales, accounting or finance) and production/manufacturing employees (engineers, production managers, technicians, machinists). Successful technology adoption and implementation cannot be achieved without the support of everyone involved. For manufacturing firms, this is a central issue, considering that technology integration must take into account both perspectives and both types of technology applications. As reported recently by Mansfield, flexible manufacturing systems represent one of the most important industrial applications of information technology (Mansfield, 1993). As such, it cannot be discarded and may constitute the basis of competition in the years to come. This raises questions with regard to the levels of technological penetration and scope required. In fact, what are the advantages derived from the combined effect of differing levels of computer-based administrative and production applications? Do these advantages evolve as part of an organizational learning pattern as suggested by Burgelman and Rosenbloom (1989)?
These questions are investigated here in the specific context of small manufacturing firms.
3.0 Methodology
3.1 Population and data collection
The firms surveyed for this study were drawn from a list published by the Canadian Association of Manufacturers. Specific criteria were defined and followed to ensure that our survey population was as homogeneous as possible: (i) we surveyed manufacturing firms in the same industrial sector (metal); (ii) all firms were of the same size group (fewer than 200 employees); (iii) all had adopted at least one advanced manufacturing technology; and (iv) firms were located in the same geographic region (province of Quebec). Furthermore, all firms were independent so that technology adoption decisions could not have been dictated or influenced by a head office.
One hundred and fifty-one firms met all the above criteria and their CEOs were contacted by phone: 86 agreed to an interview. The questionnaire used for the interviews was thoroughly pre-tested with top managers of five firms. The interviews, which lasted between two and three hours, were conducted by the principal investigators and two graduate students following the same rigorous protocol. The main respondent was always the CEO, although occasionally we double-checked some of the more detailed factual information, such as the exact date of purchase of a specific computer-based application, with the person responsible for operations, for instance. Scheduling problems prevented two CEOs from participating in the study. The final response rate was actually 56% (84 respondents).
The goodness of fit tests conducted for the analysis of non-respondents indicated that they did not differ from the respondents with respect to firm size. However, a slight bias is introduced when one considers the proportion of firms according to their location (urban/non-urban). For some reason, CEOs of firms located in non-urban locations were more inclined to participate in the interview (62%).
3.2 Research variables
The research variables can be grouped into three sets. The first comprises measures of technological experience, namely technological penetration, technological posture and details of the applications last introduced in the firms. The second relates to the actual benefits firms derived from their computer-based applications. The last set of
variables captures two dimensions of performance: performance on international markets and financial performance. These three sets of variables are described in further detail below.
Technological experience
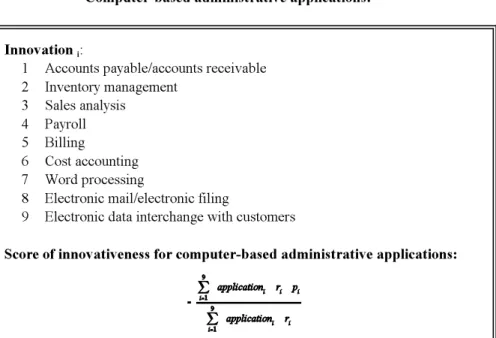
In order to capture different levels of technological penetration, two variables are proposed: (i) the score of process innovativeness for computer-based administrative applications and (ii) the score for computer-based production applications (figure 1). The two scores are composite measures of the presence/absence of each computer-based administrative or production application listed in figure 1 and the degree of radicalness of each application. The degree of radicalness was evaluated by a panel of 20 experts who were familiar with the industrial sector and the technologies involved. Inter-rater reliability proved to be excellent (r = 0.92).
The levels of technological penetration derived from these two scores were also validated by an additional research variable: the technological posture of a particular firm, its relative level of computerization compared with direct competitors. The historical information concerning the adoption of computer-based applications was as follows: exact date of purchase and name of equipment/software which was bought for each specific application. As providing all this information proved to be a rather lengthy and laborious process during the pre-test, the historical information was limited to the three most recent computer-based applications.
Derived benefits
The research variables Benefits derived from the adoption of computer-based applications are all based on perceptual measures. These variables originally corresponded to the list of variables derived mainly from the work of Miller and Roth (1988) based on 7-point Likert scales; they reflect the types of benefits that can be achieved in a manufacturing environment. All these variables were extensively pre-tested in 44 small manufacturing firms (Lefebvre et al., 1989). Construct reliability was satisfactory with Cronbach alphas ranging from 0.57 to 0.93 in the present study. The complete list of benefits appears in table 3.
Computer-based administrative applications: * Innovation :i
1 Accounts payable/accounts receivable 2 Inventory management 3 Sales analysis 4 Payroll 5 Billing 6 Cost accounting 7 Word processing
8 Electronic mail/electronic filing
9 Electronic data interchange with customers
Score of innovativeness for computer-based administrative applications:
Where r = degree of radicalness of the application as established by a panel of experts who ranked eachi i
application. P = 0 where application is absent in one particular firm and 1 where application is present.i i i
Figure 1 Measuring technological penetration: scores of process
Computer-based production applications: * Application :j
Production Technology
1 Computer-assisted design (CAD) and/or Computer-assisted engineering (CAE)
2 CAD output used to control manufacturing machines (CAD/CAM) Fabrication and Assembly
3 Flexible manufacturing cells (FMC) or systems (FMS) 4 Numerical control machines (NC)
5 Pick and place robots 6 Other robots
Automated Material Handling
7 Automated storage and retrieval system (AS/RS) 8 Automated guided vehicle system (AGVS)
Automated Sensor-Based Inspection and/or Test Equipment 9 Performed on incoming or in-process materials
10 Performed on final product Communications and Control
11 Inter company computer network linking plant to subcontractors Manufacturing Information Systems
12 MRPI or MRPII
Score of innovativeness for computer-based production applications
Where r = degree of radicalness of the application as established by a panel of experts who rankedj j
each application. P = 0 where application is absent in one particular firm and 1 where applicationj j i
is present.
* Adapted from a typology produced by Statistics Canada (1989)
Figure 1 Measuring technological penetration: scores of process innovativeness (continued)
Firm performance
Export performance is a factual measure and represents the percentage of total sales realized in local, national and international markets. Such operational measures are frequently used to assess export performance (Bonaccorsi, 1992).
Financial performance is a three-item perceptual variable (Cronbach alpha = 0.68) capturing the relative increase in sales, assets and return on investment over a five-year period compared to direct competitors. CEOs of small independent firms are often reluctant to disclose factual financial data (Sapienza et al., 1988).
3.3 Statistical analysis
Statistical analysis was performed in five consecutive steps:
i) examining historical data to try to identify some pattern of adoption for computer-based administrative and production applications (descriptive statistics - table 1);
ii) assessing levels of technological penetration and deriving clusters of firms accordingly (cluster analysis - table 2);
iii) comparing the benefits derived from the adoption of computer-based administrative and production applications in clusters of firms with differing levels of technological penetration (non-parametric analysis of variance and Ducan tests - table 3);
(iv) identifying underlying dimensions or factors for the above benefits (factorial analysis on 24 variables - table 4) and ordering factors according to their relative importance for each cluster of firms (Kendalls test - table 5); (v) relating the level of technological penetration to both export and financial
performance (non-parametric analysis of variance - table 6).
4.0 Results and discussion
Empirical results for each step are presented in the following sections.
4.1 Adoption of computer-based administrative and production
applications from a historical point of view
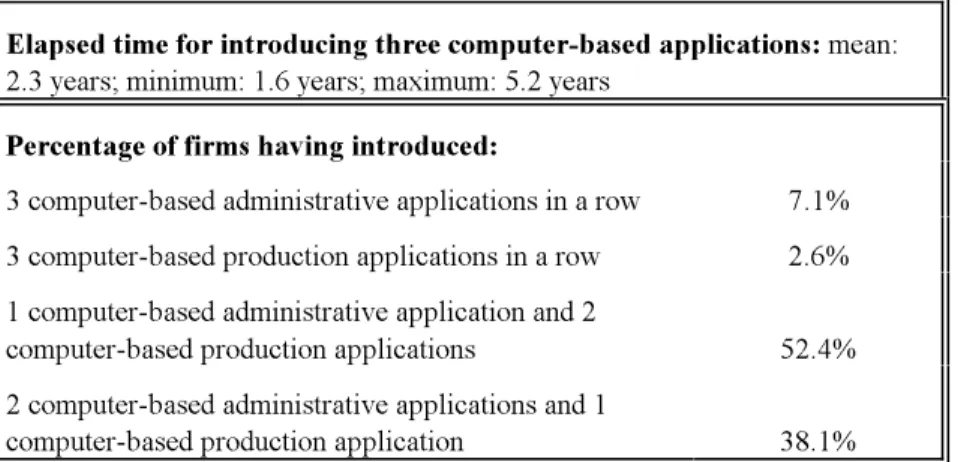
Table 1 presents some information on the three most recent computer-based applications introduced by the responding firms. The introduction of these applications took 2.3 years on average. The rather informal organizational context, the centralized decision-making process and the adaptability and flexibility of small
firms partially explain why these firms can adopt technological innovations rather rapidly. In some cases, through the lack of expertise and financial resources may have slowed down the adoption rate.
Elapsed time for introducing three computer-based applications: mean: 2.3 years; minimum: 1.6 years; maximum: 5.2 years
Percentage of firms having introduced:
3 computer-based administrative applications in a row 7.1%
3 computer-based production applications in a row 2.6%
1 computer-based administrative application and 2
computer-based production applications 52.4%
2 computer-based administrative applications and 1
computer-based production application 38.1%
Table 1 Descriptive statistics on the introduction of the three most recent computer-based applications n = 84
There seems to be some evidence that computer-based administrative and production applications are developed simultaneously, implying that there are synergistic effects between the two types of applications: 90.5% of the firms have a mixed portfolio for their three most recent applications (52.4% and 38.1%). As one CEO explains it: The introduction of numerical control machines has greatly improved the flexibility of the manufacturing process and has allowed us to produce our products in larger quantities with more diverse specifications. Obviously, the work done by our administrative staff and our vendors is getting more complex and therefore we had to implement a rather sophisticated cost accounting system. In several firms, there is also some evidence of synergy between the two types of applications but integration is barely starting.
4.2 Levels of technological penetration
Rather than determining the levels of technological penetration arbitrarily, cluster analysis was performed on the 84 firms to classify groups along two variables: process innovativeness scores (as defined in figure 1) for computer-based administrative and production applications. The hierarchical clustering method used is Wards method, which is based on the squared Euclidian measures of similarity.
The results presented in table 2 demonstrate the presence of three significantly different groups of firms (p = 0.0000 for the two variables used to determine the clusters). The first group (level 1) lags behind the others for both administrative and production technologies. For the second cluster (level 2), the penetration of based administrative technologies is extremely high but it is quite low for computer-based production technologies. The third group (level 3) displays the highest score for production technologies and a high score for administrative applications. The three clusters present increasing levels of process innovativeness, the first group being the laggards and the third the more advanced innovators. The total innovativeness score and the CEOs perception of the relative rate of computerization of their own firms compared to direct competitors both validate the results from the cluster analysis.
Cluster formation Cluster 1
n = 371 Level 1 Cluster 2 n = 312 Level 2 Cluster 3 n = 163 Level 3 p 4
Variables used for determining the clusters:
Innovativeness score of for
computer-based administrative applications1 19.64 81.50 75.24 0.0000****
Innovativeness score for computer-based
manufacturing applications1 12.40 13.30 38.88 0.0000****
Variables used to validate the clusters:
Total innovativeness score2 14.28 31.04 48.34 0.0000****
Relative rate of computerization compared
to direct competitors3 4.16 4.87 5.56 0.0095***
Scores are calculated as described in figure 1; the maximum score is 100.
1
This score is the weighted average of all computer-based technologies on a scale of 100.
2
Perceptual measure based on 7-point Likert scales.
3
p = level of significance for the Kruskall Wallis test
4
* p < 0.10 *** p < 0.01
** p < 0.05 **** p < 0.001
Table 2 Levels of technological penetration: Results from cluster analysis and their validation
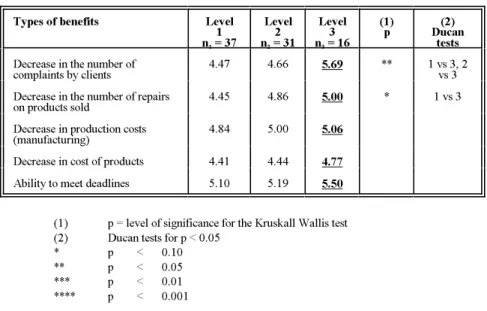
4.3 Benefits derived from computer-based administrative and production applications for firms with different levels of technological penetration Table 3 presents a comparison of 24 potential benefits across the three groups of firms. The highest value for each row is underlined and in bold characters to facilitate interpretation.
Types of benefits Level
1 n = 371 Level 2 n = 312 Level 3 n = 163 (1) p Ducan(2) tests Space reduction 2.46 2.67 3.63 * 1 vs 2
Reduction in inventory levels 2.15 3.17 3.13 ** 1 vs 2, 1
vs 3 Increased use of machinery and
equipment 4.92 4.77 5.81 *** 1 vs 3, 2vs 3
Reduction in capital investment
(e.g. equipment, machinery) 2.70 3.43 2.73
Increase in productivity of
production employees 5.23 5.38 5.46
Increase in productivity of
non-production employees 4.03 4.23 4.56
Decrease in set up time 4.14 4.80 4.85
Reduction in rate of rejected items 4.90 5.32 5.88 ** 1 vs 3
Decrease in rate of production of
defective items 4.72 5.16 5.75 ** 1 vs 3, 2vs 3
Increase in flexibility of
manufacturing process 5.08 5.47 5.63 * 1 vs 3
Reduction in lead time 4.14 4.51 4.81 * 1 vs 3
Reduction of managerial controls 4.00 4.10 4.94 ** 1 vs 3, 2
vs 3 Improvement of working
conditions 5.31 5.46 5.56
Improvement in the firms image in
the market 5.81 5.47 6.44 *** 1 vs 2, 2vs 3
Increase in number of customized
products offered 4.83 5.20 5.60 * 1 vs 3, 2vs 3
Increase in variety of products
offered 4.97 5.03 5.63 * 1 vs 3, 2vs 3
Increase in number of new
products offered 4.82 5.24 5.31
Increase in the durability of
products offered 3.56 3.66 4.10
Increase in the reliability of
products offered 5.26 5.17 5.38
Continued from previous page
Types of benefits Level
1 n = 371 Level 2 n = 312 Level 3 n = 163 (1) p Ducan(2) tests Decrease in the number of
complaints by clients 4.47 4.66 5.69 ** 1 vs 3, 2vs 3
Decrease in the number of repairs
on products sold 4.45 4.86 5.00 * 1 vs 3
Decrease in production costs
(manufacturing) 4.84 5.00 5.06
Decrease in cost of products 4.41 4.44 4.77
Ability to meet deadlines 5.10 5.19 5.50
(1) p = level of significance for the Kruskall Wallis test (2) Ducan tests for p < 0.05
* p < 0.10
** p < 0.05
*** p < 0.01
**** p < 0.001
Table 3 Benefits derived from the adoption of computer-based administrative and production technologies according to the three levels of technological penetration (n=84)
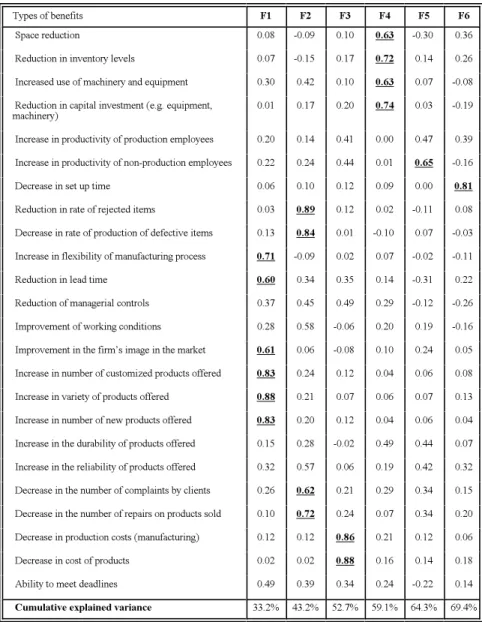
Types of benefits F1 F2 F3 F4 F5 F6 Space reduction 0.08 -0.09 0.10 0.63 -0.30 0.36 Reduction in inventory levels 0.07 -0.15 0.17 0.72 0.14 0.26 Increased use of machinery and equipment 0.30 0.42 0.10 0.63 0.07 -0.08 Reduction in capital investment (e.g. equipment,
machinery) 0.01 0.17 0.20 0.74 0.03 -0.19 Increase in productivity of production employees 0.20 0.14 0.41 0.00 0.47 0.39 Increase in productivity of non-production employees 0.22 0.24 0.44 0.01 0.65 -0.16 Decrease in set up time 0.06 0.10 0.12 0.09 0.00 0.81 Reduction in rate of rejected items 0.03 0.89 0.12 0.02 -0.11 0.08 Decrease in rate of production of defective items 0.13 0.84 0.01 -0.10 0.07 -0.03 Increase in flexibility of manufacturing process 0.71 -0.09 0.02 0.07 -0.02 -0.11 Reduction in lead time 0.60 0.34 0.35 0.14 -0.31 0.22 Reduction of managerial controls 0.37 0.45 0.49 0.29 -0.12 -0.26 Improvement of working conditions 0.28 0.58 -0.06 0.20 0.19 -0.16 Improvement in the firms image in the market 0.61 0.06 -0.08 0.10 0.24 0.05 Increase in number of customized products offered 0.83 0.24 0.12 0.04 0.06 0.08 Increase in variety of products offered 0.88 0.21 0.07 0.06 0.07 0.13 Increase in number of new products offered 0.83 0.20 0.12 0.04 0.06 0.04 Increase in the durability of products offered 0.15 0.28 -0.02 0.49 0.44 0.07 Increase in the reliability of products offered 0.32 0.57 0.06 0.19 0.42 0.32 Decrease in the number of complaints by clients 0.26 0.62 0.21 0.29 0.34 0.15 Decrease in the number of repairs on products sold 0.10 0.72 0.24 0.07 0.34 0.20 Decrease in production costs (manufacturing) 0.12 0.12 0.86 0.21 0.12 0.06 Decrease in cost of products 0.02 0.02 0.88 0.16 0.14 0.18 Ability to meet deadlines 0.49 0.39 0.34 0.24 -0.22 0.14 Cumulative explained variance 33.2% 43.2% 52.7% 59.1% 64.3% 69.4%
KMO (Sampling adequacy test) = 0.77
Table 4 Results of the factorial analysis conducted on the benefits derived from computer-based administrative and production technologies (n=84)
The results from table 3 can be summarized as follows:
(i) Level 3 firms, the more advanced innovators, score highest on 22 of the 24 potential benefits with the exception of reduction in inventory levels, where the difference from level 2 firms is very small, indeed insignificant, and reduction in capital investment. Reduction in capital investment is low for the level 3 firms since substantial investments are required for advanced manufacturing technology adoption especially in the context of small firms.
(ii) A progression from level 1 to 2 and then to 3 seems to exist for most benefits (19 benefits).
(iii) The largest significant differences are observed for increased use of machinery and equipment and improvement of the firms image on the market. The advanced innovators stand out on these two dimensions.
(iv) The highest observed value in the table is for an intangible benefit, namely improvement of the firms image (6.44 on a scale of 7).
4.4 Relative importance of benefits for firms with different levels of technological penetration
To obtain a more manageable number of orthogonal factors, a varimax rotated factor analysis (table 4) was conducted on the 24 variables listed in table 3. The relative importance of these factors according to the three levels of technological penetration was then established (table 5).
All loadings greater than .60 were considered as statistically significant (table 4). Six factors accounting for 69.4% of the variance in the sample are presented in decreasing order of importance:
(i) The first factor corresponds to the interface between the firm and its customers: offering a wide variety of products (both new and customized) and improving its image (Customization);
(ii) The second factor is related to quality. The firm is improving the quality of its products and the level of conformance to a specific design (Quality); (iii) The third factor clearly represents cost reduction: production costs and product
costs (Cost reduction);
(iv) The fourth factor refers to the pursuit of a particular level of effectiveness by rationalizing space, inventory levels, use of machinery and capital investment (Effectiveness);
(v) The fifth factor captures the increase in productivity of indirect manpower. The introduction of computer-based applications seems to have an effect on workers
not directly involved in the production process (Productivity of non-production workers);
(vi) The last factor is the decrease in set up time. This factor reflects the importance of building a certain level of flexibility into the process system in order to react rapidly to changes in volume, new customers requirements or the introduction of new products (Flexibility).
Each of these factors represents a particular dimension of the benefits derived from the adoption of computer-based applications (both administrative and production). They are partially a reflection of the firms existing strength. However, the competitive priorities pursued by each firm over the long run may be different. Furthermore, there are several different computer-based applications to choose from in order to achieve a specific goal (for example, quality or cost reduction).
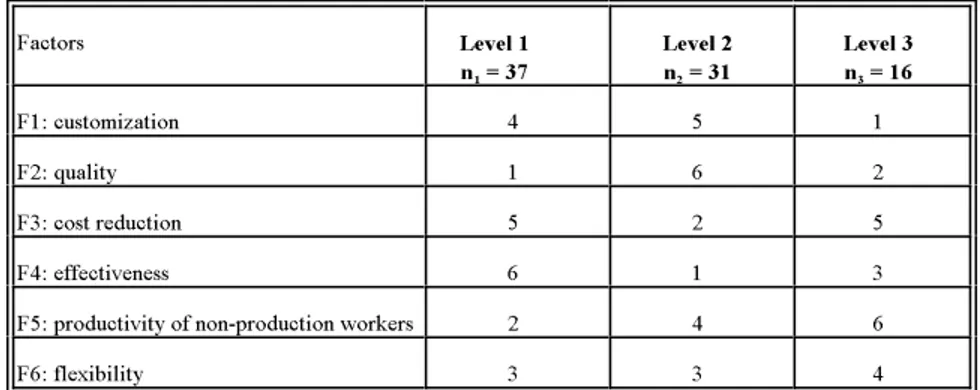
In order to substantiate our premises that benefits should follow an evolutionary pattern as SMEs level of technological experience increases, the six factors were ranked in decreasing order of their mean value. The results presented in table 5 show three very different rankings for the relative importance of the factors according to the level of technological penetration. In fact, there is almost total disagreement between the three groups of firms (p = 0.9822 for Kendalls test where p = 1 indicates complete disagreement). Factors Level 1 n = 371 Level 2 n = 312 Level 3 n = 163 F1: customization 4 5 1 F2: quality 1 6 2 F3: cost reduction 5 2 5 F4: effectiveness 6 1 3
F5: productivity of non-production workers 2 4 6
F6: flexibility 3 3 4
Kendalls test: Kendalls tau = 0.0476, P = 0.7143, degrees of freedom = 5, p = 0.9822
(1) 2
Table 5 The relative importance of factors according to the three levels of technological penetration1
(n = 84)
In the case of the level 1 group (laggards), we find that the benefits derived from their computer-based applications in decreasing order are: (1) quality, (2) productivity of
non-production workers and (3) flexibility. Keeping in mind that the level 1 group has the lowest score for both computer-based production and administrative applications and displays the lowest values for most benefits, those results are not very surprising. Indeed, these competitive strengths, in particular quality and productivity, do not necessarily require sophisticated computer-based applications. Quality programs (of a more managerial nature) could account for these results. As they have all adopted at least one type of numerical control machine (for example, a bending machine that can keep 30 different bends in its memory), results for both reduction of set up times and consistent quality increased sharply. Basic administrative computer-based applications also considerably raised the productivity of non-production workers when automating business processes such as billings or purchases.
In the case of the level 2 group (intensive use of administrative applications), they were able to achieve benefits pertaining to (1) effectiveness, (2) cost reduction and (3) flexibility. Since, the level 2 group has a relatively low score of innovativeness for the computer-based production applications and the highest score for administrative applications, the results shown here are in accordance with the technological choices made by these firms: benefits like effectiveness and cost reduction can be achieved with a mix computerized inventory systems, managerial techniques like JIT and good housekeeping techniques. Again, flexibility is explained by the presence of numerical control machines.
The last group, level 3 (innovators) gave these factors a different ranking: (1) customization, (2) quality and (3) effectiveness. Only the level 3 group is able to reap benefits pertaining to customization which are indeed closely linked not only to more sophisticated computer-based production applications (which provide the necessary flexibility and speed to respond to customers needs) but also to the strategic advantages specific to SMEs (Meredith, 1987).
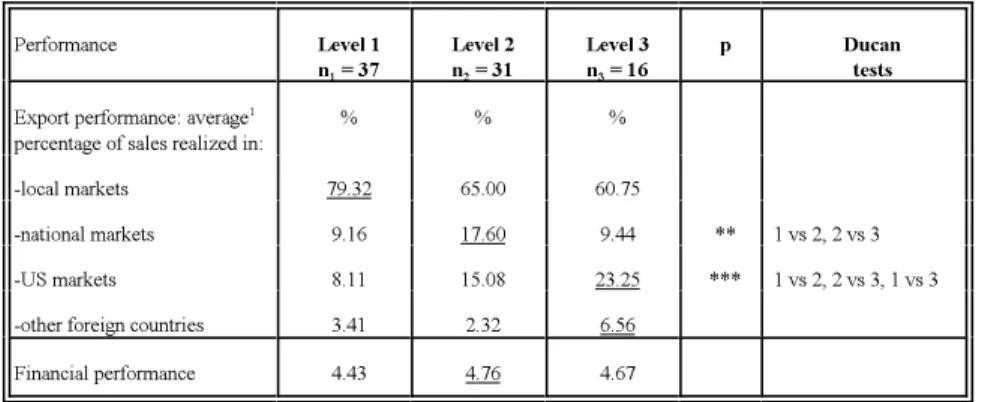
Performance Level 1 n = 371 Level 2 n = 312 Level 3 n = 163 p Ducan tests Export performance: average1
percentage of sales realized in: % % % -local markets 79.32 65.00 60.75
-national markets 9.16 17.60 9.44 ** 1 vs 2, 2 vs 3 -US markets 8.11 15.08 23.25 *** 1 vs 2, 2 vs 3, 1 vs 3 -other foreign countries 3.41 2.32 6.56
Financial performance 4.43 4.76 4.67
Factual measure
1
How do the three groups perform financially and on export markets? In the latter case, our third group, the innovators, perform best on international markets, suggesting a relationship between technological penetration and export performance. This does not, however, apply to financial performance, a possible explanation for this is that SMEs that invest more in computer-based applications must often do so at the expense of short-term profitability.
5.0 Concluding remarks
The results of our research conducted in a sample of rather homogeneous small manufacturing firms reveal significant differences in the types of benefits firms can obtain from computer-based administrative and production applications. These differences are explained not only by the type of applications introduced but also by the level of technological penetration observed in a firm, which we believe is strongly associated with a firms experience with technological applications and the synergy that may have resulted from this experience. Only those firms which demonstrate a high level of penetration for both administrative and manufacturing applications appear to be able to address issues related to product customization. This is obviously an important dimension for small firms, which usually strive for customer satisfaction. It also indicates that both types of technological applications are required for a firm to become more efficient with respect to important competitive dimensions. SMEs willing to meet the challenges of globalizing their operations seem to have prepared accordingly. Indeed those firms show the highest score for technological experience and a well balanced portfolio of production/administrative computer-based applications. Preparing for foreign markets where specifications and needs of the customers may vary from domestic markets, requires focussing on flexibility and the ability to adapt rapidly and efficiently to new specifications.
Finally, our results suggest that benefits are cumulative not only in terms of the number and scope of benefits pursued but also in terms of the actual potential derived from any one benefit. This precludes any notion of swapping and it is felt that capabilities are not built at the expense of one another.
Acknowledgements
The authors gratefully acknowledge the financial support from FCAR and SSHRC. They are also indebted to two referees for their helpful comments and to Sylvie Barrette Méthot for her meticulous typesetting work.
References
Bonaccorsi, A., On the Relationship Between Firm Size and Export Intensity, Journal of International Business Studies, Vol. 23, no. 4, pp. 605-635, 1992. Bradley, S.P., J.A. Hausman and R.L. Nolan (eds) Globalization, Technology and Competion: The Fusion of Telecommunications in the 1990s, Harvard Business School Press, 1993.
Burgelman, R.A. and R.S. Rosenbloom, Technology Strategy: An Evolutionary Process Perspective in R.S. Rosenbloom and R.A. Burgelman (eds.), Research on Technological Innovation Management and Policy, Vol. 4, JAI Press Inc., Greenwich, 1989.
Lefebvre, L.A., É. Lefebvre and J. Ducharme, Introduction and Use of Computers in Small Business: A Study of the Perceptions and Expectations of Managers, Department of Communications, Government of Canada, MCC, CWARC, DLR/6-009, Ottawa, 1989.
Mansfield, E., The Diffusion of Flexibility Manufacturing Systems in Japan, Europe and the United States, Management Science, Vol. 39, No. 2, 1993.
Meredith, J., The Strategic Advantages of New Manufacturing Technologies for Small Firms, Strategic Management Journal, Vol. 8, pp. 249-258, 1987.
Miller, J.G. and A.V. Roth, Manufacturing Strategies: Executive Summary of the 1988 North American Manufacturing Futures Survey, Manufacturing Roundtable Research Report Series, Boston University, 1988.
Moyniham, T., What Chief Executives and Senior Managers Want From Their IT Departments, MIS Quarterly, pp. 15-25, March 1990.
Naik and Chakravarty, Strategic Acquisition of New Manufacturing Technology: A Review and Research Framework, International Journal of Production Research, Vol. 30, No. 7, 1992.
Sapienza, H.J., K.G. Smith and M.J. Gannon, Using Subjective Evaluation of Organizational Performance in Small Business Research, American Journal of Small Business, Vol. 12, pp. 43-53, 1988.