Allochthonous carbon is a major
regulator to bacterial growth
and community composition in
subarctic freshwaters
Toni Roiha
1,2,*, Sari Peura
1,3,*, Mathieu Cusson
2& Milla Rautio
1,2,4,5In the subarctic region, climate warming and permafrost thaw are leading to emergence of ponds and to an increase in mobility of catchment carbon. As carbon of terrestrial origin is increasing in subarctic freshwaters the resource pool supporting their microbial communities and metabolism is changing, with consequences to overall aquatic productivity. By sampling different subarctic water bodies for a one complete year we show how terrestrial and algal carbon compounds vary in a range of freshwaters and how differential organic carbon quality is linked to bacterial metabolism and community composition. We show that terrestrial drainage and associated nutrients supported higher bacterial growth in ponds and river mouths that were influenced by fresh terrestrial carbon than in large lakes with carbon from algal production. Bacterial diversity, however, was lower at sites influenced by terrestrial carbon inputs. Bacterial community composition was highly variable among different water bodies and especially influenced by concentrations of dissolved organic carbon (DOC), fulvic acids, proteins and nutrients. Furthermore, a distinct preference was found for terrestrial vs. algal carbon among certain bacterial tribes. The results highlight the contribution of the numerous ponds to cycling of terrestrial carbon in the changing subarctic and arctic regions.
Dissolved organic matter (DOM) in the surface waters is a complex mixture of humic substances, carbohydrates, carboxylic acids, amino acids and nutrients. These compounds originate from terrestrial and aquatic production, make about 90% of the total carbon pool in the water column and are a major energy source for the aquatic food webs1. The compounds originating from aquatic primary production are usually considered to have better quality and, hence, be more biolabile than compounds with terrestrial origin. However, several recent studies have shown that some terrestrially-derived carbon compounds can promote aquatic production2,3. The ratio between terres-trial and algal DOM still has an important role in determining carbon cycling in a lake, including the productivity of algal and microbial biomasses4 and greenhouse gas (GHG) releases5. Lakes with high reliance to terrestrial DOM tend to be less productive and net heterotrophic, i.e. CO2 and CH4 sources to the atmosphere6,7 while lakes in which the food web is largely based on carbon of autochthonous origin are characterised with high levels of primary productivity making the lakes net autotrophic, i.e. CO2 sinks8. For a long time most arctic lakes were, due to the sparse catchment vegetation, considered to be only marginally influenced by allochthonous matter inputs8. However, the on-going climate warming is mobilizing terrestrial carbon pools and increasing the allochthonous carbon inputs from the catchment to surface waters worldwide9–11. Subsequently, the subarctic and arctic regions impacted by permafrost thawing are experiencing the mobilization of the Earth’s largest pool of organic carbon12 and nutrients13. There are, however, still few comprehensive studies examining organic carbon pools and asso-ciated microbial metabolism and bacterial communities in northern freshwaters although these environments constitute an integral component in the catchment-water-climate continuum.
1Department of Biological and Environmental Science, University of Jyväskylä, Jyväskylä, Finland. 2Département des sciences fondamentales, Université du Québec à Chicoutimi, Chicoutimi, Quebec, Canada. 3Department of Ecology and Genetics, Limnology, Uppsala University, Uppsala, Sweden. 4Centre for Northern Studies (CEN), Laval University, Quebec City, Quebec, Canada.5Group for Interuniversity Research in Limnology and aquatic environment (GRIL), University of Montreal, Montreal, Quebec, Canada. *These authors contributed equally to this work. Correspondence and requests for materials should be addressed to S.P. (email: shpeura@gmail.com)
Received: 20 May 2016 accepted: 14 September 2016 Published: 30 September 2016
Large compositional changes take place from the moment terrestrial carbon arrives to a lake and when it is mixed with algal DOM exudates and transferred to new compounds through photochemical and microbial pro-cesses14–16. Proportions of different fractions of DOM also vary across lakes and within individual water bodies due to physical factors in the environment17,18. For example, in small ponds soil carbon enters the water body by runoff along the land-water interface, while most of the terrestrial organic matter arriving to lakes is loaded through the river inlets19. This generates a spatial pattern at the landscape level in the availability of terrestrial C in morphologically different water bodies, although it has received little attention. Morphometric differences among different freshwaters are especially pronounced and changing in the northern environments where thawing per-mafrost is at an accelerated rate promoting the formation of shallow ponds. They have become increasingly abun-dant in the circumpolar north, representing up to 90% of all freshwater in some regions12. Growing attention has been given to these new ponds after recognizing the cumulative effect of their high abundance and greenhouse gas (GHG) emissions on global warming20,21 while little is known about organic carbon differences among north-ern ponds, lakes and rivers. Morphometric differences between water bodies influence photo exposure, residence time, velocity and primary production, all of which contribute to defining DOM. The water column depth plays a critical role as photochemical processes in shallow euphotic zones make DOM more bioavailable to bacteria com-pared to DOM in the dark16. The efficiency of DOM transformations also decreases as organic matter ages22 mak-ing the sites that are physically close to the terrestrial source first and mostly influenced by allochthonous carbon. For instance, in large lakes the long distance to the shore dilutes the influence of terrestrial DOM to food webs23.
Since the DOM composition changes depending on the catchment-lake coupling and among morphologically different lakes24, we can reasonably expect that heterogeneity in the various C sources among ponds, lakes and rivers may lead to variability in the composition of organisms capable of using different carbon sources. Variable microbial communities mediate the immediate carbon sequestration processes of the arriving fresh allochtho-nous carbon, are involved in its cycling and uptake to the food web, and contribute to respiration that removes terrestrial carbon from the water body via atmospheric emissions. Proteins and amino acids from algal exudates are being readily utilized by bacteria25, while the recalcitrant compounds in humic substances, such as lignin, can be degraded only by more specialized groups26. Still, water masses dominated by recalcitrant humic compounds may facilitate high rates of microbial metabolism in favourable conditions. The evidence of a priming effect of high quality carbon in freshwaters is still conflicting27, but algal exudates have been suggested to act as a primer for the consumption of the recalcitrant carbon pool28. Such complex biochemical processes need to be consid-ered when establishing causalities between DOM composition and bacterial metabolism, and may largely vary among morphologically different water bodies. Nevertheless, the variation in carbon quality shapes the bacteria residing in lakes and it has been shown that bacterial community composition (BCC) and metabolism are linked to the source29–32 and quality of the carbon found in a lake33–35. Further, it has been shown that the composition of bacterial community plays a significant role in the rate of carbon mineralization36. While bacteria are processing DOM, some compounds are produced, while others get degraded14,15. Thus, bacteria are influenced by the DOM milieu, but also contribute to defining the quality and quantity of carbon in lakes.
In this paper, we investigate the importance of terrestrially-derived DOM (t-DOM) to bacteria in the changing subarctic region. Our objective is to estimate how climate-warming induced increase in t-DOM is influencing subarctic aquatic microbiome. Our expectation was that the relative proportion of t-DOM in subarctic freshwa-ters is the greatest in small and shallow water bodies that are the dominant lake type in the subarctic and arctic regions, and increasing in numbers37, while pelagic waters of large lakes would be less influenced by t-DOM and would be characterised by the DOM fraction that originates from within lake primary production. Further, we expected that differences in the amount of t-DOM and algal exudates would lead to different metabolic rates, measured as bacterial production, respiration and growth efficiency. We also anticipated the bacterial community composition to be adapted to different substrata and, thus, to vary along the range of t-DOM exposure (i.e. among morphologically different types of water bodies). To study these questions, we sampled lake inlets representing sites that should be influenced by fresh allochthonous carbon arriving to lakes, outlets of large lakes i.e. sites that integrate carbon from in-lake pelagic and near-shore benthic algal production, and ponds that are exposed to high loads of t-DOM due to their small shoreline-area ratio and at the same time to high overall primary pro-duction due to the illuminated total water column and benthos38, and that should contain carbon with a mixed signature of terrestrial and algal compounds. We further discuss the potential impact of the increasing number of shallow ponds on the carbon pools and microbiome of subarctic and arctic freshwater ecosystems. All sites were monitored in five different seasons and bacterial metabolism and community composition were analyzed in relation to DOM quality (carbon compounds, spectrophotometric properties, nutrients).
Materials and Methods
Study site and sampling.
We sampled lake inlets, lake outlets and ponds in the Kilpisjärvi region, subarctic Finnish Lapland (69 ⚬N, 20 ⚬E), with catchments extending to Sweden and Norway, for one complete year and collected a data set that was based on 45 site visits. The sites were located at an altitude between 472 and 850 m a.s.l. in the subarctic landscape where treeline, mainly mountain birch (Betula pubescens subsp. czerepanovii), is at 600 m a.s.l. Apart from the birch, vegetation mainly consists of low dwarf shrubs, mosses, grasses and sedges, with a low occurrence of wetlands (about 10%). The ponds sampled (11, 12 and 15, as in Rautio39) had a mean depth of 4 m, area of 0.9 ha and a catchment of 42 ha. The inlets (Lakes Saanajärvi, Tsahkaljärvi and Kilpisjärvi) collected runoff along a mean distance of 2100 m and the outlets integrated water from lakes with a mean depth of 35 m and a lake area of 1294 ha. More detailed characterization of the individual water bodies presented in Supplementary Table 1. Each site was sampled five times in 2011; in February (winter), in early May (spring), in mid-June just after the ice break up (ice break up), in late July (summer) and in early October (fall). Ponds were sampled in the middle of the pond and the lakes were sampled from near the inlets and outlets. Samples were col-lected with a 2 L Limnos water sampler (Limnos ltd, Turku, Finland) as integrated samples from the first meter ofthe water column. Water temperature was measured in the field with YSI Professional Plus (Yellow Springs, OH, USA). Total phosphorus (TP) and total nitrogen (TN) concentrations were analysed from sieved (50 μ m) water using standard methods (http://www.sfs.fi/). For the determination of chlorophyll a (Chl-a) concentrations, 1–2 L was filtered onto GF/F filters. Samples were collected in duplicate and stored at − 80 °C until fluorometric analysis was carried out according to Nusch40. Dissolved organic carbon (DOC) concentration was analysed from water filtered through 0.2 μ m prerinsed cellulose acetate filter using Shimadzu TOC-5000A carbon analyser.
DOM quality.
A set of carbon quality indicators was measured using spectrophotometric and spectrofluo-rometric methods. All the measurements were carried out for water that had been filtered through a 0.2 μ m prerinsed cellulose acetate filter and stored in the dark at + 4 °C. Absorption coefficient at 320 nm (a320), spe-cific UV-absorbance index (SUVA) and the spectral slope (S289) were measured in a dual-beam mode with Cary 100 UV-Vis spectrophotometer (Agilent) using a 10-cm quartz cuvette. Baseline correction was done with MilliQ-water. Absorption coefficient at 320 nm (a320) was measured as an indicator of total concentration of coloured dissolved organic carbon (CDOM320). Values were calculated from absorbance measurements (Aλ) at 320 using aλ = 2.303/L × A, where L is the length of the cuvette in meters41. SUVA, which is an indicator of the share of terrestrially derived organic carbon18,42, was calculated from DOC-normalized absorbance at the wavelength 254 nm with higher values indicating a higher share of terrestrial carbon compounds in the sample43. S289, indicating the amount of carbon compounds related to lignin-free algal production44, was calculated from the spectrophotometric measurements between 279–299 nm. Slopes were calculated over 20 nm intervals with a 1 nm step (i.e., 250–269, 251–270, etc.). The resulting set of spectral slopes was plotted by center wavelengths. Calculations were performed in open-source software package SciLab 4.15. The individual spectral slope S289 was used to evaluate the amount of autochthonous compounds related to autochthonous production. Algal derived lignin-free carbon has its maximum absorbance close to 289 nm44–46 thus the higher the S289 values the bigger is the share of carbon compounds from autochthonous production. There are some environmental factors that could have compromised the fluorometric measurements, most importantly iron and pH. According to previous meas-urements of the lakes in the area the iron concentration is low (mean of 37 lakes 0.24 mg L−1)47 and not likely to cause a bias. Also, the pH was stable within the samples (6.5 ± 0.5) and should not interfere with the measurements. Thus, we are confident that our measurements were reliable and showing the true variation in carbon quality.Composition of different humic, fulvic and protein-like carbon compounds was identified with excitation-emission matrixes (EEM) using a spectrofluorometer Cary eclipse (Agilent). Those were measured across excitation (220–450 nm) and emission (240–600 nm) wavelengths with 5 and 2 nm increments, respectively. EEMs were corrected for inner filter effect48, machine specific biases, background scattering49 and were standardized to Raman units (R.U.)50. Raman and Rayleigh scattering were removed using the DOMfluor 1.7 toolbox in MATLAB 2008b (MathWorks, Natick, MA, USA) as recommended by Stedmon and Bro51. The obtained EEMs were inserted to the parallel factor analysis (PARAFAC) model based on samples collected from > 100 lakes from boreal, subarctic and arctic lakes from Finland, Canada and Greenland (data not shown). The model was used to identify and calculate intensities of all main carbon components in the samples. Five different compo-nents (C1-C4, C6) identified from the EEMs were highly correlated with each other (correlation coefficients for all pairs > 0.87, p < 0.0001) and were pooled for the analyses as terrestrial humic-like compounds, while the component C5 was considered as a fulvic acid and the component C7 as a protein, according to Fellman et al.52. The compounds C1-C4 and C6 are widespread terrestrial humic-like components originating e.g. from forest streams and wetlands52 (and references therein). The C5 compound has been associated with irradiated DOM that has been microbially degraded53. C7 resembles amino acid-like tryptophan found commonly in dif-ferent freshwater environments52.
Bacterial metabolism analyses.
Bacteria production (BP) was measured using 3H-leucine (specific activity 73 Ci mmol−1) incorporation with a centrifugation method54. Incubations were started within 2–6 hours after sampling using a leucine concentration of 30 nM and incubation time of 3 h according to the saturation curves in Roiha et al.35. Incubations were conducted in the dark in 6.4 ± 0.5 °C temperature. The difference to the in-situ field temperatures was 5.1 ± 2.1 °C. TCA was added to terminate incubation (TCA; 5% final concentration) after which the samples were stored at − 20 °C until centrifuging and radioassaying according to Smith and Azam54. Bacterial respiration (BR) was measured as oxygen (O2) consumption using fibre-optic O2 mini-sensors (Fibox 3, PreSens Precision Sensing GmbH, Regensburg, Germany)55. Filtered (3 μ m pore size) water samples were incu-bated in headspace-free 500 ml Erlenmeyer vials closed with airtight silicone stopper. Samples were incuincu-bated as above but in a water bath to further reduce temperature variability, which could interfere with O2 sensor reading. The incubations were let to stabilize for a few hours before the first sensor reading. Over the first five days O2 concentrations were measured 1–2 times a day while the last measurement was taken at the beginning of the next sampling (total incubation time 4–6 weeks). BR rates were calculated from the linear slope of O2 consumption that was converted to carbon units using respiratory quotient (RQ) of 1.0 as in Berggren et al.56. To estimate actual bacterial metabolism in the sampled sites, the BP and BR values were corrected for in-situ temperatures with Q10 values according to Berggren et al.57. Such corrections were not applied when the aim was to measure temperature-independent bacterial control. Bacterial growth efficiency (BGE), i.e. bacterial production (BP) per unit of assimilated carbon was calculated using equation 1.= +
BGE BP BP/( BR) (1)
Bacterial community analyses.
Unfiltered water samples for DNA extraction were frozen within 2–4 hours of sampling. A subsample of 300 ml frozen water was freeze dried with an Alpha 1–4 LD plus (Christ, Osterode, Germany). DNA extraction, PCR (primers 341F (5′ -CCTACGGGNGGCWGCAG-3′ ) and 805R(5′ -GACTACHVGGGTATCTAATCC-3′ )58) and 454-pyrosequencing were performed as described in Peura et al.59. The amplicon processing, including quality trimming and noise and chimera removal, was done as out-lined in Schloss et al.60 using Mothur61. The sequences were assigned into operational taxonomic units (OTUs) using 97% sequence similarity cutoff, loosely corresponding to bacterial species and OTUs were classified using taxonomic framework for freshwater bacteria introduced by Newton et al.62. Two samples with likely fecal con-tamination were removed from the sample set. Prior to statistical testing, the sequence data was resampled to the smallest sample size (1153 sequences per sample) using perl script daisychopper.pl (available at http://www. genomics.ceh.ac.uk/GeneSwytch/Tools. Html63). The sequences are available at the NCBI Sequence Read Archive under project number PRNA244724.
Statistical analysis.
Differences in t-DOM variables and temperature-corrected bacterial metabolism among sites were tested using 2-way ANOVAs. Site and season were considered as fixed factors in the analysis. Normality and homogeneity of variance were checked with visual examination of residuals64. Square root trans-formations were applied to TN and Chl-a, logarithmic (base 10) transtrans-formations to a320, fulvic acids, BP and BR, and inverse (x−1) transformation to S289 to achieve ANOVA assumptions. When a factor was significant, a post hoc multiple comparison test (Tukey-Kramer) was carried out to identify differences. For the statistical testing of the BCC, all OTUs with more than 100 sequences in the resampled data were retained in the analysis. Pielou’s index was used to evaluate the evenness of the community in different sites, that is, how evenly the observations were distributed among OTUs65. To measure the diversity, we used inverse Simpson’s index66. Permutational Multivariate analysis of variance (PERMANOVA67) with 999 permutations was used to examine the impact of site to the bacterial community structure. Bacterial data were square root transformed prior to generating a resem-blance matrix of Bray-Curtis similarities. Pairwise permutation t-tests were performed on the factors that were identified as significant in PERMANOVA to identify differences among sites. Multiple regression analyses were used to identify which DOM variables (TN, Chl-a, DOC, SUVA, S289, humic acids, fulvic acids and proteins) best explained the changes in bacterial metabolism (BP, BR, and BGE). The absorption coefficient a320 was omit-ted from the model due to its high Pearson correlation with DOC (r = 0.85) and humic acids (r = 0.96). TP was omitted due to its high correlation with TN (r = 0.88). Best model (using forward procedure) was selected accord-ing to the lowest value of Aikaike Information Criterion (AICc) index. Spearman’s rank correlations were used to examine relationships between the resemblance matrices of BCC and environmental variables to identify the environmental variables (alone or in subset) that best explain the observed patterns of BCC (BIO-ENV analyses, PRIMER). For this analysis, OTU and environmental variable matrices were constructed using Bray-Curtis dissimilarity (square-root transformed) and Euclidean distances respectively68,69. Diversity indices and rela-tionships between BCC and carbon components were analysed with Spearman’s rank correlation in R70. The soft-ware JMP (JMP®
, Version 10.0. SAS Institute Inc., Cary, NC, 1989–2012) was used for all univariate tests while PRIMER + PERMANOVA (version 6.1.667,71) was used for multivariate analyses. A threshold of significance of 0.05 was adopted for all statistical tests.Results
Expression of t-DOM in subarctic freshwaters.
Many of the environmental variables had varia-tion following the a priori assumpvaria-tion of differences in the t-DOM exposure among different sampling sites. Concentrations for DOC (F2,29 = 5.10, p = 0.0127), proteins (F2,27 = 9.87, p = 0.0006), total phosphorus (TP) (F2,29 = 12.88, p < 0.0001), and total nitrogen (TN) (F2,29 = 10.83, p = 0.0003), were significantly different among sites and highest in the ponds and lowest in the outlets (Table 1). Similarly, the total amount of coloured DOM (CDOM320) and the fluorescence of humic-like compounds (indicator of the share of terrestrial carbon in the CDOM) were lowest in the outlets, though this difference was not significant. S289, an indicator of algal carbon availability, was always significantly higher in the outlets (F2,27 = 50.17, p < 0.0001) than in the other sites while chlorophyll a (Chl-a), another indicator of algal carbon, was equally low in all samples (< 1 μ g L−1) (Table 1).Bacterial metabolism and community composition.
The ponds and inlets provided an environment that supported higher BP and BGE than the outlets while there was less variation in BR among different sampling sites (Fig. 1). In all sites bacterial metabolism exhibited large seasonal variation (with all p-values < 0.05 for season factor) with some differences between the sites (Fig. 1). Highest BP values were measured for the ponds (4.5 μ g C L−1 d−1 ± 3.9) and inlets (1.5 μ g C L−1 d−1 ± 0.8) during the ice breakup while the maximum BP in the outlets (1.0 μ g C L−1 d−1 ± 0.5) was reached in summer. The BP was lowest in the fall in all sites with values < 1 μ g C L−1 d−1. BR followed a different seasonal pattern, with the highest values measured in the ponds in the spring (20.7 μ g C L−1 d−1 ± 4.4) and the lowest in the inlets in the summer (3.2 μ g C L−1 d−1 ± 1.2). BGE was rather low and the maximum values, 20–39%, were reached in the summer.The sites also differed in bacterial community composition. The diversity in the inlets and outlets was higher (Inverse Simpson index) (χ 2 = 11.97, p < 0.005) than in the ponds but there was no difference in the evenness (Pielou’s Index) of the communities across sites (Table 2). However, there was a clear change in the community structure among the sampled sites (Pseudo-F2,22 = 5.76, p < 0.001). The pond communities were more similar to the inlet communities (pair-wise test t = 1.77, p = 0.019) than to the outlet communities (t = 3.76, p < 0.001), but also the inlet and outlet communities were distinct from each other (t = 1.61, p = 0.037). The ponds and inlets had only a few, but very abundant OTUs, while the outlets harbored many low abundance OTUs (Fig. 2). There was also a separation in taxa distribution between ponds and lake habitats with taxa such as Betaproteobacteria (tribes PnecC (OTU 10973), Lhab-A2 (OTU10878)) and Bacteroidetes (clade bacIII-A (OTU 10854)) being more typical for ponds, while inlets and outlets had a higher abundance of Actinobacteria (tribe Myco (OTU 10771) and clade acI-A (OTU 10977)), Verrucomicrobia (OTU 10891) and Alphaproteobacteria (tribe LD12 (OTU 10100)) (Fig. 2).
Site Season Temp (°C) TP (μg L-1) TN (μg L-1) Chl-a (μg L-1) DOC (mg L-1) a320 (mgC L-1 m-1)SUVA254 S289 Humic (R.U.) Fulvic (R.U.) Protein (R.U.) Pond W 0.1 8.0 350 0.51 3.9 19.8 3.8 0.0099 0.7031 0.0075 0.7342 Inlet W 0.1 6.0 174 0.11 2.8 6.6 2.6 0.0173 0.6848 0.0562 0.2815 Outlet W 0.3 5.3 132 0.09 2.3 4.7 2.4 0.0190 0.4871 0.0538 0.3247 Pond S 0.1 10.0 381 0.22 4.6 9.1 1.7 0.0132 0.9431 0.0872 0.6349 Inlet S 0.4 6.6 218 0.16 2.6 6.5 2.6 0.0156 0.6465 0.0660 0.3547 Outlet S 0.5 5.7 198 0.19 2.2 4.9 2.4 0.0197 0.4904 0.0531 0.3384 Pond I 12.0 6.7 144 0.18 2.8 6.9 2.5 0.0152 0.7339 0.1115 0.3966 Inlet I 10.2 5.7 116 0.29 2.5 7.7 3.2 0.0151 0.8036 0.0344 0.2771 Outlet I 6.3 5.7 137 0.34 2.3 5.9 2.7 0.0173 0.5803 0.0491 0.2783 Pond Su 14.4 5.7 136 0.16 2.9 7.4 2.6 0.0154 0.8631 0.0736 0.3374 Inlet Su 13.6 5.3 145 0.20 2.6 6.7 2.7 0.0155 0.7303 0.0339 0.2924 Outlet Su 13.1 5.0 120 0.19 2.4 5.1 2.3 0.0185 0.4702 0.0702 0.3134 Pond F 0.5 6.0 136 0.25 2.5 6.9 2.7 0.0147 0.6996 0.0354 0.2542 Inlet F 2.4 5.7 139 0.22 2.0 5.8 3.0 0.0155 0.6121 0.0588 0.3253 Outlet F 4.9 5.0 121 0.54 2.2 6.2 2.4 0.0187 0.4333 0.0569 0.2652 Pond All 5.4 a 7.3 a 229 a 0.27 a 3.2 a 10.0 a 2.7 a 0.0137 a 0.7886 a 0.0630 a 0.4715 a Inlet All 5.4 a 5.9 b 158 b 0.18 a 2.4 ab 6.7 a 2.7 a 0.0158 ab 0.6955 a 0.0499 a 0.3062 b Outlet All 5.0 a 5.3 b 142 b 0.27 a 2.3 b 5.4 a 2.4 a 0.0186 b 0.2461 a 0.0566 a 0.3040 b Table 1. Mean values of temperature, total phosphorus (TP), total nitrogen (TN), chlorophyll-a (chl-a), dissolved organic carbon (DOC), specific UV-absorbance index (SUVA254), absorption at 320 nm (a320),
spectral slope at 289 nm (S289) and fluorescence intensity of humic, fulvic and protein compounds of DOC in Raman units (R.U) for the three different water pools. Data are shown for five seasons in 2011: winter (W),
spring (S), ice break (I), summer (Su), and fall (F) as well as for the entire year (All). The letters (for All) indicate statistical differences between sites.
Figure 1. Mean yearly bacterial metabolism ± SE for ponds, inlets and outlets measured as (a) bacterial
production (BP), (b) bacteria respiration (BR) and (c) bacterial growth efficiency (BGE). W = winter, S = spring, I = ice breakup, Su = summer and F = fall. The letters indicate statistical differences among sites.
The control of subarctic freshwater microbiome by t-DOM.
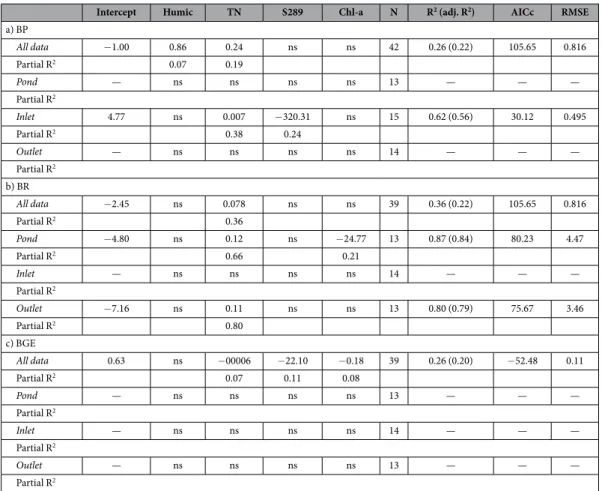
Multiple regression models were con-structed to assess the importance of each DOM variable that was confirmed to have a significant impact on the BP, BR and BGE. The models explained up to 62% of the variance in BP, 87% in BR and 26% in BGE (Table 3). Overall, TN explained the largest share of the bacterial metabolism (on average 45%), but there was a lot of var-iation between sites and processes. The highest explanatory degree was acquired from the BR in ponds, where concentrations of TN and Chl-a explained 66 and 21% of the variation, respectively.The BIO-ENV analyses suggested that DOM variables that best explained the OTU distribution among sites were TP, DOC, fulvic acids and proteins (Table 4). The proteins represent readily available amino acid-like frac-tion of DOM and they were the carbon compounds that best captured most of the variability. The Spearman correlations further suggested connections between certain bacterial groups and carbon fractions (Fig. 3). For example, most OTUs associated with flavobacterial tribe Flavo-A3 were positively correlated with humic fraction and SUVA-index, both of which indicate the share of terrestrial DOC. Also all OTUs associated with betapro-teobacterial tribe Janb had positive correlation with SUVA. S289, an indicator for algal carbon, had correlations for example to alphaproteobacterial lineage LD12, betaproteobacterial LD28 and verrucomicrobial LD19. The protein fraction appeared to favor only a few OTUs and all of the protein correlations were weak.
Discussion
Microbiological properties of the sites reflected the large variations in DOM characteristics in subarctic freshwa-ters, ranging from sites heavily exposed to fresh terrestrial carbon inputs to sites only receiving processed, recalci-trant terrestrial DOM. Shallow ponds that were abundant in nutrients, t-DOM and algal exudates favoured high microbial productivity but supported low microbial diversity. At the same time the nutrient- and humic-poor lake outlets that were least exposed to t-DOM had low bacterial metabolism but a diverse community with high number of OTUs. The fact that t-DOM associated nutrients and carbon compounds were driving the metabolism and BCC indicate that ponds are hotspots in processing and sequestering terrestrial carbon. Considering the increase in number of ponds and loads of terrestrial carbon9–11 and our finding of lower bacterial diversity in ponds, changes in the GHG emissions to the atmosphere and in the biodiversity of the subarctic and arctic biomes may be expected.
Concentrations of DOC, different CDOM compounds and nutrients were highest in the ponds, most likely due to their high perimeter to volume ratio that facilitated high inputs of OM from the catchment7,38. The con-centrations were especially elevated under the ice in winter and spring (on average 9.2 μ g L−1 TP, 337 μ g L−1 TN, 4.3 mg L−1 DOC and 0.8231 R.U. for humic compounds) when they were 19–42% higher than inlet values and 40–51% higher than in the outlets. The high under ice values likely resulted from a combination of
Site Inverse Simpson Pielous Index
Pond 6.2 ± 4.2 0.45 ± 0.07 Inlet 16.4 ± 10.0 0.47 ± 0.07 Outlet 18.6 ± 7.9 0.49 ± 0.03
Table 2. Shannon and Inverse Simpson indices (±SE) for different sites.
Figure 2. Ternary plot showing the distribution of OTUs between the habitats. Axes represent the pond,
inlet and outlet and the percentage of reads associated with each environment. The size of the symbol indicates number of reads associated with each OTU and taxonomic affiliations are indicated by colors. All OTUs with at least 20 reads were included into the plot.
microbial-derived dissolved compounds and out-freezing inputs associated with formation of ice. The latter one impacts especially small water bodies and may partly explain the higher values in ponds. Similar under ice accu-mulation of DOM in subarctic ponds and lakes has also been reported previously7,72. In other seasons the t-DOM and associated compounds were on average 8 and 19% higher in the ponds than in the inlets and outlets, respec-tively. In general, higher concentrations of compounds are typical for small subarctic water bodies due to a high perimeter to area ratio and lack of dilution effect of large lakes. Thus, the highest terrestrial impact to the carbon quality was in the ponds. In addition to terrestrial production, the humic fraction could also originate from in situ production by microbes73, but based on low values of S289 observed, it can be assumed that the contribution of fulvic and humic compounds from autochthonous production was minor44.
We used S289 and proteins as proxies of the aromatic content of CDOM and the relative importance of autoch-thonous (algal) carbon sources. Changes in spectral slope of DOM samples are due a number of processes, includ-ing photo and microbial degradation, mixinclud-ing and production of low molecular weight CDOM. High values close to S289 have earlier been identified in different phytoplankton monocultures and used as an index of autochtho-nous DOM44–46. Consistent with our hypothesis and Jonsson et al.74, carbon in the lake outlets was characterized
Intercept Humic TN S289 Chl-a N R2 (adj. R2) AICc RMSE
a) BP All data − 1.00 0.86 0.24 ns ns 42 0.26 (0.22) 105.65 0.816 Partial R2 0.07 0.19 Pond — ns ns ns ns 13 — — — Partial R2 Inlet 4.77 ns 0.007 − 320.31 ns 15 0.62 (0.56) 30.12 0.495 Partial R2 0.38 0.24 Outlet — ns ns ns ns 14 — — — Partial R2 b) BR All data − 2.45 ns 0.078 ns ns 39 0.36 (0.22) 105.65 0.816 Partial R2 0.36 Pond − 4.80 ns 0.12 ns − 24.77 13 0.87 (0.84) 80.23 4.47 Partial R2 0.66 0.21 Inlet — ns ns ns ns 14 — — — Partial R2 Outlet − 7.16 ns 0.11 ns ns 13 0.80 (0.79) 75.67 3.46 Partial R2 0.80 c) BGE All data 0.63 ns − 00006 − 22.10 − 0.18 39 0.26 (0.20) − 52.48 0.11 Partial R2 0.07 0.11 0.08 Pond — ns ns ns ns 13 — — — Partial R2 Inlet — ns ns ns ns 14 — — — Partial R2 Outlet — ns ns ns ns 13 — — — Partial R2
Table 3. Results of different multiple linear regression models (based on lowest AICc) to estimate a) bacterial production (BP), b) bacteria respiration (BR) and c) bacteria growth efficiency (BGE) for all data and for ponds, inlets and outlets separately. Humic acids (Humic), total nitrogen (TN), spectral slope at
289 nm (S289) and chlorohyll-a (Chl-a) were the variables used in the regression models (only significant values are listed). ns: not significant. Partial R2 below each regression coefficient, N = number of data included, total R2 (adjusted R2), small sample size–corrected AICc Index and root mean square errors (RMSE) are shown.
k Best variable combinations (ρs)
1 Protein (0.42) DOC (0.38) TN (0.35) TP (0.34)
3 TP, fulvic, protein (0.54)
4 TP, DOC, fulvic, protein (0.57) TP, humic, fulvic, protein (0.55) TP, S289, fulvic, protein (0.54)
5 TP, DOC, S289, fulvic, protein (0.56) TP, DOC, humic, fulvic, protein (0.56) TP, DOC, SUVA, fulvic, protein (0.55) TP, S289, humic, fulvic, protein (0.57) Table 4. Combinations of environmental variables (TP, TN, DOC, Chl-a, S289, SUVA, humic, fulvic and protein), taken k at a time, giving the four best variables alone and the largest rank correlation ρs between
by highest values of S289 (annual average 0.0186 versus 0.0137 for ponds and 0.0158 for inlets) suggesting impor-tant algal contribution to the DOM pool in outlets. The measured lake outlet S289 values were also very close to the values recently measured for other subarctic lakes in the same region46. Also the fact that proteins were higher in the outlets than in the inlets supports strong algal impact on the outlet DOM, as the main producers of amino acids (proteins) in lakes is phytoplankton25,75. Thus, primary production was a major contributor to the DOM pool in the outlets. These labile fractions of CDOM showed seasonal variability in ponds where the algal exudates were low under ice according to the S289 values (0.0099 under the ice vs 0.0151 in summer). Proteins, however, were rich under the ice in ponds, most likely resulting from bacterial degradation of autochthonous material15,76 rather than from algal activity. We propose the same causality for the seasonally similar values in S289 and pro-teins in inlets and outlets. Hence, they likely resulted from a combination of algal leachates during the growing season and from the bacterial degradation of phytoplankton and other POM in winter, reflecting the 8 months of ice cover in the studied sites when degradation dominates over production72.
Bacteria production rates in open water period were in the lower range reported for subarctic and arctic ponds and lakes77, but with values similar to a few years earlier in the same region35. The water bodies in the studied area are also more nutrient-poor than most other subarctic lakes78, likely contributing to the lower BP rates79. Variation in the concentration of different carbon fractions across sites suggested that BP and BGE in ponds were supported by high concentrations of nutrients, humic acids and proteins. Accordingly, multiple linear regression models indicated that, in accordance with previous studies80–82, the strongest factor controlling bacterial metab-olism was TN concentration. TP also likely controlled bacterial metabmetab-olism, however, due to its high correlation with TN (r = 0.88), TP was excluded from the model. Concentration and composition of organic carbon have also been suggested to be key factors regulating BGE and BP35,83,84. However, we did not see any link between DOC concentration and BP, but in contrast, the humic fraction of DOM had a positive impact on BP. Many compounds
Figure 3. Heatmap visualizing the Spearman correlations between abundances of OTUs and concentrations of different fractions of CDOM.
in the humic fraction of DOC are regarded as recalcitrant to bacterial degradation26 and reported to support lower BP than the non-humic fraction of DOC85. However, humic compounds are also highly sensitive to photo-degradation16,53,86, which generates products that enhance bacterial metabolism87. The occurrence of humic-like substances was highest during the ice break up in June when also the intensity of solar radiation increased in the water column after the dark winter and was at its annual maximum. Thus, photodegradation of humic com-pounds likely contributed to the observed increase in BP, and more so in the shallow ponds and inlets than in the outlets. Further, some low molecular weight molecules of t-DOM have recently been shown to be highly reactive and to support high levels of bacterial metabolisms2.
Both, DOC source30,31,88 and quality74, have been shown to impact BCC. Also here the overall composition of bacterial community was controlled by concentration and composition of carbon as well as by nutrient con-centrations. In ponds, where bacterial diversity was much lower than in other sites, carbon quality was different from the lake sites and one of the most important factors contributing to variation in BCC. We propose that the smaller bacterial diversity in the ponds results from a combination of carbon substrata dominated by t-DOM and the small size of ponds, which is known to negatively correlate with bacterial diversity89.
The combination of molecular microbiology and chemical analyses enabled us to link certain bacterial tribes to carbon fractions across habitats. Our environmental data corroborates experimental results suggesting that members of tribe Lhab have a preference to algal carbon over terrestrial carbon32. Another interesting link was seen between two indicators of terrestrial carbon (humic fraction and SUVA) and OTUs associated with fla-vobacterial tribe Flavo-A3. Bacteria associated with this group have previously been suggested to benefit from phytoplankton exudates90, which is opposite to what was observed here. However, in a review study 30% of the previous observations of tribe Flavo-A3 were from soil habitats62, suggesting that Flavo-A3 consists of at least two groups of bacteria with very distinct environmental preferences. Another group in the bacterial community that was associated with terrestrial carbon was tribe Janb. Janthinobacterium, the representative genus of tribe Janb, is described as soil bacterium62. Thus, both Flavo-A3 and Janb could be transient members in the lake community and may originate from the catchment area. There were also groups that were associated only with algal carbon. These included, for example, alphaproteobacterial tribe LD12. This tribe is a sister group of highly abundant marine cluster SAR11 and has been described as typical for freshwater habitats91. The previous reports suggest that the members of tribe LD12 are poor competitors and their abundance has previously been reported to be negatively correlated with phytoplankton92. However, it has also been shown that there is generally a lot of var-iation in substrate and environmental preferences within bacterial tribes82 and even within species93,94. Further, for LD12 specifically it has been suggested that this tribe has wide variations in environmental preferences across lakes92. Thus, it is not surprising that we see variation in preferences between the members of same tribe residing in sites that are differently exposed to t-DOM.
Conclusions
Our study demonstrates how the variability of DOM in subarctic waters is tightly connected to the exposure of the site to terrestrial organic matter inputs. This creates variation beyond what is seen within habitat-specific studies and allowed a more detailed evaluation of the consequences that increased catchment-lake coupling, currently taking place across the circumpolar North, has for aquatic ecosystems. We show that the combination of terres-trial and algal derived carbon compounds and nutrients, such as the DOM in the ponds, supported the highest BP and BGE. Thus, considering the rising number of ponds, the importance of terrestrial carbon in fueling aquatic food webs is increasing in the subarctic and arctic region. We also showed that the microbial diversity is smaller in ponds and the community composition different from other subarctic inland waters. Small water volume, short water retention time, high seasonality and terrestrial impact all likely contribute to shaping the microbiome in the ponds. This all combined implies that the increasing number of terrestrially influenced ponds in the North will modify the quality of carbon that is recycled in freshwaters towards the terrestrial fraction and at the same time possibly reduce the aquatic microbial diversity. While the surface area of individual ponds is small, their contribution to greenhouse gas emission per surface area is higher than that of larger lakes95. Further, the high bacterial metabolism and terrestrial contribution in the ponds implies that in the subarctic and arctic region the contribution of heterotrophic systems increases and the importance of autotrophic systems decreases. This could mean that there may be an increase in the carbon flow from arctic waters to the atmosphere. Thus, these ecosys-tems should be acknowledged as hot spots of increasing importance in the carbon cycling of the arctic landscape.
References
1. Tranvik, L. J. et al. Lakes and reservoirs as regulators of carbon cycling and climate. Limnol. Oceanogr. 54, 2298–2314 (2009). 2. Guillemette, F., Mccallister, S. L. & del Giorgio, P. A. Differentiating the degradation dynamics of algal and terrestrial carbon within
complex natural dissolved organic carbon in temperate lakes. J. Geophys. Res. Biogeosci. 118, 963–973 (2013).
3. Seekell, D. A. et al. The influence of dissolved organic carbon on primary production in northern lakes. Limnol. Oceanogr. 60, 1276–1285 (2015).
4. Ask, J. et al. Terrestrial organic matter and light penetration: Effects on bacterial and primary production in lakes. Limnol. Oceanogr.
54, 2034–2040 (2009).
5. Abnizova, A., Siemens, J., Langer, M. & Boike, J. Small ponds with major impact: the relevance of ponds and lakes in permafrost landscapes to carbon dioxide emissions. Global Biogeochem. Cy. 26, GB2041 (2012).
6. Karlsson, J. et al. Light limitation of nutrient-poor lake ecosystems. Nature 460, 506–509 (2009).
7. Roiha, T., Laurion, I. & Rautio, M. Carbon dynamics in highly heterotrophic subarctic thaw ponds. Biogeosciences 12, 7223–7237 (2015).
8. Jansson, M., Bergström, A. K., Blomqvist, P. & Drakare, S. Allochthonous organic carbon and phytoplankton/bacterioplankton production relationships in clearwater and humic lakes. Ecology 81, 3250–3255 (2000).
9. Frey, K. E. & Smith, L. C. Amplified carbon release from vast West Siberian peatlands by 2100. Geophys. Res. Lett. 32, 1–4 (2005). 10. Haaland, S., Hongve, D., Laudon, H., Riise, G. & Vogt, R. D. Quantifying the Drivers of the Increasing Colored Organic Matter in
11. Vonk, J. E. et al. Reviews and Syntheses: Effects of permafrost thaw on arctic aquatic ecosystems. Biogeosciences Discuss. 12, 10719–10815 (2015).
12. Vonk, J. E. et al. Activation of old carbon by erosion of coastal and subsea permafrost in Arctic Siberia. Nature 489, 137–140 (2012). 13. Wrona, F. J. et al. Climate change effects on aquatic biota, ecosystem structure and function. Ambio 35, 359–369 (2006).
14. Romera-Castillo, C., Sarmento, H., Álvarez-Salgado, X. A., Gasol, J. M. & Marrasé, C. Net production and consumption of fluorescent colored dissolved organic matter by natural bacterial assemblages growingon marine phytoplankton exudates. Appl. Environ. Microbiol. 77, 7490–7498 (2011).
15. Guillemette, F. & del Giorgio, P. A. Simultaneous consumption and production of fluorescent dissolved organic matter by lake bacterioplankton. Environ. Microbiol. 14, 1432–1443 (2012).
16. Cory, R. M., Crump, B. C., Dobkowski, J. A. & Kling, G. W. Surface exposure to sunlight stimulates CO2 release from permafrost soil carbon in the Arctic. Pro. Nat. Acad. Sci. 110, 3429–3434 (2013).
17. Berggren, M., Laudon, H. & Jansson, M. Landscape regulation of bacterial growth efficiency in boreal fresh waters. Global Biogeochem. Cycles 21, GB4002 (2007).
18. Hood, E., McKnight, D. M. & Williams, M. W. Sources and chemical quality of dissolved organic carbon (DOC) across an alpine/ subalpine ecotone, Green Lakes Valley, Colorado Front Range, United States. Wat. Resour. Res. 39, 1188 (2003).
19. Polis, G. A., Anderson, W. B. & Holt, R. D. Toward an integration of landscape and food web ecology: the dynamics of spatially subsidized food webs. Annu. Rev. Ecol. Syst. 28, 289–316 (1997).
20. Walter, K. M., Zimov, S. A., Chanton, J. P., Verbyla, D. & Chapin III, F. S. Methane bubbling from Siberian thaw lakes as a positive feedback to climate warming. Nature 443, 71–75 (2006).
21. Laurion, I. et al. Variability in greenhouse gas emissions from permafrost thaw ponds. Limnol. Oceanogr. 55, 115–133 (2010). 22. Berggren, M., Laudon, H. & Jansson, M. Aging of allochthonous organic carbon regulates bacterial production in unproductive
boreal lakes. Limnol. Oceanogr. 54, 1333–1342 (2009).
23. Hiltunen, M., Strandberg, U., Taipale, S. J. & Kankaala, P. Taxonomic identity and phytoplankton diet affect fatty acid composition of zooplankton in large lakes with differing dissolved organic carbon concentration. Limnology and Oceanography 60, 303–317 (2015).
24. Rantala, M. V. et al. Sources and controls of organic carbon in lakes across the subarctic treeline. Biogeochem. 129, 235 (2016). 25. Rosenstock, B. & Simon, M. Sources and sinks of dissolved free amino acids and protein in a large and deep mesotrophic lake.
Limnol. Oceanogr. 46, 644–654 (2001).
26. Kirk, T. K. & Farrell, R. L. Enzymatic “compustion”: The microbial degradation of lignin. Ann. Rev. Microbiol. 41, 465–501 (1987). 27. Catalán, N., Kellerman, A. M., Peter, H., Carmona, F. & Tranvik, L. J. Absence of a priming effect on dissolved organic carbon
degradation in lake water. Limnol. Oceanogr. 60, 159–168 (2015).
28. Guenet, B., Danger, M., Abbadie, L. & Lacroix, G. Priming effect: bridging the gap between terrestrial and aquatic ecology. Ecology
91, 2850–2861 (2010).
29. Wehr, J. D., Petersen, J. & Findlay, S. Influence of three contrasting detrital carbon sources on planktonic bacterial metabolism in a mesotrophic lake. Microb. Ecol. 37, 23–35 (1999).
30. Crump, B. C., Kling, G. W., Bahr, M. & Hobbie, J. E. Bacterioplankton community shifts in an arctic lake correlate with seasonal changes in organic matter source. Appl. Environ. Microbiol. 69, 2253–2268 (2003).
31. Kritzberg, E. S., Langenheder, S. & Lindström, E. S. Influence of dissolved organic matter source on lake bacterioplankton structure and function - implications for seasonal dynamics of community composition. FEMS Microbiol. Ecol. 56, 406–417 (2006). 32. Perez, M. T. & Sommaruga, R. Differential effect of algal- and soil-derived dissolved organic matter on alpine lake bacterial
community composition and activity. Limnol. Oceanogr. 51, 2527–2537 (2006).
33. Tulonen, T., Salonen, K. & Arvola, L. Effects of different molecular weight fractions of dissolved organic matter on the growth of bacteria, algae and protozoa from a highly humic lake. Hydrobiologia 229, 239–252 (1992).
34. Docherty, K. M., Young, K. C., Maurice, P. A. & Bridgham, S. D. Dissolved organic matter concentration and quality influences upon structure and function of freshwater microbial communities. Microb. Ecol. 52, 378–388 (2006).
35. Roiha, T., Tiirola, M., Cazzanelli, M. & Rautio, M. Carbon quantity defines productivity while its quality defines community composition of bacterioplankton in subarctic ponds. Aquat. Sci. 74, 513–525 (2011).
36. Strickland, M. S., Lauber, C., Fierer, N. & Bradford, M. A. Testing the functional significance of microbial community composition. Ecology 90, 441–451 (2009).
37. Grosse, G., Jones, B. & Arp, C. Thermokarst lakes, drainage, and drained basins In Treatise on Geomorphology. (eds Shroder, J., Giardino, R. & Harbor, J.) 325–353 (Academic Press, 2013).
38. Rautio, M. et al. Shallow freshwater ecosystems of the circumpolar Arctic. Écoscience 18, 204–222 (2011).
39. Rautio, M. Zooplankton assemblages related to environmental characteristics in treeline ponds in Finnish Lapland. Arctic, Antarctic and Alpine Research 33, 289–298 (2001).
40. Nusch, E. A. Comparison of different methods for chlorophyll and phaeopigment determination. Arch. Hydrobiol. Beih. 14, 14–36 (1980).
41. Mitchell, B. G., Kahru, M., Wieland, J. & Stramska, M. Determination of spectral absorption coefficients of particles, dissolved material and phytoplankton for discrete water samples In Ocean optics protocols for satellite ocean color sensor validation, Revision 4, Vol. IV, NASA/TM-2003-211621/R (eds Mueller, J. L., Fargion, G. S. & McClain, C. R.) 39–56 (Goddard Space Flight Center, Greenbelt, 2002).
42. Hood, E., Williams, M. W. & McKnight, D. M. Sources of dissolved organic matter (DOM) in a Rocky Mountain stream using chemical fractionation and stable isotopes. Biogeochem. 74, 231–255 (2005).
43. Weishaar, J. L. et al. Evaluation of specific 585 ultraviolet absorbance as an indicator of the chemical composition and reactivity of dissolved organic carbon. Environ. Sci. Technol. 37, 4702–4708 (2003).
44. Loiselle, S. A. et al. Variability in photobleaching yields and their related impacts on optical conditions in subtropical lakes. J. Photochem. Photobiol. B: Biol. 95, 129–137 (2009).
45. Loiselle, S. A. et al. Chemical and optical phototransformation of dissolved organic matter. Water Res. 46, 3197–3207 (2012). 46. Forsström, L. et al. DOM concentration, optical parameters and attenuation of solar radiation in high-latitude lakes across three
vegetation zones/catchment types. Ecoscience 22, 17–31 (2015).
47. Weckström, J., Korhola, A. & Blom, T. Diatoms as quantitative indicators of pH and water temperature in subarctic Fennoscandian lakes. Hydrobiol. 347, 171–184 (1997).
48. McKnight, D. M. et al. Spectrofluorometric characterization of dissolved organic matter for indication of precursor organic material and aromaticity. Limnol. Oceanogr. 46, 38–48 (2001).
49. Markager, S. & Vincent, W. F. Spectral light attenuation and absorption of UV and blue light in natural waters. Limnol. Oceanogr. 45, 642–650 (2000).
50. Stedmon, C. A., Markager, S. & Bro, R. Tracing dissolved organic matter in aquatic environments using a new approach to fluorescence spectroscopy. Mar. Chem. 82, 239–254 (2003).
51. Stedmon, C. A. & Bro, R. Characterizing DOM fluorescence with PARAFAC: A tutorial. Limnol. Oceanogr.: Methods 6, 572–579 (2008).
52. Fellman, J. B., Hood, E. & Spencer, R. G. M. Fluorescence spectroscopy opens new windows into dissolved organic matter dynamics in freshwater ecosystems: A review. Limnol. Oceanogr. 55, 2452–2462 (2010).
53. Stedmon, C. A. & Markager, S. Tracing the production and degradation of autochthonous fractions of DOM fluorescence analysis. Limnol. Oceanogr. 50, 1415–1426 (2005).
54. Smith, D. C. & Azam, F. A. Simple, economical method for measuring bacterial protein synthesis rates in seawater using 3H-leucine. Mar. Microb. Food Webs 6, 107–114 (1992).
55. Warkentin, M., Freese, H. M., Karsten, U. & Schumann, R. New and fast method to quantify respiration rates of bacterial and plankton communities in freshwater ecosystems by using optical oxygen sensor spots. Appl. Environ. Microbiol. 73, 6722–6729 (2007).
56. Berggren, M., Laudon, H., Haei, M., Ström, L. & Jansson, M. Efficient aquatic bacterial metabolism of dissolved low molecular-weight compounds from terrestrial sources. ISME J. 4, 408–416 (2010).
57. Berggren, M., Laudon, H., Jonsson, A. & Jansson, M. Nutrient constraints on metabolism affect the temperature regulation of aquatic bacterial growth efficiency. Microb. Ecol. 60, 894–902 (2010).
58. Herlemann, D. P. R. et al. Transitions in bacterial communities along the 2000 km salinity gradient of the Baltic Sea. ISME J. 5, 1571–1579 (2011).
59. Peura, S. et al. Distinct and diverse anaerobic bacterial communities in boreal lakes dominated by candidate division OD1. ISME J.
6, 1640–1652 (2012).
60. Schloss, P. D., Gevers, D. & Westcott, S. L. Reducing the effects of PCR amplification and sequencing artifacts on 16S rRNA-based studies. PLoS ONE 6, e27310 (2011).
61. Schloss, P. D. et al. Introducing Mothur: open- source, platform-independent, community-supported software for describing and comparing microbial communities. Appl. Environ. Microbiol. 75, 7537–7541 (2009).
62. Newton, R. J., Jones, S. E., Eiler, A., McMahon, K. D. & Bertilsson, S. A guide to the natural history of fresh- water lake bacteria. Microbiol. Mol. Biol. Rev. 75, 14–49 (2011).
63. Gilbert, J. A. et al. The seasonal structure of microbial communities in the Western English Channel. Environ. Microbiol. 11, 3132–3139 (2009).
64. Montgomery, D. C. Design and Analysis of Experiments. (John Wiley & Sons, 1991).
65. Pielou, E. C. Shannons formula as a measure of species diversity: its use and misuse. Amer. Nat. 100, 463–465 (1966). 66. Hill, M. O. Diversity and evenness: A unifying notation and its consequences. Ecology 54, 427–432 (1973).
67. Anderson, M. J., Gorley, R. N. & Clarke, K. R. PERMANOVA+ for PRIMER: Guide to software and statistical methods. (PRIMER-E, 2008).
68. Clarke, K. R. & Ainsworth, M. A method of linking multivariate community structure to environmental variables. Mar. Ecol. Prog. Ser. 92, 205–219 (1993).
69. Clarke, K. R. & Warwick, R. M. Change in marine communities: an approach to statistical analysis and interpretation. (Plymouth Marine Laboratory, 2001).
70. R Core Team R: A language and environment for statistical computing. R Foundation for Statistical Computing, Vienna, Austria. URL http://www.R-project.org (2013).
71. Clarke, K. R. & Gorley, R. PRIMER v6: User Manual/Tutorial (2006).
72. Rautio, M., Mariash, H. & Forsström, L. Seasonal shifts between autochthonous and allochthonous carbon contributions to zooplankton diets in a subarctic lake. Limnol. Oceanogr. 56, 1513–1524 (2011).
73. Tranvik, L. J. Microbial transformation of labile dissolved organic matter into humic-like matter in seawater. FEMS Microbiol. Ecol.
12, 177–183 (1993).
74. Jonsson, A., Ström, L. & Åberg, J. Composition and variations in the occurrence of dissolved free simple organic compounds of an unproductive lake ecosystem in northern Sweden. Biogeochem. 82, 153–163 (2007).
75. Guillemette, F. & del Giorgio, P. A. Reconstructing the various facets of dissolved organic carbon bioavailability in freshwater ecosystems. Limnol Oceanogr. 6, 734–748 (2011).
76. Cammack, W. K. L., Kalff, J., Prairie, Y. T. & Smith, E. M. Fluorencent dissolved organic matter in lakes: Relationship with heterotrophic metabolism. Limnol. Oceanogr. 49, 2034–2045 (2004).
77. Hobbie, J. E. & Laubourn-Parry, J. Heterotrophic microbial processes in polar lakes in Polar lakes and rivers: Limnology of Arctic and Antarctic aquatic ecosystems (eds Vincent, W. F. & Laubourn-Parry, J.) 197–212 (Oxford University Press, 2008).
78. Lyons, W. B. & Finlay, J. C. Biogeochemical cycles in high-latitude lakes and rivers. In Polar lakes and rivers: Limnology of Arctic and Antarctic aquatic ecosystems (eds Vincent, W. F. & Laubourn-Parry, J.) 137–156 (Oxford University Press, 2008).
79. Kirchman, D. L. Microbial growth, biomass production, and controls in Processes in microbial ecology (ed. Kirchman, D. L.) 99–117 (Oxford University Press, 2012).
80. Jansson, M., Blomqvist, P., Jonsson, A. & Bergström, A. K. Nutrient limitation of bacterioplankton, autotrophic and mixotrophic phytoplankton, and heterotro- phic nanoflagellates in Lake Örträsk. Limnol. Oceanogr. 41, 1552–1559 (1996).
81. Vrede, K., Vrede, T., Isaksson, A. & Karlsson, A. Effects of nutrients (phosphorus, nitrogen and carbon) and zooplankton on bacterioplankton and phytoplankton – a seasonal study. Limnol. Oceanogr. 44, 1616–1624 (1999).
82. Peura, S. et al. Bacterial and phytoplankton responses to nutrient amendments in a boreal lake differ according to season and to taxonomic resolution. PLoS ONE 7, e38552 (2012).
83. Del Giorgio, P. A. & Cole, J. J. Bacterial growth efficiency in natural aquatic systems. Annu. Rev. Ecol. Syst. 29, 503–541 (1998). 84. Berggren, M., Laudon, H. & Jansson, M. Hydrological control of organic carbon support for bacterial growth in boreal headwater
streams. Microb. Ecol. 57, 170–178 (2009).
85. Moran, M. A. & Hodson, R. E. Bacterial production on humic and non-humic components of dissolved organic carbon. Limnol. Oceanogr. 35, 1744–1756 (1990).
86. Laurion, I. & Mladenov, N. Dissolved organic matter photolysis in Canadian arctic thaw ponds. Environ. Res. Lett. 8, 035026 (2013). 87. Anesio, A., Granéli, W., Aiken, G., Kieber, D. J. & Mopper, K. Effect of humic substance photodegradation on bacterial growth and
respiration in lake water. Appl. Environ. Microbiol. 71, 6267–6275 (2005).
88. Judd, K. E., Crump, B. C. & Kling, G. W. Variation in dissolved organic matter controls bacterial production and community composition. Ecology 87, 2068–2079 (2006).
89. Reche, I., Pulido-Villena, E., Morales-Baquero, R. & Casamayor, E. O. Does ecosystem size determine aquatic bacterial richness? Ecology 86, 1715–1722 (2005).
90. Zeder, M., Peter, S., Shabarova, T. & Pernthaler, J. A small population of planktonic Flavobacteria with disproportionally high growth during the spring phytoplankton bloom in a prealpine lake. Environ. Microbiol. 11, 2676–2686 (2009).
91. Salcher, M. M., Pernthaler, J. & Posch, T. Seasonal bloom dynamics and ecophysiology of the freshwater sister clade of SAR11 bacteria ‘that rule the waves’ (LD12). ISME J. 5, 1242–1252 (2011).
92. Heinrich, F., Eiler, A. & Bertilsson, S. Seasonality and environmental control of freshwater SAR11 (LD12) in a temperate lake (Lake Erken, Sweden). Aquat. Microb. Ecol. 70, 33–44 (2013).
93. Allgaier, M., Brückner, S., Jaspers, E. & Grossart, H. P. Intra- and inter-lake variability of free-living and particle-associated Actinobacteria communities. Environ. Microbiol. 9, 2728–2741 (2007).
94. Jezbera, J., Jezberová, J., Brandt, U. & Hahn, M. W. Ubiquity of Polynucleobacter subspecies asymbioticus results from ecological diversification. Environ. Microbiol. 13, 922–931 (2011).
Acknowledgements
We would like to thank Shawn Devlin, Heather Mariash, Laura Forsström, Tobias Schneider, Arctic limnology course 2011 and Kilpisjärvi Biological station for help in the field sampling and Blaize Denfield for English correction. Maa- ja Vesitekniikan tukiry., Natural sciences and engineering research council of Canada (NSERC) and Academy of Finland (grant 140775 to MR and 265902 to SP) are acknowledged for financial support.
Author Contributions
The study concept was developed by T.R., S.P. and M.R. Samples were collected and carbon analyses were conducted by T.R., molecular analyses and processing of the molecular data was conducted by S.P., and M.C. and S.P. performed the statistical analyses. First draft of the paper was written by T.R. and M.R. and revised drafts and final paper were written by S.P. and M.R.
Additional Information
Supplementary information accompanies this paper at http://www.nature.com/srep Competing financial interests: The authors declare no competing financial interests.
How to cite this article: Roiha, T. et al. Allochthonous carbon is a major regulator to bacterial growth and
community composition in subarctic freshwaters. Sci. Rep. 6, 34456; doi: 10.1038/srep34456 (2016).
This work is licensed under a Creative Commons Attribution 4.0 International License. The images or other third party material in this article are included in the article’s Creative Commons license, unless indicated otherwise in the credit line; if the material is not included under the Creative Commons license, users will need to obtain permission from the license holder to reproduce the material. To view a copy of this license, visit http://creativecommons.org/licenses/by/4.0/