HAL Id: dumas-01291523
https://dumas.ccsd.cnrs.fr/dumas-01291523
Submitted on 21 Mar 2016
HAL is a multi-disciplinary open access
archive for the deposit and dissemination of
sci-entific research documents, whether they are
pub-lished or not. The documents may come from
teaching and research institutions in France or
abroad, or from public or private research centers.
L’archive ouverte pluridisciplinaire HAL, est
destinée au dépôt et à la diffusion de documents
scientifiques de niveau recherche, publiés ou non,
émanant des établissements d’enseignement et de
recherche français ou étrangers, des laboratoires
publics ou privés.
Évaluation de la réponse thérapeutique des tumeurs
solides par TEP-FDG : étude de la reproductibilité des
critères EORTC et PERCIST sur une cohorte de
patients atteints de cancer de vessie récidivant traités
par temserolimus dans un essai de phase II (VESTOR)
Isabelle Galinier
To cite this version:
Isabelle Galinier. Évaluation de la réponse thérapeutique des tumeurs solides par TEP-FDG : étude
de la reproductibilité des critères EORTC et PERCIST sur une cohorte de patients atteints de cancer
de vessie récidivant traités par temserolimus dans un essai de phase II (VESTOR). Médecine humaine
et pathologie. 2016. �dumas-01291523�
Université de Bordeaux U.F.R DES SCIENCES MEDICALES
Année 2016 N° 3006
Thèse pour l’obtention du
DIPLOME d’ETAT de DOCTEUR EN MEDECINE Présentée et soutenue publiquement
Par GALINIER Isabelle
Née le 21 novembre 1986 à TOULOUSE le 26 février 2016
Titre de la thèse
Evaluation de la réponse thérapeutique des tumeurs solides par TEP-FDG:
Etude de la reproductibilité des critères EORTC et PERCIST sur une cohorte
de patients atteints de cancer de vessie récidivant traités par temserolimus
dans un essai de phase II (VESTOR)
Directeur de thèse
Madame le Docteur Anne-Laure CAZEAU
Jury
Madame le Professeur Laurence BORDENAVE Président du jury
Madame le Professeur Nadine HOUEDE Juge
Monsieur le Professeur Elif HINDIE Juge
Monsieur le Docteur Jacques GUILLET Juge
REMERCIEMENTS
A notre président de thèse,
Madame le Professeur Laurence Bordenave,
Pour avoir accepté de présider ce jury de thèse, pour votre disponibilité et votre soutien tout au long de ma formation, soyez assurée de ma reconnaissance et de mon profond respect.
A nos juges,
A Madame le Professeur Nadine Houede,
Pour me faire l’honneur de participer à ce jury de thèse, recevez toute ma reconnaissance et mon profond respect.
A Monsieur le Professeur Elif Hindie,
Pour avoir accepté de juger ce travail, pour votre enseignement bienveillant lors de mon semestre à Haut-Levêque, recevez ici l’expression de ma sincère gratitude et de mes remerciements.
A Monsieur le Docteur Jacques Guillet,
Je vous remercie d’avoir accepté de juger ce travail. Pour votre gentillesse infinie, votre amour pour la médecine, votre enthousiasme à transmettre votre savoir et votre extrême bienveillance, soyez assuré de ma profonde admiration et de mon immense reconnaissance.
A notre Directeur de thèse et juge,
Madame le Docteur Anne-laure Cazeau,
Je te remercie infiniment d’avoir bien voulu diriger ce travail, avec constance et bienveillance. Merci pour ta grande disponibilité, tes encouragements, ton aide précieuse et ta bonne humeur. Reçois ici le témoignage de ma sincère gratitude et de ma profonde admiration.
A notre rapporteur,
Monsieur le Professeur Florent Cachin,
Merci d’avoir consacré du temps à la lecture de cette thèse et à l’élaboration de votre rapport. Recevez mon profond respect et toute ma reconnaissance.
Merci à tous les médecins, manipulateurs, secrétaires, ASH, infirmières des services du Cepta, des services de médecine nucléaire d’Agen, de Bergonié, de Bayonne et Haut-Levêque, des services de radiologie de Pau et Haut-Levêque, pour votre enseignement, vos conseils et votre bonne humeur. A toute l’équipe de médecine nucléaire de l’hôpital de Montfermeil pour leur accueil chaleureux.
A PJ, merci d’avoir remplie ma vie d’amour, de m’avoir soutenue et supportée dans mes moments de stress et de doute, pour ton soutien infaillible mais toujours éclairé, ta patience à tout épreuve, ta générosité, pour tout le bonheur que tu m’apportes chaque jour. Merci aussi pour ta grande aide dans la réalisation de ce travail.
A mes parents, merci pour votre soutien, votre aide et votre amour sans faille. A ma Mémée, merci pour ton amour inconditionnel et sans limite.
A ma sœur Aliénor, merci pour ton soutien sans faille, ta franchise, ton aide sûre, tes conseils toujours perspicaces et sans détours.
A toute ma famille, mes frères Jean-Baptiste et Gabriel, ma grand-mère Marie-Neige, mes grands-parents, mon parrain Jean-François, ma marraine Michèle, ma tante Nuria, mon beau-frère Dardelet, mes beaux-parents, ma belle-sœur, mon beau-frère, mes neveux et nièce. Merci pour tout l’amour dont vous m’entourez.
A tous mes amis, à tous mes anciens co-externes et co-internes, merci pour ces bons moments passés ensembles et pour votre soutien.
A tous mes anciens compagnons d’externat, Claire, merci pour tous les moments de rigolade et de partage, merci d’avoir toujours été là dans les bons comme dans les mauvais moments, merci pour ton amitié fidèle et ton intégrité, Valérie (merci d’être presque aussi fofolle que moi), Clopette, Pasca, Pauline, Popo (merci pour toutes ces folles soirées endiablées, merci d’ être aussi barrées que moi et sans jamais juger, merci pour votre amitié fidèle), Nath (merci pour ta bonne humeur continuelle, ta motivation perpétuelle et ta simplicité), Claudia, Sara (pour avoir été la 1ère à m’accompagner à la bibliothèque, pour avoir partagé avec moi tes sandwichs au foie gras en P1, 12 ans après notre 1re BU nous voilà enfin au bout du chemin!).
A Fanny, merci de m’avoir soutenue jusqu’au bout et de m’avoir aidé à découvrir les bibliothèques parisiennes !
Alexandre, merci de t’être soucié de moi avant même de me connaître, pour tes nombreux conseils (Hubic m’a sauvée !), ta sensibilité et ton sens de l’humour.
ABSTRACT
18
FDG PET/CT response evaluation of patients with recurrent bladder cancer treated in
a phase 2 study with temserolimus (VESTOR): reproducibility of PERCIST and EORTC
criteria
FDG-PET response assessment is a challenge due to published criteria heterogeneity. PERCIST and EORTC criteria were proposed to standardize metabolic response in solid tumors. Our aim was to evaluate criteria agreement in recurrent bladder cancer patients treated with temserolimus in a phase II trial (VESTOR).
Materials and Methods: Among a prospective cohort of 51 patients, 12 from 2 centers underwent at
least 2 PET: 1 baseline and 1 before the 3rd injection (31 PETs performed). 2 nuclear physicians determined metabolic response according to PERCIST and EORTC criteria and recorded several PET measures. Mean measure percentage difference and disagreement on response classification between two observers and criteria (with corresponding κ) were obtained.
Results: Intra-observer and inter-observer (IRO) variability of PET indices were similar: very weak for
SUVbw, SULpeak, and SUVbsa max (0,2-0,5 %), slighty higher for Liver SULmean and MTV segmentation threshold (3,5% to 5%) and clearly higher for FDG uptake extent and liver SULmean standard deviation (10-15%). IRO agreement was better when only the hottest lesion was assessed: 1 target EORTC SUVbsa max κ=0,83; 1 target PERCIST SULpeak κ= 0,67; 5 targets EORTC SUVbsa max κ= 0,62; 5 targets PERCIST SULpeak κ=0,56. The inter-criteria agreement was perfect (κ=1) with PERCIST and EORTC when evaluating only the hottest target, but lower with other ways of assessment: 5 targets EORTC/PERCIST κ=0,44; 5 targets PERCIST SULpeak/PERCIST TLG: κ=0,55; 5 targets EORTC SUVbsa max/EORTC SUVbsa mean κ= 0,77; 5 targets PERCIST SULpeak/1 target PERCIST SULpeak κ= 0,77; 5 targets EORTC SUVbsa max/1 target EORTC SUVbsa max κ= 0,31.
Conclusion: IRO agreement was better with the simplest assessment method. Different ways of
assessment proposed by PERCIST and the EORTC didn’t lead to strictly identical classifications; one single easy and widely accepted method would be useful for study comparisons and result reproducibility.
LISTE DES ABREVIATIONS
BSA: Body Surface Area bw: Body Weight
CMR: Complete Metabolic Response CR: Complete Response
EANM: European Association of Nuclear Medicine EARL: European Association Research for Life
EORTC: European Organization for Research and Treatment of Cancer FDG:Fluorodeoxyglucose
GE: General Electric GTV: Gross Tumor Volume kV: kiloVolts
LBM: Lean Body Mass mAs : miliAmpers MBq: MegaBecquerel MR: Metabolic Response MTV: Metabolic tumor volume
NSUV-A: Normalized SUV max to aortic arch pCR: pathological Complete Response
PERCIST: PET Response Criteria in Solid Tumors PET: positron emission tomography
PMD: Progressive Metabolic Disease PMR: Partial Metabolic Response
RECIST: Response Evaluation Criteria in Solid Tumors SAM: Standardized Added Metabolic activity
SD: Stable Disease or Standard Deviation SMD: Stable Metabolic Disease
SUL: Standard Uptake value Lean Body Mass SUV:Standardized uptake value
TLG: Total Lesion Glycolysis VOI: Volume-Of-Interest
I. Introduction
In oncology, early response assessment is a major medico-economic issue1. It is known that FDG uptake, measured by PET, is correlated with viable tumoral cells2. Numerous studies found that decrease in FDG uptake provides an early and sensitive pharmacodynamic marker of chemotherapies tumoricidal effect3, 4. Thus, FDG PET/CT (PET) could be an early response assessment biomarker in addition to RECIST 1.11, 5. Especially in non-cytotoxic therapy, where a functional assessment could be more effective than anatomical imaging6. But PET Response assessment remains challenging due to heterogeneity of published criteria of response and their proposed thresholds.
For example, in neoadjuvant settings, more than 180 studies were published about metabolic response (MR) assessment value in solid tumors, mainly in breast7, 8, rectum9, 10, esophagus11, 12, lung13 cancers, in sarcomas14, 15 and in head and neck squamous cell carcinomas16. Among the 20 largest studies7-13, 17-29, median patient number 99 [64-211], 12 were prospective. The studied criteria were variable (often several criteria in a same study) and could include either visual analysis10, 13, 18, 22
24, 29 and/or quantitative assessment. It could be either absolute value threshold (especially SUV max7, 29, but also SUV mean9, TLG22, MTV7, or GTV 7, 9, Delta SUV max between PET acquired after 1h and
3 h post injection23, or voxel-based dual-time parametric imaging24) or relative pre/post therapy thresholds, i.e.Delta (especially Delta SUV max7, 17, Delta SUV mean9, 10, 18, 22, Delta TLG18, Delta MTV7, Delta GTV9, Delta SUV max between PET acquired after 6 and 12 weeks after the end of therapy9, 23). Regarding Delta SUV max, the most common percentage thresholds varied from 50 to 85%. The sensitivity and specificity to predict patient follow-up were variable and not always sufficient for a clinical use, but generally PET assessment was reliable: sensitivity 33 to 95% and specificity 31 to 96%12, 25. On the 4 studies that did not found significant correlation between MR and patient follow-up 3 evaluated neoadjuvant radio-chemotherapy (2 rectal cancers, and 1 esophageal cancer)10, 22, 26; inflammation process in this context, and goals (to determine pCR), could have limited the PET predictive value.
Regarding MR assessment in metastatic solid tumors, more than 100 studies were published, mainly in breast30, 31, colorectal32, 33, lung34, 35, kidney36 cancers, in germ cell tumors37, melanomas38 and GISTs39. Among the 20 largest studies30-50, median patient number 53[40-127], only 10 were prospective. The studied criteria were moderately variable (sometimes several criteria in the same study) and could be either visual analysis31, 35, 37, 46, 48, 49 and/or quantitative assessment (absolute value threshold - SUV max36, 49, normalized SUV max to aortic arch (NSUV-A)35 - or relative pre/post therapy thresholds (Delta tumor load43, Delta NSUV-A35, Delta ratio of FDG uptake in the tumor and normal liver (T: L)50 or Delta SUV, mostly Delta SUV max33, 39. Sometimes delta SUV according to EORTC30, 32, 34, 45 or PERCIST criteria32, 47 were applied. For Delta SUV, the most common MR percentage thresholds were between 15% and 25% [15%-75%]. All the studies found significant correlation between MR and patient follow up. Four studies calculated sensitivity and specificity to predict patient follow-up, with results varying from 59 to 80% sensitivity and 69 to 100% specificity 35,
Aside from cancer type and subtype (histology, lesion size, stage), and chemotherapy type differences, studies’ variability also results from differences in PET assessment timing (number of therapy cycles before PET, and delay since end of last therapy and PET acquisition51).
Another difficulty for MR assessment, especially quantitative assessment, is the need for harmonized acquisition procedures to allow usage and comparison of different centers data52. To answer that, the European Association of Nuclear Medicine (EANM) provides FDG PET imaging procedure guidelines53, 54 and the European Association Research for Life (EARL) organizes a PET accreditation program which helps the centers to follow these guidelines.
The EORTC criteria4 of 1999 and the PERCIST1 criteria of 2009 were proposed to standardize MR assessment in solid tumors. Only 4 studies evaluated agreement between these two criteria regarding MR assessment, and 3 of these compared their performances18, 32, 55, 56, with a good to very good agreement between criteria and a correlation between Overall Survival (OS) or pathological complete response (pCR) and MR.
The first aim of this study was to evaluate the intra and inter-observer agreement of PERCIST and EORTC response criteria in a prospective patient’s cohort treated with temserolimus for recurrent bladder cancer in a phase II trial (VESTOR). The secondary aims were: to assess the agreement on response classification between PERCIST and EORTC criteria and to evaluate the intra and inter-observer variability of several quantitative PET measures indices.
II. Materials and methods
Patients A.
Patients were recruited from a prospective cohort of 51 patients with recurrent bladder cancer after a first chemotherapy lign. This cohort was a part of a multi-center phase 2 trial which evaluated the efficacy of temserolimus forprogression free survival, with RECIST 1.1 criteria, 8 weeks after the beginning of treatment. Patients were included from January 2010 to July 2014.
All patients in the trial who had undergone at least PET 1 and PET 2 examinations (PET 1: baseline PET, PET 2: the day before the 3rd temserolimus administration and PET 3: the day before the 9th administration) were included.
Therapy B.
All patients received the same therapy: temserolimus 25 mg IV, once a week. The dose could be decreased in case of toxicity.
FDG-PET/CT imaging protocol C.
Acquisitions were performed on 2 different PET/CT scanners (2 centers): a GE Discovery ST (2004) and a Philips GEMINI TF TOF 16 integrated PET/CT (2008).
For every patient, the 2 (or 3) scans were performed in the same institution on the same PET/CT scanner, with the same protocol.
The patients fasted for at least 6h before scanning. Their blood glucose levels measured before the 18F-FDG injection were below 200 mg/dL.
Patients were injected with an average of 4,63 MBq/kg of 18F-FDG [2,9-5,98]. The average uptake period before scanning was 66 min [54-87].
The baseline PET/CT scans were performed no more than 2 weeks before the first temserolimus administration, and at least 3 weeks after the previous chemotherapy. The follow-up PET/ CT scans were performed few days before the following administration of temserolimus to prevent temporary fluctuations in tumoral 18F-FDG uptake.
The whole-body images were obtained from the skull base to the mid-thigh. The images were reconstructed in axial, coronal, and sagittal planes.
The PET acquisition parameters were as follows: static acquisition, 1,15 to 1,45 mn per bed position adjusted to the body mass index, 4 mm slice thickness, 144 × 144 matrice, 3D mode, iterative reconstruction 3D RAMLA; axial spatial resolution (1 cm): 4,7 mm for the Philips PET/CT; for the GE PET/CT: static acquisition, 4 mn per bed position, 3,27 mm slice thickness, 128x128 matrice, 2D/3D mode, iterative reconstruction OSEM, axial spatial resolution: 5,22 mm.
The CT acquisition parameters were as follows: 120 kV, mAs determined automatically on the basis of attenuation, 16 slices, and 3 mm slice thickness for the Philips PET/CT; for the GE PET/CT: 120 kV, mAS determined automatically on the basis of attenuation, 3,75 mm slice thickness.
Image interpretation D.
FDG-PET/CT scans were reviewed independently by 2 nuclear medicine physicians blinded to the clinical outcome, one senior physician who had practiced PET for more than 10 years, and the second, for more than 4 years. One physician interpreted the exams twice to evaluate intra-observer variability and agreement (4 weeks between the 2 blinded interpretations).
The images were transferred to the workstation Keosys (LOGICIEL VISIO+ DUO2 KSWDUOG2 2011) for interpretation.
The number of lesions to be assessed was specified in PERCIST1 criteria (from 1 to 5 targets, with a maximum of two per organ), but not in the EORTC criteria. Therefore, for all criteria, we chose as often as possible five targets with the highest FDG uptake. Patients’ responses to treatment were evaluated according to the EORTC, PERCIST and RECIST 1.1criteria.
1. Analyses according to the EORTC criteria
For EORTC criteria, body surface area (BSA) according to the formula BSA= W0.425 × H0.725 × 0.007184 (W=weight, H=height) was used for standardized uptake value (SUV) normalization calculated by the workstation (SUV bsa)4.
Visual analysis and quantitative measurement of SUV bsa max, SUV bsa mean, length of main tumor targets FDG extent were performed, as specified in the EORTC criteria. In each study, SUV values (and extent) of all target lesions were summed. When measuring the response to treatment, the sum of SUVbefore and after treatment was calculated and the difference was divided by the sum of the SUV values from the baseline scan (Delta SUV). Responses to therapy were classified as: complete metabolic response (CMR), partial metabolic response (PMR), stable metabolic disease (SMD) and progressive metabolic disease (PMD), as summarized in Table 1.
We determined EORTC response according to SUV bsa max, SUV bsa mean and the size in millimeters of FDG extent targets (longest diameter), either with the one hottest target (EORTC 1) and with the 5 hottest targets (EORTC 5).
2. Analyses according to PERCIST criteria
For PERCIST criteria, lean body mass (LBM) was used for normalizing SUV (SUL), but the LBM formula was not specified1 . The workstation calculated LBM on the basis of the patient’s height and weight, according to the formula (1.10 × Weight) - 128 × (Weight / Height)2 for men and (1.07 × Weight) - 148 × (Weight / Height)2 for women.
The baseline minimal metabolically measurable tumor activity (SULref= target lesion threshold) was calculated according to the formula (1.5 × liver mean SUL) + (2 × SUL standard deviation (SD)). To assess the liver SUL mean, a circular volume-of-interest (VOI) of 3 cm in diameter was drawn over the right lobe of the liver. A circular VOI of 1.2 cm in diameter was placed in the areas where the highest lesion activity was present and mean SUL value inside the VOI was calculated as the SUL peak. In each study, the SUL peak values of all target lesions were summed. When measuring the response to treatment, the sum of SUL peak before and after treatment was calculated and the difference was divided by the sum of the SUL peakvalues from baseline scan. As exploratory data, we also recorded the targets lengths, the metabolic tumor volume (MTV) and the SUV and SUL mean,
as those are used to calculate the TLG; the liver SUL mean DS, as this DS is used to calculate the SULref; the SUL max; and the SUV bw max (SUV normalized by the weight), as it is the most used value for PET evaluation.
Responses to therapy were classified as CMR, PMR, SMD or PMD with the hottest target (PERCIST1) and with the 5 hottest targets (PERCIST5), as proposed by PERCIST (see Table 1). PERCIST indicates that to classify as PMR you mustn’t have increase >30% in SUL or size of target or non-target lesions (i.e., no PD by RECIST), therefore in case of size increase (PD with RECIST), we classified the disease as progressive.
PERCIST criteria were applied according to SUL peak, SUV bw max, SUL max.
For total lesion glycolysis (TLG), 5 lesions with highest SUL values were evaluated, and the threshold used to generate lower bounds of ROI was 3 SDs above normal liver SUL (threshold = liver SUL mean + 3 SD). We chose 3 SD rather than 2 SD as most of the tumors were very active at baseline and, furthermore, a threshold of 2 SDs above liver SUL mean wasn’t able to correctly segment liver targets. To assess the response with TLG, PERCIST criteria proposed a 45% reduction for response and a 75% growth for progression.
3. Analyses according to the RECIST 1.1 criteria
The target lesions (up to 5 targets, with a maximum of two per organ) were chosen among measurable lesions (lesions with longest diameter ≥ 10 mm and for nodes short axis ≥ 15 mm)57. For each scan, the diameters of all target lesions were summed. The difference of these sums was divided by the sum of the diameters values from the baseline scan. Responses to therapy were then classified as: complete response (CR), partial response (PR), progressive disease (PD) or stable disease (SD), see Table 1.
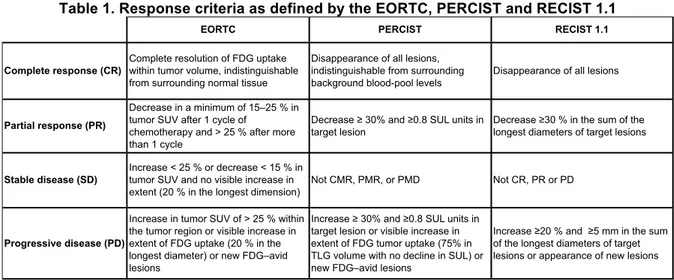
Table 1. Response criteria as defined by the EORTC, PERCIST and RECIST 1.1
EORTC PERCIST RECIST 1.1
Complete response (CR)
Complete resolution of FDG uptake within tumor volume, indistinguishable from surrounding normal tissue
Disappearance of all lesions, indistinguishable from surrounding background blood-pool levels
Disappearance of all lesions
Partial response (PR)
Decrease in a minimum of 15–25 % in tumor SUV after 1 cycle of
chemotherapy and > 25 % after more than 1 cycle
Decrease ≥ 30% and ≥0.8 SUL units in target lesion
Decrease ≥30 % in the sum of the longest diameters of target lesions
Stable disease (SD)
Increase < 25 % or decrease < 15 % in tumor SUV and no visible increase in extent (20 % in the longest dimension)
Not CMR, PMR, or PMD Not CR, PR or PD
Progressive disease (PD)
Increase in tumor SUV of > 25 % within the tumor region or visible increase in extent of FDG uptake (20 % in the longest diameter) or new FDG–avid lesions
Increase ≥ 30% and ≥0.8 SUL units in target lesion or visible increase in extent of FDG tumor uptake (75% in TLG volume with no decline in SUL) or new FDG–avid lesions
Increase ≥20 % and ≥5 mm in the sum of the longest diameters of target lesions or appearance of new lesions
We then determined the PERCIST response by using the SUL peak (with the one hottest target (PERCIST 1) and with the 5 hottest targets (PERCIST 5), as proposed by PERCIST), the SUV bw
and with the 5 hottest targets (EORTC 5T)), and the size of FDG extent targets in millimeter (longest diameter). We also determined the RECIST 1.1. response. We made an excel table which calculated automatically the variation percentages for all the classifications, it allowed us to save time and prevented miscalculations.
We recorded, to assess their intra and inter-observer variability, different PET indices: SUV bw max, SUL peak, SUV bsa max, the extent of FDG tumor uptake in the longest dimension, the liver SUL mean and its SD, the SULref, and the TLG threshold.
Statistical analyses E.
Statistical analysis was performed with the R Core Team (2015) software (R: A language and environment for statistical computing. R Foundation for Statistical Computing, Vienna, Austria.)
A Cohen kappa testwas performed to evaluate the intra-observer and inter-observer agreement for MR and to assess the agreement between the patients’ responses according to the EORTC, PERCIST and RECIST 1.1 criteria. According to this test, a κ value between 0.81 and 1.00 implies almost perfect agreement, a value between 0.61 and 0.80 implies good agreement, a value between 0.41 and 0.60 implies moderate agreement, a value between 0.21 and 0.40 implies fair agreement, and a value less than 0.20 implies poor agreement.
To evaluate the intra-observer and inter-observer variability of the different PET image indices in the hottest targets, the absolute difference of each pair of measurements was calculated, and the means and SDs of those differences were obtained. The mean percentage difference relative to the mean of each pair of measurements was calculated. The means and SDs of those percentages were obtained.
III. Results
Among the 51 patients from VESTOR study, 17 underwent PET/CT examinations, 2 were excluded due to the unavailability of the follow-up PET/CT, 3 due to the unavailability of baseline PET/CT.
All the remaining 12 patients were included and underwent either 2 or 3 PET/CT examinations between August 2010 and September 2014, 31 PET/CT scans were performed, with an average of 2.6 PET/CT scans per patient. 19 MR were evaluated. 10 patients were scanned on the GE PET/CT scanner and 2 patients on the Philips PET/CT scanner.
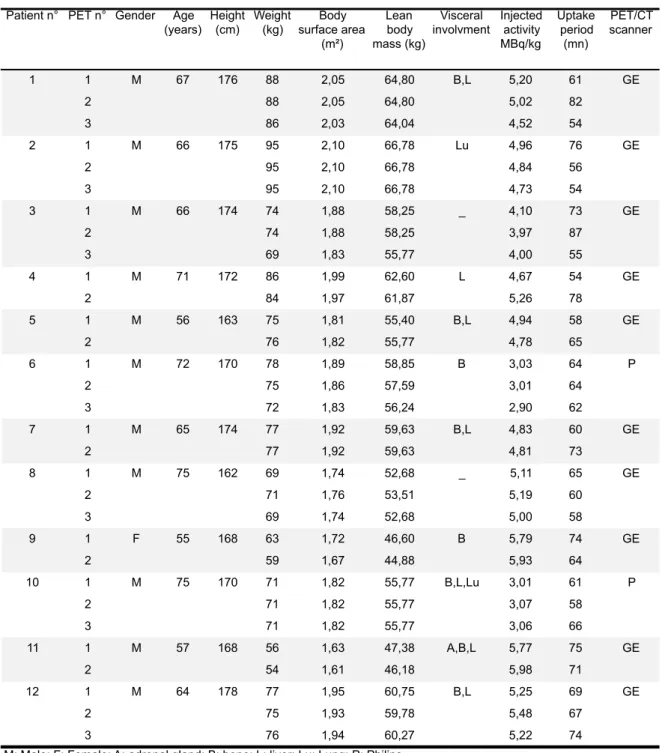
The patients’ characteristics and those of their PETs, including age, gender, height, weight, visceral involvement, injected activity, uptake period, and PET/CT scan type are summarized in Table 2. The median age was 66 [55-75], median weight was 75 kg (range 54-95), and height was 171 cm [162-178]. The sex ratio was 11 men for 1 woman. All the patients had metastatic disease.
Table 2. Summary of patients and PETs characteristics
Patient n° PET n° Gender Age (years) Height (cm) Weight (kg) Body surface area (m²) Lean body mass (kg) Visceral involvment Injected activity MBq/kg Uptake period (mn) PET/CT scanner 1 1 M 67 176 88 2,05 64,80 B,L 5,20 61 GE 2 88 2,05 64,80 5,02 82 3 86 2,03 64,04 4,52 54 2 1 M 66 175 95 2,10 66,78 Lu 4,96 76 GE 2 95 2,10 66,78 4,84 56 3 95 2,10 66,78 4,73 54 3 1 M 66 174 74 1,88 58,25 _ 4,10 73 GE 2 74 1,88 58,25 3,97 87 3 69 1,83 55,77 4,00 55 4 1 M 71 172 86 1,99 62,60 L 4,67 54 GE 2 84 1,97 61,87 5,26 78 5 1 M 56 163 75 1,81 55,40 B,L 4,94 58 GE 2 76 1,82 55,77 4,78 65 6 1 M 72 170 78 1,89 58,85 B 3,03 64 P 2 75 1,86 57,59 3,01 64 3 72 1,83 56,24 2,90 62 7 1 M 65 174 77 1,92 59,63 B,L 4,83 60 GE 2 77 1,92 59,63 4,81 73 8 1 M 75 162 69 1,74 52,68 _ 5,11 65 GE 2 71 1,76 53,51 5,19 60 3 69 1,74 52,68 5,00 58 9 1 F 55 168 63 1,72 46,60 B 5,79 74 GE 2 59 1,67 44,88 5,93 64 10 1 M 75 170 71 1,82 55,77 B,L,Lu 3,01 61 P 2 71 1,82 55,77 3,07 58 3 71 1,82 55,77 3,06 66 11 1 M 57 168 56 1,63 47,38 A,B,L 5,77 75 GE 2 54 1,61 46,18 5,98 71 12 1 M 64 178 77 1,95 60,75 B,L 5,25 69 GE 2 75 1,93 59,78 5,48 67 3 76 1,94 60,27 5,22 74
M: Male; F: Female; A: adrenal gland; B: bone; L: liver; Lu: Lung; P: Philips _: no visceral involvment
At baseline, for the hottest targets: the median SUV bw max was 10 [6,2-21,5], the median SUL peak was 6,4 [3,6-14,8], the median SUV bsa max was 0,256 [0,15-0,604], and the median liver SUL mean 1,79 [1,44-2,47]. The median liver SUL mean of all PETs was 1,75 [1,44-2,68].
Response classification inter-observer agreement A.
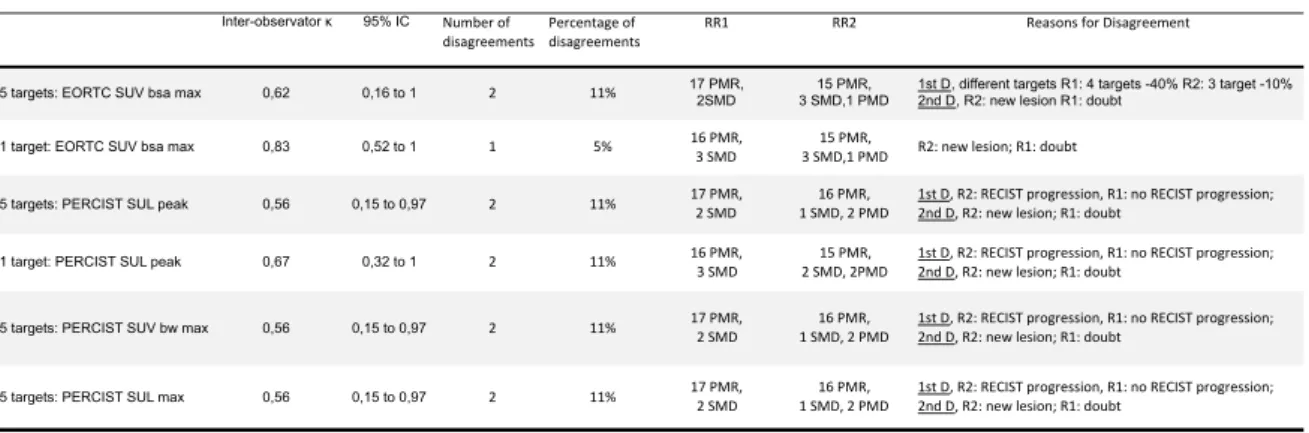
The MR for the PERCIST (SUL peak) and EORTC (SUV bsa max) criteria (5 targets) of the two observers are detailed in Table 3. The different MR assessments, inter-observer agreements and reasons for disagreement according to the different criteria are summarized in Table 4.
Table 3. Summary of PERCIST/EORTC responses of the 2 observers
EORTC 5
targets EORTC 5 targets PERCIST 5 targets PERCIST 5 targets RR1 RR2 RR1 RR2 1-2 PMR PMR Y PMR PMR Y PMR PMR Y 1-3 PMR PMR Y PMR PMR Y PMR PMR Y 1-2 PMR PMR Y PMR PMR Y PMR PMR Y 1-3 PMR PMR Y PMR PMR Y PMR PMR Y 1-2 PMR PMR Y PMR PMR Y PMR PMR Y 1-3 PMR PMR Y PMR PMR Y PMR PMR Y 4 1-2 SMD SMD Y SMD PMD N SMD SMD Y 5 1-2 PMR SMD N PMR PMR Y PMR PMR Y 1-2 PMR PMR Y PMR PMR Y PMR PMR Y 1-3 SMD SMD Y PMR PMR Y SMD PMR N 7 1-2 PMR PMR Y SMD SMD Y PMR SMD N 1-2 PMR PMR Y PMR PMR Y PMR PMR Y 1-3 PMR PMD N PMR PMD N PMR PMR Y 9 1-2 PMR PMR Y PMR PMR Y PMR PMR Y 1-2 PMR PMR Y PMR PMR Y PMR PMR Y 1-3 PMR PMR Y PMR PMR Y PMR PMR Y 11 1-2 PMR PMR Y PMR PMR Y PMR PMR Y 1-2 PMR PMR Y PMR PMR Y PMR PMR Y 1-3 PMR PMR Y PMR PMR Y PMR PMR Y 2 2 2 1 2 3 6
Patient n° PET n° EORTC Agreement R1-R2 PERCIST Agreement R1-R2 Final Response EORTC Final response PERCIST EORTC-PERCIST Concordanc e 10 12 Numbers of disagreement
RR: Response Reader, Y: Yes, N: No, PFS: Progression Free Survival, OS: Overall Survival 8
None of the patients had CMR. With EORTC5 (SUV bsa max), the first observer found 17 PMR and 2 SDM, the second observer found 15 PMR, 3 SMD, 1 PMD. With PERCIST5 (SUL peak), the first observer found 17 PMR and 2 SMD, the second observer found 16 PMR, 1 SMD, 2 PMD.
The κ coefficient was categorized as almost perfect with EORTC criteria evaluating the hottest target, good with EORTC criteria evaluating 5 targets and PERCIST criteria evaluating the hottest target, and moderate with PERCIST criteria evaluating 5 targets. For this last category, the response classification was identical whether we used SUL peak, SUV bw max or SUL max. The number of disagreements was the same (n=2, 11%) for all the criteria except for EORTC criteria evaluating the hottest target (1 disagreement, 5%).
Table 4. Inter-observer agreement Inter-observator κ 95% IC Number'of'
disagreements disagreementsPercentage'of' RR1 RR2 Reasons'for'Disagreement
5 targets: EORTC SUV bsa max 0,62 0,16 to 1 2 11% 17 PMR, 2SMD 3 SMD,1 PMD15 PMR, 1st D, different targets R1: 4 targets -40% R2: 3 target -10%2nd D, R2: new lesion R1: doubt
1 target: EORTC SUV bsa max 0,83 0,52 to 1 1 5% 16'PMR,3'SMD 3'SMD,1'PMD15'PMR, R2:'new'lesion;'R1:'doubt
5 targets: PERCIST SUL peak 0,56 0,15 to 0,97 2 11% 17'PMR,2'SMD' 1'SMD,'2'PMD'16'PMR,' 1st'D,'R2:'RECIST'progression,'R1:'no'RECIST'progression;'2nd'D,'R2:'new'lesion;'R1:'doubt
1 target: PERCIST SUL peak 0,67 0,32 to 1 2 11% 16'PMR,'3'SMD 2'SMD,'2PMD15'PMR,' 1st'D,'R2:'RECIST'progression,'R1:'no'RECIST'progression;'2nd'D,'R2:'new'lesion;'R1:'doubt
5 targets: PERCIST SUV bw max 0,56 0,15 to 0,97 2 11% 17'PMR,'2'SMD 1'SMD,'2'PMD'16'PMR, 1st'D,'R2:'RECIST'progression,'R1:'no'RECIST'progression;'2nd'D,'R2:'new'lesion;'R1:'doubt
5 targets: PERCIST SUL max 0,56 0,15 to 0,97 2 11% 17'PMR,'2'SMD 1'SMD,'2'PMD'16'PMR,' 1st'D,'R2:'RECIST'progression,'R1:'no'RECIST'progression;'2nd'D,'R2:'new'lesion;'R1:'doubt
Response classification intra-observer agreement B.
For each observer, 19 response classifications were determined for each criterion. The intra-observer agreement for MR assessment was perfect (κ=1).
EORTC and PERCIST classification agreement (intra-observer) C.
The different MR assessments, agreements on MR, according to one physician and to the different criteria, and reasons for disagreement are summarized in Table 5.
PERCIST proposes to evaluate the response either with the 1 hottest lesion or with the 5 hottest lesions. There was no disagreement (κ=1) between PERCIST SUL peak and EORTC SUV bsa max when evaluating 1 target but there were 2 (11%) disagreements between PERCIST SUL peak and EORTC SUV bsa max when evaluating 5 targets (89% of agreement, κ=0,44 categorized as moderate). The reasons for those disagreements were: for one patient, the number of measurable lesions was different, with 1 measurable lesion with PERCIST (decrease percentage = -33%), and 5 lesions with EORCT criteria (decrease percentage = -10%); for the 2nd patient, there was a slight difference in the percentage decrease, and as the threshold are also slightly different, this resulted in a different classification (PERCIST: 26% (PMR threshold= 30%), EORTC: 29% (PMR threshold= -25%)).
The agreement was poor between PERCIST or EORTC criteria and RECIST 1.1 (κ = 0,012 and 0,088), with much more SMD with RECIST 1.1 (CT without iodinated contrast).
We then assessed the agreement between different indices proposed in the same criteria.
The EORTC criteria propose to evaluate the metabolic response either with the SUV bsa max or with the SUV bsa mean, the agreement was good (only 1 disagreement, κ=0,77). The reason was a lower variation of SUV bsa mean than SUV bsa max, resulting in a lower decrease: -33% with SUV bsa max (PMR) and -3% with SUV bsa mean (SMD). The concordance between PERCIST using SUL peak or SUL mean was lower: 7 disagreements (7 additional SMD), κ=0,23 was categorized as fair.
As the SUV bw max is one of the most used indices for response evaluation, we assessed the agreement between PERCIST 5T response with SUL peak and SUV bw max: the classification didn’t change with SUL peak, SUV bw max or SUL max (κ=1).
As PERCIST also proposes to evaluate the response with the TLG, we assessed the agreement between PERCIST5 response with SUL peak and TLG: the agreement was moderate, with 2 disagreements (κ=0,55). The reasons for disagreement were: for one patient, although the targets SUL peak decreased, the SUL mean of the 2 largest targets increased, resulting in a different percentage variation (- 36% with SUL peak (PMR), + 6% with TLG (SMD)); for the 2nd patient, one target lesion changed between baseline and follow-up, the follow up target was considerably larger, resulting in a different percentage variation (- 24% with SUL peak (SMD), +89% with TLG (PMD)).
As PERCIST doesn’t clearly specify if the TLG must be calculated with the SUV mean or the SUL mean, we assessed the concordance between this two way of evaluation: there was only 1
disagreement (κ= 0,81). The reason for disagreement was a larger variation of SUV mean than SUL mean, resulting in a different increase percentage (+ 89% with TLG SUV mean (PMD), + 66% with TLG SUL mean (SMD)).
We also assessed the agreement between TLG and MTV response (with PERCIST5), there were 3 disagreements, due to a larger percentage variation for TLG, as it is multiplied by SUV mean (respectively -59%, +89%, -60% for the TLG and -44%, + 69%, - 43 % for the MTV).
PERCIST proposes to evaluate the response with only one or with up to 5 targets. The agreement with PERCIST evaluating 1 or 5 targets was categorized as good (κ= 0,77): there was only one disagreement, due a different evolution of targets, the liver targets disappeared and the bone targets, among which was the hottest target, were stable. This resulted in a different percentage variation (- 36% for the 5 targets, +5% for the one hottest target). The agreement with EORTC criteria evaluating 1 or 5 targets was categorized as fair (κ= 0,31) with 3 disagreements: the 1st one for the same reason as just above, the 2nd one was due an increase uptake of one of the non-hottest targets (-10% for the 5 targets, -34% for the hottest target), the 3rd one was due to the larger decrease of non-hottest targets (-29% for the 5 targets, -9,5% for the hottest target).
The number of SMD was greater with MTV than with TLG, with PERCIST SUL mean than with PERCIST SUL peak (due to the lower variation and therefore less decrease of the SUL mean), with EORTC SUV bsa mean than with EORTC SUV bsa max (but much less marked than with PERCIST classification), and with RECIST 1.1 than PERCIST and EORTC classification.
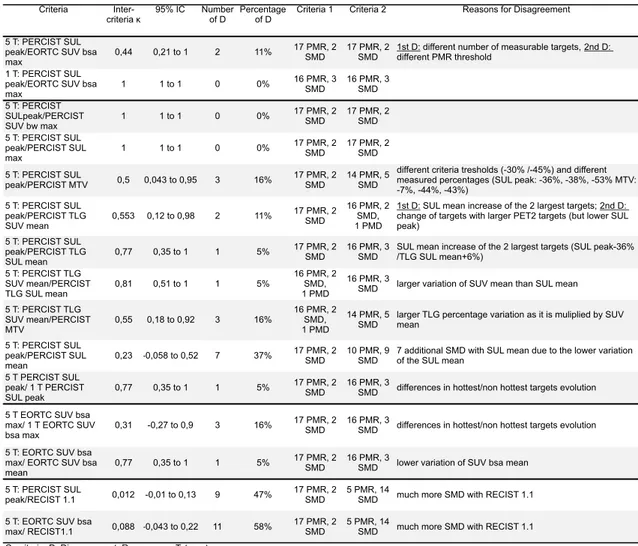
Table 5. Intra observer inter-criteria agreement
Criteria
Inter-criteria κ 95% IC Number of D Percentage of D Criteria 1 Criteria 2 Reasons for Disagreement 5 T: PERCIST SUL
peak/EORTC SUV bsa
max 0,44 0,21 to 1 2 11%
17 PMR, 2
SMD 17 PMR, 2 SMD 1st D: different number of measurable targets, 2nd D: different PMR threshold 1 T: PERCIST SUL
peak/EORTC SUV bsa
max 1 1 to 1 0 0% 16 PMR, 3 SMD 16 PMR, 3 SMD 5 T: PERCIST SULpeak/PERCIST SUV bw max 1 1 to 1 0 0% 17 PMR, 2 SMD 17 PMR, 2 SMD 5 T: PERCIST SUL peak/PERCIST SUL max 1 1 to 1 0 0% 17 PMR, 2 SMD 17 PMR, 2 SMD 5 T: PERCIST SUL peak/PERCIST MTV 0,5 0,043 to 0,95 3 16% 17 PMR, 2 SMD 14 PMR, 5 SMD
different criteria tresholds (-30% /-45%) and different measured percentages (SUL peak: -36%, -38%, -53% MTV: -7%, -44%, -43%) 5 T: PERCIST SUL peak/PERCIST TLG SUV mean 0,553 0,12 to 0,98 2 11% 17 PMR, 2 SMD 16 PMR, 2 SMD, 1 PMD
1st D: SUL mean increase of the 2 largest targets; 2nd D: change of targets with larger PET2 targets (but lower SUL peak) 5 T: PERCIST SUL peak/PERCIST TLG SUL mean 0,77 0,35 to 1 1 5% 17 PMR, 2 SMD 16 PMR, 3 SMD
SUL mean increase of the 2 largest targets (SUL peak-36% /TLG SUL mean+6%) 5 T: PERCIST TLG SUV mean/PERCIST TLG SUL mean 0,81 0,51 to 1 1 5% 16 PMR, 2 SMD, 1 PMD 16 PMR, 3
SMD larger variation of SUV mean than SUL mean 5 T: PERCIST TLG SUV mean/PERCIST MTV 0,55 0,18 to 0,92 3 16% 16 PMR, 2 SMD, 1 PMD 14 PMR, 5
SMD larger TLG percentage variation as it is muliplied by SUV mean 5 T: PERCIST SUL
peak/PERCIST SUL
mean 0,23 -0,058 to 0,52 7 37%
17 PMR, 2
SMD 10 PMR, 9 SMD 7 additional SMD with SUL mean due to the lower variation of the SUL mean 5 T PERCIST SUL
peak/ 1 T PERCIST
SUL peak 0,77 0,35 to 1 1 5%
17 PMR, 2
SMD 16 PMR, 3 SMD differences in hottest/non hottest targets evolution 5 T EORTC SUV bsa
max/ 1 T EORTC SUV
bsa max 0,31 -0,27 to 0,9 3 16%
17 PMR, 2
SMD 16 PMR, 3 SMD differences in hottest/non hottest targets evolution 5 T: EORTC SUV bsa
max/ EORTC SUV bsa
mean 0,77 0,35 to 1 1 5%
17 PMR, 2
SMD 16 PMR, 3 SMD lower variation of SUV bsa mean 5 T: PERCIST SUL
peak/RECIST 1.1 0,012 -0,01 to 0,13 9 47% 17 PMR, 2 SMD 5 PMR, 14 SMD much more SMD with RECIST 1.1 5 T: EORTC SUV bsa
max/ RECIST1.1 0,088 -0,043 to 0,22 11 58% 17 PMR, 2 SMD 5 PMR, 14 SMD much more SMD with RECIST 1.1 C: criteria, D: Disagreement, R: response, T: target
PET indices intra-observer variability D.
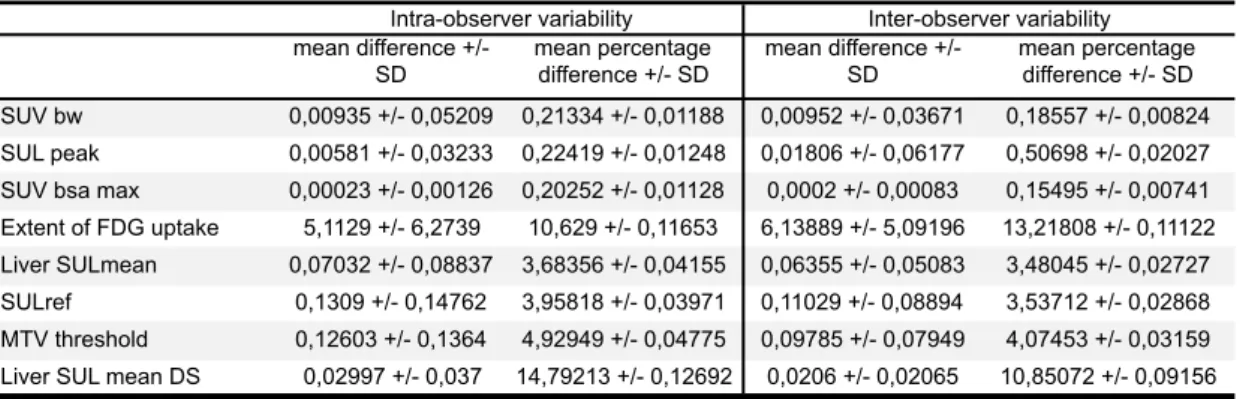
We evaluated the intra-observer variability of different PET indices of the hottest target. The mean differences and the mean percentage differences for each value are summarized in Table 6.
The variability was very weak for the SUV bw, SUL peak, SUV bsa max (around 0,2% for the mean percentage difference). The variability was slightly higher but still weak for Liver SUL mean, SULref and MTV threshold (around 3,5-5% for the mean percentage difference). The variability was clearly higher for the extent of FDG uptake, which is used in EORTC criteria, and for the liver SUL mean DS (respectively 10,6% and 14,8% for the mean percentage difference). Even if the Liver SUL mean DS had a higher variability, it didn’t have a significant impact on the SULref and the MTV threshold variability (which remained weak), due to the low value of Liver SUL mean DS.
PET indices inter-observer variability E.
The mean differences and the mean percentage differences for each value are summarized in Table 6.
The inter-observer variability was largely similar to intra-observer variability: very weak for the SUV bw, SUL peak, SUV bsa max (around 0,2-0,5% for the mean percentage difference), slightly higher for the Liver SUL mean, SULref and MTV threshold (around 3,5-4%), and higher for the extent of FDG and the liver SUL mean DS (around 11-13%).
Table 6. PET indices intra-observer and inter-observer variability
mean difference +/- SD mean percentage difference +/- SD mean difference +/- SD mean percentage difference +/- SD SUV bw 0,00935 +/- 0,05209 0,21334 +/- 0,01188 0,00952 +/- 0,03671 0,18557 +/- 0,00824 SUL peak 0,00581 +/- 0,03233 0,22419 +/- 0,01248 0,01806 +/- 0,06177 0,50698 +/- 0,02027
SUV bsa max 0,00023 +/- 0,00126 0,20252 +/- 0,01128 0,0002 +/- 0,00083 0,15495 +/- 0,00741
Extent of FDG uptake 5,1129 +/- 6,2739 10,629 +/- 0,11653 6,13889 +/- 5,09196 13,21808 +/- 0,11122
Liver SULmean 0,07032 +/- 0,08837 3,68356 +/- 0,04155 0,06355 +/- 0,05083 3,48045 +/- 0,02727
SULref 0,1309 +/- 0,14762 3,95818 +/- 0,03971 0,11029 +/- 0,08894 3,53712 +/- 0,02868
MTV threshold 0,12603 +/- 0,1364 4,92949 +/- 0,04775 0,09785 +/- 0,07949 4,07453 +/- 0,03159
Liver SUL mean DS 0,02997 +/- 0,037 14,79213 +/- 0,12692 0,0206 +/- 0,02065 10,85072 +/- 0,09156
Intra-observer variability Inter-observer variability
IV. Discussion
In this study, we compared the intra and inter-observer reproducibility and the results of MR classification with the 2 internationally recognized PET criteria (PERCIST and EORTC criteria) in patients with metastatic bladder cancer treated in a phase 2 study.
The inter-observer agreement was better when evaluating the one hottest target than when evaluating the 5 hottest targets. The simplest method provides the most reproducible classification. The PERCIST criteria indicate that calculating only the one hottest target percentage could be sufficient: several studies have shown that changes in the SUV of primary tumors can quite accurately predict the outcomes in their nodal metastases, that a restricted dataset of fewer tumors is commonly adequate for response evaluation, and that the calculation is easier1 . The reasons for disagreement weren’t due to variability in lesion measures. The first disagreement was due to subjective confidence level in affirming the occurrence of a new lesion. The second disagreement with PERCIST5 SUL peak was due to variability in the way of measuring target liver size, resulting in a different RECIST 1.1 classification. PERCIST indicates that to classify as PMR you mustn’t have increase >30% in SUL or size of target or non-target lesions (i.e., no PD by RECIST). Therefore, in case of size increase (PD with RECIST), we decided to classify the disease as progressive, but we were uncertain about the way we were supposed to classify (stable or progressive disease). In our study, the CT scans were acquired without iodinated contrast, as is common practice in most of our country’s centers. The proper application of RECIST 1.1 is therefore more difficult, especially in the case of liver lesions. With EORTC5 SUV bsa max, the second disagreement resulted from a difference in the choice and number of assessed targets. The EORTC criteria don’t specify the overall number of targets to assess or the number of targets per organ; and therefore, PERCIST is probably more reproducible in this respect as it proposes assessment of up to 5 total targets and no more than 2 targets per organ.
The inter-criteria agreement was perfect between PERCIST SUL peak and EORTC SUV bsa max when evaluating 1 target, but there were 2 (11%) disagreements between PERCIST SUL peak and EORTC SUV bsa max when evaluating 5 targets, due either to the different thresholds or to the number of measured lesions. We also found variable disagreements between the methods proposed in the same criteria (EORTC SUV bsa max/ SUV bsa mean, PERCIST SUL peak/ TLG) and between TLG and MTV. For PERCIST5 SUL peak/ TLG-MTV, one disagreement was due to the fact that one target lesion changed between baseline and follow-up, the follow-up target was considerably larger, although the SUL peak was lower. For this patient, the TLG assessment was probably less accurate than PERCIST5 SUL peak, the use of the TLG of the total body might have prevented this misclassification.
The use of SUV bsa mean (or SUL mean) instead of SUV bsa max (or SUV mean) tended to result in more SMD classification: more SDM with EORTC5 SUV bsa mean than EORTC5 SUV bsa max, and more SMD with TLG SUL mean than with TLG SUV mean. The concordance between PERCIST using SUL peak versus (vs) SUL mean was lower than EORTC using SUV bsa max vs SUV
bsa mean. This could be due, in part, to the lower values of SUL than of SUV. This resulted in lower percentage variation with SUL mean than with SUV bsa mean. Therefore, the same threshold level doesn’t necessarily correspond to the same level of response with SUL mean or SUV mean.
The agreement was poor between PERCIST5 or EORTC5 and RECIST 1.1, with much more SMD when using RECIST 1.1. The CTs were acquired without iodinated contrast, but this poor agreement is also probably due, at least in part, to the fact that MR can be observed earlier than anatomic response in many tumors3 . Furthermore, we chose the targets according to their level of SUV and not because they were the largest or easiest targets to measure (but we believe this is the way most nuclear medicine physicians measure targets when assessing PET/CT).
The intra and inter-observer variability was very weak for SUV bw, SUL peak, and SUV bsa max, slightly higher but still weak for Liver SUL mean, SULref and MTV threshold, and clearly higher for the extent of FDG uptake, which is used in EORTC criteria, and for the liver SUL mean DS. Therefore, the use of the extent of FDG uptake might be lead to poorer inter-observer reproducibility; nevertheless, it didn’t have an impact on inter-observer agreement in our study. If the Liver SUL mean DS had a higher variability, it didn’t have a significant impact on the SULref and the MTV threshold variability (which remained weak), due to the low value of Liver SUL mean SD. The weak SULref variability (3,5%) didn’t result in a different number of lesions assessed with PERCIST between the 2 observers.
Of the 4 published studies evaluating agreement between PERCIST and EORTC criteria32, 55,
56, 18, a good to very good agreement between criteria was found, better than our 89% agreement
value for 2 of this studies. At least 3 of the studies didn’t use the 15% threshold decrease proposed by the EORTC criteria to define PMR after the 1st cycle of treatment, but they used the 25% threshold, which is nearer to the 30% threshold of PERCIST and could have favored a better agreement between criteria. Actually, the EORTC criteria propose a threshold of “15%-25 %” after 1 cycle of treatment, which can be interpreted in different ways. Nevertheless, the two disagreements we found in our study between PERCIST and EORTC criteria weren’t due to the use of a 15% threshold. Tateishi and al.18 compared the criteria for neoadjuvant assessment, they measured only the one hottest target lesion, this could have favored a better inter-criteria agreement.
• Among 29 consecutive patients with SCLC who had PET before and after therapy (chemotherapy +/- thoracic radiotherapy), Ziai et al.55 found no disagreement between EORTC and PERCIST criteria (5 targets) for intra-observer concordance (κ=1), and 1 disagreement for inter-observer concordance due to a calculation mistake (κ= 0.91)55 . Their inter-criteria agreement was better than our. However, they explained that in their image interpretation, the PMR was defined as a reduction of >25% after more than 1 treatment cycle, and we can suppose that they didn’t use the 15% threshold decrease proposed by the EORTC criteria after the 1st cycle of treatment.
PERCIST (only the one hottest lesion) criteria, scans were performed at baseline and after every fourth treatment cycle. They found agreement on best overall metabolic response (BOmR) between EORTC criteria and PERCIST in 87% of the patients (κ= 0.76), which was close to our results. Again, they didn’t need to use the EORTC 15 % PMR threshold; this could have favored a better agreement between criteria. In their study, EORTC criteria and PERCIST disagreed on the BOmR of 8 patients with either PMR or SMD. Our 2 disagreements were also between PMR and SMD.
• Among 60 patients with different solid malignant tumors - mainly colon and lung cancer - who underwent cytotoxic chemotherapy, Aras and al.56 found only 1 disagreement (κ= 0,976) between PERCIST and EORTC criteria classification: one patient was classified as PMD with EORTC criteria but SMD with PERCIST (98 % of agreement, better than our 89 %). The used EORTC thresholds are not indicated in their article and the number of assessed lesions was the same (5 lesions with up to 2 per organ) for EORTC and PERCIST evaluation.
•
Among 142 women with breast cancer who underwent PET before and after 2 cycles of neoadjuvant chemotherapy, Tateishi and al.18found only 2 disagreements (98,5% agreement, close to our 100% agreement with 1 target) between PERCIST and EORCT criteria classification. For these 2 patients, the disease was stable according to the EORTC criteria, whereas according to PERCIST 1.0, there was a PMR, because these two patients had Delta SUV max of 10% and 13% and Delta SUL peak of 32% and 30%. Again, they didn’t need to use the EORTC 15 % PMR threshold. In each patient, only the one hottest target lesion was selected to determine the response to therapy, and this could have favored a better agreement between criteria.The main limitation of our study is the small size of the patient population (n=12) and the resulting small number of evaluations with which to assess the inter-observer and inter-criteria agreement (n=19). A limitation for concordance assessment between MR and anatomical response was the absence of iodinated contrast for CT acquisition.
In our study, we mainly had PMR, SMD response, few PMD responses and no CMR response: it is therefore not representative of all the response categories and not representative of all the cancer responses. Categorizing as CMR or PMD might be more subjective and therefore less reproducible than to categorizing as PMR and SMD, as these last categories are mainly defined by objective numbers (percentage thresholds). Our 2 inter-observer disagreements with PERCIST5 were about PMD classifications. In the majority of our responses, the decreases that resulted in PMR classifications were high, and therefore slightly different inter-observer percentages didn’t have an impact on inter-observer classification.
Furthermore, PERCIST indicates that to evaluate PET MR, the difference between uptake period should be less than or equal to 15 mn. In our study the difference could be as high as 30 mn; a better caution on this parameter is therefore necessary during PET acquisition.
The new software dedicated to MR evaluation, with automatic calculation and appropriate PERCIST/EORTC units of measurements will simplify the MR assessment and the use of recognized PET criteria. This could favor a larger use of those criteria in clinical practice.
V. Conclusion
The inter-observer agreement was better with the simplest assessment method. The different ways of assessment proposed by the PERCIST and EORTC criteria don’t lead to a strictly identical classification. One single easy and widely-accepted method combined with harmonized PET acquisition procedures on a dedicated software would be useful for study comparisons and result reproducibility, and would help to extend the use of PET for MR evaluation.
VI. Appendix
PubMed Keywords used to find studies evaluating the value of MR in solid tumors in neoadjuvant therapies:
((((((((((neoadjuvant therapies[MeSH Terms]) OR neoaduvant therapies[Title/Abstract]) OR neoadjuvant treatment[MeSH Terms]) OR neoadjuvant treatment[Title/Abstract]) OR neoadjuvant therapy[MeSH Terms]) OR neoadjuvant therapy[Title/Abstract]) OR neoadjuvant treatments[MeSH Terms]) OR neoadjuvant treatments[Title/Abstract])) AND 18f fdg[MeSH Terms]) AND neoplasms[MeSH Terms]
PubMed Keywords used to find studies evaluating the value of MR to predict the follow up of metastatic solid tumors after therapy:
((((((((evaluation[Title/Abstract]) OR response[Title/Abstract]) OR assessment[Title/Abstract]) OR monitor[Title/Abstract]) OR monitoring[Title/Abstract]) OR treatment outcome[MeSH Terms])) AND fdg[Title/Abstract]) AND metastatic[Title/Abstract]
PubMed Keywords used to find studies evaluating the agreement between PERCIST and EORTC criteria:
((((PERCIST) OR EORTC)) AND (((((((((concordance) OR agreement) OR reproducibility of results[MeSH Terms]) OR reproducibility of findings[MeSH Terms]) OR compare[Title/Abstract]) OR comparing[Title/Abstract]) OR comparison[Title/Abstract]) OR interobserver) OR inter-observer)) AND fdg[Title/Abstract]
Examples of disagreements
Example of inter-observer disagreement (MIP PET1 on the left, lesions = retroperitoneal and pelvic nodes, see red arrows, MIP PET2 on the right): one observer considered a new liver lesion had appeared (PMD), the other observer had a doubt -all the other lesions had decreased and the lung uptake seemed to be a lung infection- and classified as PMR.
Example of inter-criteria disagreement between PERCIST5 SUL peak and EORTC5 SUV bsa max (MIP PET1 on the left, MIP PET2 on the right): the different number of target lesions (see red arrows), 1 with PERCIST5 (the sacrum lesion), 4 with the EORTC5 (sacrum, lung, pelvic nodes) resulted in a different percentage threshold (-33% with PERCIST vs -10% with the EORTC criteria).
VII. References
1. Wahl RL, Jacene H, Kasamon Y, Lodge MA. From RECIST to PERCIST: Evolving Considerations for PET response criteria in solid tumors. J Nucl Med Off Publ Soc Nucl Med. 2009 May;50 Suppl 1:122S – 50S.
2. Bos R. Biologic Correlates of 18Fluorodeoxyglucose Uptake in Human Breast Cancer Measured by Positron Emission Tomography. J Clin Oncol. 2002 Jan 15;20(2):379–87.
3. Skoura E, Datseris IE, Platis I, Oikonomopoulos G, Syrigos KN. Role of positron emission tomography in the early prediction of response to chemotherapy in patients with non--small-cell lung cancer. Clin Lung Cancer. 2012 May;13(3):181–7.
4. Young H, Baum R, Cremerius U, Herholz K, Hoekstra O, Lammertsma AA, et al. Measurement of clinical and subclinical tumour response using [18F]-fluorodeoxyglucose and positron emission tomography: review and 1999 EORTC recommendations. Eur J Cancer. 1999 Dec;35(13):1773–82.
5. Weber WA, Gatsonis CA, Mozley PD, Hanna LG, Shields AF, Aberle DR, et al. Repeatability of 18F-FDG PET/CT in Advanced Non-small Cell Lung Cancer: Prospective Assessment in Two Multicenter Trials. J Nucl Med [Internet]. 2015 Apr 23 [cited 2015 Aug 3]; Available from: http://jnm.snmjournals.org/cgi/doi/10.2967/jnumed.114.147728
6. Van den Abbeele AD. The Lessons of GIST--PET and PET/CT: A New Paradigm for Imaging. The Oncologist. 2008 Apr 1;13(Supplement 2):8–13.
7. Hyun SH, Ahn HK, Park YH, Im Y-H, Kil WH, Lee JE, et al. Volume-based metabolic tumor response to neoadjuvant chemotherapy is associated with an increased risk of recurrence in breast cancer. Radiology. 2015 Apr;275(1):235–44.
8. Koolen BB, Pengel KE, Wesseling J, Vogel WV, Vrancken Peeters M-JTFD, Vincent AD, et al. FDG PET/CT during neoadjuvant chemotherapy may predict response in ER-positive/HER2-negative and triple negative, but not in HER2-positive breast cancer. The Breast. 2013 Oct;22(5):691–7. 9. van Stiphout RGPM, Lammering G, Buijsen J, Janssen MHM, Gambacorta MA, Slagmolen P, et al. Development and external validation of a predictive model for pathological complete response of rectal cancer patients including sequential PET-CT imaging. Radiother Oncol J Eur Soc Ther Radiol Oncol. 2011 Jan;98(1):126–33.
10. Guillem JG, Ruby JA, Leibold T, Akhurst TJ, Yeung HW, Gollub MJ, et al. Neither FDG-PET Nor CT Can Distinguish Between a Pathological Complete Response and an Incomplete Response After Neoadjuvant Chemoradiation in Locally Advanced Rectal Cancer: A Prospective Study. Ann Surg. 2013 Aug;258(2):289–95.
11. Lordick F, Ott K, Krause B-J, Weber WA, Becker K, Stein HJ, et al. PET to assess early metabolic response and to guide treatment of adenocarcinoma of the oesophagogastric junction: the MUNICON phase II trial. Lancet Oncol. 2007 Sep;8(9):797–805.
12. Miyata H, Yamasaki M, Takahashi T, Murakami K, Tanaka K, Yukinori K, et al. Determinants of Response to Neoadjuvant Chemotherapy for Esophageal Cancer Using 18F-fluorodeoxiglucose Positron Emission Tomography (18F-FDG-PET). Ann Surg Oncol. 2013 Nov 8;21(2):575–82.
13. Tanvetyanon T, Eikman EA, Sommers E, Robinson L, Boulware D, Bepler G. Computed Tomography Response, But Not Positron Emission Tomography Scan Response, Predicts Survival After Neoadjuvant Chemotherapy for Resectable Non–Small-Cell Lung Cancer. J Clin Oncol. 2008 Oct 1;26(28):4610–6.
14. Andreou D, Boldt H, Pink D, Jobke B, Werner M, Schuler M, et al. Prognostic relevance of 18F-FDG PET uptake in patients with locally advanced, extremity soft tissue sarcomas undergoing
neoadjuvant isolated limb perfusion with TNF-α and melphalan. Eur J Nucl Med Mol Imaging. 2014 Feb 12;41(6):1076–83.
15. Costelloe CM, Macapinlac HA, Madewell JE, Fitzgerald NE, Mawlawi OR, Rohren EM, et al. 18F-FDG PET/CT as an Indicator of Progression-Free and Overall Survival in Osteosarcoma. J Nucl Med. 2009 Mar 1;50(3):340–7.
16. Kikuchi M, Nakamoto Y, Shinohara S, Fujiwara K, Yamazaki H, Kanazawa Y, et al. Early evaluation of neoadjuvant chemotherapy response using FDG-PET/CT predicts survival prognosis in patients with head and neck squamous cell carcinoma. Int J Clin Oncol. 2013 Jun;18(3):402–10. 17. Pengel KE, Koolen BB, Loo CE, Vogel WV, Wesseling J, Lips EH, et al. Combined use of 18 F-FDG PET/CT and MRI for response monitoring of breast cancer during neoadjuvant chemotherapy. Eur J Nucl Med Mol Imaging. 2014 Aug;41(8):1515–24.
18. Tateishi U, Miyake M, Nagaoka T, Terauchi T, Kubota K, Kinoshita T, et al. Neoadjuvant chemotherapy in breast cancer: prediction of pathologic response with PET/CT and dynamic contrast-enhanced MR imaging--prospective assessment. Radiology. 2012 Apr;263(1):53–63.
19. Ueda S, Saeki T, Shigekawa T, Omata J, Moriya T, Yamamoto J, et al. 18F-fluorodeoxyglucose positron emission tomography optimizes neoadjuvant chemotherapy for primary breast cancer to achieve pathological complete response. Int J Clin Oncol. 2012 Jun;17(3):276–82. 20. Dose-Schwarz J, Tiling R, Avril-Sassen S, Mahner S, Lebeau A, Weber C, et al. Assessment of residual tumour by FDG-PET: conventional imaging and clinical examination following primary chemotherapy of large and locally advanced breast cancer. Br J Cancer. 2010 Jan 5;102(1):35–41. 21. Koolen BB, Pengel KE, Wesseling J, Vogel WV, Vrancken Peeters M-JTFD, Vincent AD, et al. Sequential (18)F-FDG PET/CT for early prediction of complete pathological response in breast and axilla during neoadjuvant chemotherapy. Eur J Nucl Med Mol Imaging. 2014 Jan;41(1):32–40.
22. Ruby JA, Leibold T, Akhurst TJ, Shia J, Saltz LB, Mazumdar M, et al. FDG-PET assessment of rectal cancer response to neoadjuvant chemoradiotherapy is not associated with long-term prognosis: a prospective evaluation. Dis Colon Rectum. 2012 Apr;55(4):378–86.
23. Perez RO, Habr-Gama A, São Julião GP, Gama-Rodrigues J, Sousa AHS, Campos FG, et al. Optimal timing for assessment of tumor response to neoadjuvant chemoradiation in patients with rectal cancer: do all patients benefit from waiting longer than 6 weeks? Int J Radiat Oncol Biol Phys. 2012 Dec 1;84(5):1159–65.
24. Choi H, Yoon H, Kim TS, Oh JH, Kim DY, Kim S. Voxel-based dual-time 18F-FDG parametric imaging for rectal cancer: differentiation of residual tumor from postchemoradiotherapy changes. Nucl Med Commun. 2013 Dec;34(12):1166–73.
25. Martoni AA, Fabio FD, Pinto C, Castellucci P, Pini S, Ceccarelli C, et al. Prospective study on the FDG–PET/CT predictive and prognostic values in patients treated with neoadjuvant chemoradiation therapy and radical surgery for locally advanced rectal cancer. Ann Oncol. 2011 Mar 1;22(3):650–6.
26. Elliott JA, O’Farrell NJ, King S, Halpenny D, Malik V, Muldoon C, et al. Value of CT–PET after neoadjuvant chemoradiation in the prediction of histological tumour regression, nodal status and survival in oesophageal adenocarcinoma. Br J Surg. 2014 Dec 1;101(13):1702–11.
27. Vallböhmer D, Hölscher AH, Dietlein M, Bollschweiler E, Baldus SE, Mönig SP, et al. [18F]-Fluorodeoxyglucose-positron emission tomography for the assessment of histopathologic response and prognosis after completion of neoadjuvant chemoradiation in esophageal cancer. Ann Surg. 2009 Dec;250(6):888–94.
2011 Jan;253(1):56–63.
29. Swisher SG, Maish M, Erasmus JJ, Correa AM, Ajani JA, Bresalier R, et al. Utility of PET, CT, and EUS to identify pathologic responders in esophageal cancer. Ann Thorac Surg. 2004 Oct;78(4):1152–60; discussion 1152–60.
30. Lin NU, Guo H, Yap JT, Mayer IA, Falkson CI, Hobday TJ, et al. Phase II Study of Lapatinib in Combination With Trastuzumab in Patients With Human Epidermal Growth Factor Receptor 2-Positive Metastatic Breast Cancer: Clinical Outcomes and Predictive Value of Early [18F]Fluorodeoxyglucose Positron Emission Tomography Imaging (TBCRC 003). J Clin Oncol Off J Am Soc Clin Oncol. 2015 Aug 20;33(24):2623–31.
31. Cachin F, Prince HM, Hogg A, Ware RE, Hicks RJ. Powerful prognostic stratification by [18F]fluorodeoxyglucose positron emission tomography in patients with metastatic breast cancer treated with high-dose chemotherapy. J Clin Oncol Off J Am Soc Clin Oncol. 2006 Jul 1;24(19):3026– 31.
32. Skougaard K, Nielsen D, Jensen BV, Hendel HW. Comparison of EORTC criteria and PERCIST for PET/CT response evaluation of patients with metastatic colorectal cancer treated with irinotecan and cetuximab. J Nucl Med Off Publ Soc Nucl Med. 2013 Jul;54(7):1026–31.
33. Hendlisz A, Golfinopoulos V, Garcia C, Covas A, Emonts P, Ameye L, et al. Serial FDG– PET/CT for early outcome prediction in patients with metastatic colorectal cancer undergoing chemotherapy. Ann Oncol. 2012 Jul 1;23(7):1687–93.
34. Zhao F, Ding G, Huang W, Li M, Fu Z, Yang G, et al. FDG-PET Predicts Pain Response and Local Control in Palliative Radiotherapy With or Without Systemic Treatment in Patients With Bone Metastasis From Non-small-cell Lung Cancer. Clin Lung Cancer. 2015 Nov;16(6):e111–9.
35. Wang J, Wong KK, Piert M, Stanton P, Frey KA, Kong F-MS. Metabolic response assessment with (18)F-FDG PET/CT: inter-method comparison and prognostic significance for patients with non-small cell lung cancer. J Radiat Oncol. 2015;4(3):249–56.
36. Chen JL, Appelbaum DE, Kocherginsky M, Cowey CL, Rathmell WK, McDermott DF, et al. FDG-PET as a predictive biomarker for therapy with everolimus in metastatic renal cell cancer. Cancer Med. 2013 Aug;2(4):545–52.
37. Becherer A, De Santis M, Karanikas G, Szabó M, Bokemeyer C, Dohmen BM, et al. FDG PET is superior to CT in the prediction of viable tumour in post-chemotherapy seminoma residuals. Eur J Radiol. 2005 May;54(2):284–8.
38. Schmitt RJ, Kreidler SM, Glueck DH, Amaria RN, Gonzalez R, Lewis K, et al. Correlation between early 18F-FDG PET/CT response to BRAF and MEK inhibition and survival in patients with BRAF-mutant metastatic melanoma. Nucl Med Commun. 2016 Feb;37(2):122–8.
39. Gayed I, Vu T, Iyer R, Johnson M, Macapinlac H, Swanston N, et al. The role of 18F-FDG PET in staging and early prediction of response to therapy of recurrent gastrointestinal stromal tumors. J Nucl Med Off Publ Soc Nucl Med. 2004 Jan;45(1):17–21.
40. Dingemans A-MC, de Langen AJ, van den Boogaart V, Marcus JT, Backes WH, Scholtens HTGM, et al. First-line erlotinib and bevacizumab in patients with locally advanced and/or metastatic non-small-cell lung cancer: a phase II study including molecular imaging. Ann Oncol Off J Eur Soc Med Oncol ESMO. 2011 Mar;22(3):559–66.
41. De Giorgi U, Mego M, Rohren EM, Liu P, Handy BC, Reuben JM, et al. 18F-FDG PET/CT findings and circulating tumor cell counts in the monitoring of systemic therapies for bone metastases from breast cancer. J Nucl Med Off Publ Soc Nucl Med. 2010 Aug;51(8):1213–8.
42. Kucuk ON, Soydal C, Lacin S, Ozkan E, Bilgic S. Selective intraarterial radionuclide therapy with Yttrium-90 (Y-90) microspheres for unresectable primary and metastatic liver tumors. World J Surg Oncol. 2011;9:86.
43. Gebhart G, Lamberts LE, Wimana Z, Garcia C, Emonts P, Ameye L, et al. Molecular imaging as a tool to investigate heterogeneity of advanced HER2-positive breast cancer and to predict patient outcome under trastuzumab emtansine (T-DM1): the ZEPHIR trial. Ann Oncol Off J Eur Soc Med Oncol ESMO. 2015 Nov 23;
44. Turkmen C, Ucar A, Poyanli A, Vatankulu B, Ozkan G, Basaran M, et al. Initial outcome after selective intraarterial radionuclide therapy with yttrium-90 microspheres as salvage therapy for unresectable metastatic liver disease. Cancer Biother Radiopharm. 2013 Sep;28(7):534–40.
45. De Giorgi U, Valero V, Rohren E, Dawood S, Ueno NT, Miller MC, et al. Circulating tumor cells and [18F]fluorodeoxyglucose positron emission tomography/computed tomography for outcome prediction in metastatic breast cancer. J Clin Oncol Off J Am Soc Clin Oncol. 2009 Jul 10;27(20):3303–11.
46. Bachner M, Zucali P, Horwich A, Oechsle K, Loriot Y, Flechon A, et al. 2-18fluoro-deoxy-d-glucose positron emission tomography (FDG-PET) for postchemotherapy seminoma residuals: A retrospective validation of the SEMPET trial. ASCO Meet Abstr. 2010 May 20;28(15_suppl):4581. 47. Ordu C, Selcuk NA, Erdogan E, Angin G, Gural Z, Memis H, et al. Does early PET/CT assesment of response to chemotherapy predicts survival in patients with advanced stage non-small-cell lung cancer? Medicine (Baltimore). 2014 Dec;93(28):e299.
48. Byström P, Berglund A, Garske U, Jacobsson H, Sundin A, Nygren P, et al. Early prediction of response to first-line chemotherapy by sequential [18F]-2-fluoro-2-deoxy-D-glucose positron emission tomography in patients with advanced colorectal cancer. Ann Oncol Off J Eur Soc Med Oncol ESMO. 2009 Jun;20(6):1057–61.
49. Kollmannsberger C, Oechsle K, Dohmen BM, Pfannenberg A, Bares R, Claussen CD, et al. Prospective comparison of [18F]fluorodeoxyglucose positron emission tomography with conventional assessment by computed tomography scans and serum tumor markers for the evaluation of residual masses in patients with nonseminomatous germ cell carcinoma. Cancer. 2002 May 1;94(9):2353–62. 50. Sabet A, Meyer C, Aouf A, Sabet A, Ghamari S, Pieper CC, et al. Early post-treatment FDG PET predicts survival after 90Y microsphere radioembolization in liver-dominant metastatic colorectal cancer. Eur J Nucl Med Mol Imaging. 2015 Mar;42(3):370–6.
51. Groheux D, Espié M, Giacchetti S, Hindié E. Performance of FDG PET/CT in the clinical management of breast cancer. Radiology. 2013 Feb;266(2):388–405.
52. Boellaard R. Standards for PET Image Acquisition and Quantitative Data Analysis. J Nucl Med. 2009 May 1;50(Suppl 1):11S – 20S.
53. Boellaard R, O’Doherty MJ, Weber WA, Mottaghy FM, Lonsdale MN, Stroobants SG, et al. FDG PET and PET/CT: EANM procedure guidelines for tumour PET imaging: version 1.0. Eur J Nucl Med Mol Imaging. 2010 Jan;37(1):181–200.
54. Boellaard R, Delgado-Bolton R, Oyen WJG, Giammarile F, Tatsch K, Eschner W, et al. FDG PET/CT: EANM procedure guidelines for tumour imaging: version 2.0. Eur J Nucl Med Mol Imaging. 2015 Feb;42(2):328–54.
55. Ziai D, Wagner T, El Badaoui A, Hitzel A, Woillard JB, Melloni B, et al. Therapy response evaluation with FDG-PET/CT in small cell lung cancer: a prognostic and comparison study of the PERCIST and EORTC criteria. Cancer Imaging Off Publ Int Cancer Imaging Soc. 2013;13:73–80. 56. Aras M, Erdil TY, Dane F, Gungor S, Ones T, Dede F, et al. Comparison of WHO, RECIST 1.1, EORTC, and PERCIST criteria in the evaluation of treatment response in malignant solid tumors. Nucl Med Commun. 2015 Oct 5;