HAL Id: hal-00327908
https://hal.archives-ouvertes.fr/hal-00327908
Submitted on 2 Sep 2004HAL is a multi-disciplinary open access
archive for the deposit and dissemination of sci-entific research documents, whether they are pub-lished or not. The documents may come from teaching and research institutions in France or abroad, or from public or private research centers.
L’archive ouverte pluridisciplinaire HAL, est destinée au dépôt et à la diffusion de documents scientifiques de niveau recherche, publiés ou non, émanant des établissements d’enseignement et de recherche français ou étrangers, des laboratoires publics ou privés.
Evaluation of SHADOZ sondes, HALOE and SAGE II
ozone profiles at the tropics from SAOZ UV-Vis remote
measurements onboard long duration balloons
François Borchi, Jean-Pierre Pommereau, Anne Garnier, Manuel Pinharanda
To cite this version:
François Borchi, Jean-Pierre Pommereau, Anne Garnier, Manuel Pinharanda. Evaluation of SHADOZ sondes, HALOE and SAGE II ozone profiles at the tropics from SAOZ UV-Vis remote measurements onboard long duration balloons. Atmospheric Chemistry and Physics Discussions, European Geo-sciences Union, 2004, 4 (5), pp.4945-4997. �hal-00327908�
ACPD
4, 4945–4997, 2004SAOZ UV-Vis remote measurements F. Borchi et al. Title Page Abstract Introduction Conclusions References Tables Figures J I J I Back Close
Full Screen / Esc
Print Version Interactive Discussion
© EGU 2004
Atmos. Chem. Phys. Discuss., 4, 4945–4997, 2004 www.atmos-chem-phys.org/acpd/4/4945/
SRef-ID: 1680-7375/acpd/2004-4-4945 © European Geosciences Union 2004
Atmospheric Chemistry and Physics Discussions
Evaluation of SHADOZ sondes, HALOE
and SAGE II ozone profiles at the tropics
from SAOZ UV-Vis remote measurements
onboard long duration balloons
F. Borchi, J.-P. Pommereau, A. Garnier, and M. Pinharanda
Service d’A ´eronomie, CNRS, Verri `eres le Buisson, France
Received: 29 May 2004 – Accepted: 6 August 2004 – Published: 2 September 2004 Correspondence to: F. Borchi ([email protected])
ACPD
4, 4945–4997, 2004SAOZ UV-Vis remote measurements F. Borchi et al. Title Page Abstract Introduction Conclusions References Tables Figures J I J I Back Close
Full Screen / Esc
Print Version Interactive Discussion
© EGU 2004
Abstract
Long series of ozone profiles from 6 to 28 km at the Southern Tropics have been ob-tained from solar occultation measurements at twilight using a SAOZ spectrometer borne by long duration balloons. Two flights have been performed from Bauru in Brazil both in the summer, in February and March 2001 and 2003, from where the balloons
5
are moving westward at almost constant latitude (20◦±5◦S). The flight in 2001 passed right over Reunion Island where the SAOZ measurements could be compared to those of both tropospheric and stratospheric ozone lidars. In the stratosphere, compared to that of SAOZ, the measurements of the SHADOZ ozonesondes network, and the HALOE and SAGE II instruments in orbit are found a little noisier (2–3% for SAGE II, 3–
10
4% for HALOE, 4–5% for the sondes), and of insignificant or small high biased (SAGE II). No differences in altitude could be found between SAOZ and SAGE II at all levels, and HALOE above 22 km. But the ozonesondes appear to be systematically displaced upwards by some 400–700 m at all levels, and the HALOE profiles do show an increas-ing altitude bias at decreasincreas-ing altitude below 22 km. In the upper troposphere, the
15
SAOZ measurements are found consistent with those of the sondes at Reunion Island and high biased on average over the Western Pacific, at American Samoa and Fiji. Compared to SAOZ, SAGE II shows a 50–60% low bias similar to that already found with the ozonesondes, and a 2–2.5 times larger zonal variability, suggesting a degra-dation of its precision below the tropopause. Finally, the unrealistic large offsets and
20
variability in the HALOE data compared to all others suggest that its measurements are no reliable in the tropical troposphere below 17 km.
1. Introduction
The ozone distribution in the tropical upper troposphere and lower stratosphere (UT/LS) is the result of a combination of transport and chemical mechanisms. Among
25
ACPD
4, 4945–4997, 2004SAOZ UV-Vis remote measurements F. Borchi et al. Title Page Abstract Introduction Conclusions References Tables Figures J I J I Back Close
Full Screen / Esc
Print Version Interactive Discussion
© EGU 2004
(Dessler et al., 1995), deep convection in the troposphere (Dessler, 2002) and slow Brewer-Dobson circulation above, gas phase reactions with imported species such as NOx or COVs emitted at the surface (Jeker et al., 2000), heterogeneous reactions on thin cirrus (Solomon et al., 1997), NOx production by lightning (Jeker et al., 2000), etc. However, the understanding of the relative contribution of each of the processes is still
5
limited, largely because of the lack of reliable global scale data in the UTLS. Though remote ozone profile measurements from space platforms are available for a long time, the Stratospheric Aerosols and Gaz Experiment II (SAGE II) since 1984 (Mauldin et al., 1985) and the HALogen Occultation Experiment (HALOE), since 1991 (Russell et al., 1993), their performances near or below the high tropical tropopause are still
de-10
bated. To fill-in the gap, an ozonesonde network was initiated in 1998, the Southern Hemisphere ADditional OZonesondes (SHADOZ) project, involving now eleven sta-tions distributed throughout the tropics and subtropics (Thompson et al., 2003a).
Here we report on series of remote sensing ozone measurements from long dura-tion balloons carrying a SAOZ UV-Visible spectrometer flown in 2001 and 2003 at the
15
Southern Tropics during the SH summer season from Brazil and circum-navigating at almost constant latitude. This new independent data set is being used to study the performances of both space-borne instruments and sondes.
The following section provides a description of the SAOZ measurements and an es-timation of the precision, accuracy, and altitude registration of the retrieved profiles
20
checked by direct comparison with tropospheric and stratospheric ozone lidar mea-surements during the pass of the balloon over the Network for Detection of Strato-spheric Change (NDSC) station of Reunion Island in the Indian Ocean. Following in Sect. 3 is the comparison of the SAOZ measurements with those of the SHADOZ sonde stations, then with those of HALOE v19 and with those of the v6.1 and v6.2
25
versions of the SAGE II retrieval algorithms. The relative performances of all systems in the tropical UTLS are summarised in Sect. 4.
ACPD
4, 4945–4997, 2004SAOZ UV-Vis remote measurements F. Borchi et al. Title Page Abstract Introduction Conclusions References Tables Figures J I J I Back Close
Full Screen / Esc
Print Version Interactive Discussion
© EGU 2004
2. SAOZ ozone profiles at the tropics
SAOZ is a diode array UV-Visible spectrometer originally designed for the monitoring total ozone and nitrogen dioxide by the zenith-sky technique from the ground (Pom-mereau and Goutail, 1988), declined in a balloon version for remote profile measure-ments by solar occultation (Pommereau and Piquard, 1994). In a further development,
5
a long duration version has been designed which could be carried on an Infra-Red Montgolfier balloon (MIR) developed by the Centre National d’Etudes Spatiales (CNES) (Malaterre et al., 1996), after an idea of Pommereau and Hauchecorne, (1979).
The data in use here are those obtained during two flights at the tropics launched two years apart at 22◦S in Brazil, on 13 February 2001 and 23 February 2003 in
10
preparation of a HIBISCUS project planned in 2004 for investigating the impact of deep convection on the composition of the UTLS. The first lasted in flight for 34 days and two circumnavigations resulting in 54 useful profiles (half at sunrise, half at sunset) at almost constant latitude (20◦±5◦S), before falling in Argentina where it was recovered. The second lasted for 9 days only, also at almost constant latitude (22◦±2◦S), providing
15
11 useful profiles across the Pacific before being lost over a hurricane in the Coral Sea. 2.1. SAOZ ozone measurements
Ozone is measured in the visible Chappuis bands in the 450–620 nm spectral range where the absorption cross-sections are independent of temperature and known to within 2%. Profiles are retrieved by onion peeling, where the light path is calculated
20
by ray tracing from a 3-D GPS location known to within 10 m and a time set to within 0.1 s. Compared to a satellite, the advantage of a balloon moving slowly is to allow the exposure to vary from 0.5 s to 52 s for compensating the strong increase of attenuation at low tangent height, allowing the measurements to be continued down to cloud top or to about 6 km in clear conditions.
ACPD
4, 4945–4997, 2004SAOZ UV-Vis remote measurements F. Borchi et al. Title Page Abstract Introduction Conclusions References Tables Figures J I J I Back Close
Full Screen / Esc
Print Version Interactive Discussion
© EGU 2004
2.1.1. SAOZ long duration balloon payload
The version of the SAOZ instrument in use here is combination of a flat field holographic grating and a 1024 diode-array detector providing spectral measurements of 1.1nm resolution in the 300–650 nm spectral range. There is no sun tracker. Sunlight just enters into the entrance slit after reflection on a cone oriented downwards and three
5
diffusers, defining a field of view of 360◦azimuth and −10◦,+10◦elevation, as illustrated in Fig. 1. Measurements are performed during twilight periods only from 89◦to 95◦SZA with a duration of exposure, controlled by the CPU, varying from 0.5 s to 52 s. Because of limited telemetry capacity, they are not repeated continuously but at constant tangent height steps of 0.7 km. The spectral data are both analysed onboard and stored in
10
memory in case of recovery. Only the results of spectral retrieval (column density and fitting error of O3, NO2, O4, O2, tropospheric H2O and solar flux at three wavelengths) are transmitted by the ARGOS satellite collection system.
Ancillary measurements also transmitted include 3-D location by GPS, pressure and temperature using Va¨ısala radiosonde sensors (temperature useless at float at high
al-15
titude during daytime because of solar heating), spectral (exposure, wavelength shift) and housekeeping (internal temperatures, voltage) parameters. The payload is pow-ered by lithium batteries (not rechargeable) for duration of about one month. Its total weight is 28 kg.
2.1.2. Spectral analysis
20
The spectral retrieval is based on a sequential and iterative differential absorption re-gression technique by comparison to a reference spectrum recorded at high sun and high altitude. The performances of the algorithm have been often compared to those of other UV-Visible systems (Roscoe et al., 1999). Ozone is measured in the 450–620 nm spectral range using absorption cross-sections measured in the laboratory by Brion et
25
al., (1998) of 1.5% quoted accuracy, shown to be independent of temperature within 1%. No significant difference in ozone has been found between the results of the
on-ACPD
4, 4945–4997, 2004SAOZ UV-Vis remote measurements F. Borchi et al. Title Page Abstract Introduction Conclusions References Tables Figures J I J I Back Close
Full Screen / Esc
Print Version Interactive Discussion
© EGU 2004
board retrieval and those of the post flight re-analysis of the data stored in memory in the 2001 payload recovered in Argentina. In both cases, the fitting error on the slant column is 5e17mol/cm2(0.5% at the ozone maximum at 25 km) almost constant during the occultation down to 15 km, and increasing up to 2e18 mol/cm2 (about 2%) at the bottom of the measurements at 6 km.
5
2.1.3. Profile retrieval
Profiles are retrieved by an onion peeling technique within 1 km atmospheric shells af-ter calculating light paths by ray tracing. The residual ozone in the reference spectrum is determined from the measurement at 89◦SZA on the first day of flight when the MIR still inflated with helium is floating at 34 km. The random uncertainty (precision) is that
10
of the slant column density given by the spectral fitting propagated in the retrieval pro-cess. On average, it varies from 1.2% at 25 km at the altitude of the ozone maximum, to 2% at 20 km, 5% at the tropopause at 17.5 km, 10 % at 15 km, 23% at 10 km and 33 % at 7 km.
The altitude is a geometric altitude. Its accuracy is directly related to that of the GPS
15
3D location and clock (±100 m and 0.1 s in 2001, improved to ±10 m and 0.1 s in 2003 after removal of scramble in the GPS system) from which the SZA at the location of the balloon and then the tangent height, are derived. The vertical resolution is limited by the size of sun as seen from the balloon: 1.4 km FWHM. Pressure and temperature are those given by the ECMWF operational analyses (6 h, T106, 2◦×2◦, 60 levels)
20
at the location of the tangent point at 20 km. In excellent agreement (0.5±0.4 hPa, −1.2◦±1.9◦C) with that measured at the altitude of the balloon in the stratosphere, they differ a little (1.3±1.1 hPa, 1.7◦±4.2◦C) in the tropopause region below 19 km where the measured temperature when the balloon it descending at low altitude at night over high clouds, is found colder than that of the analysis. But the difference in altitude of a
25
density level never exceeds 150m.
Finally, clouds are removed by looking at the atmospheric extinction at 615 nm. The profile is cut when the atmospheric extinction along the line of site exceeds that of
ACPD
4, 4945–4997, 2004SAOZ UV-Vis remote measurements F. Borchi et al. Title Page Abstract Introduction Conclusions References Tables Figures J I J I Back Close
Full Screen / Esc
Print Version Interactive Discussion
© EGU 2004
Rayleigh attenuation by 0.2 (cloud optical thickness of 1×10⁻³km−1), that of a thin cirrus. In the absence of clouds, profiles could be retrieved down to 6 km. Otherwise they are cut immediately above the cloud layer observed occasionally up to 19 km. All clouds have been removed in the following.
2.2. Summary of measurements at the tropics in 2001 and 2003
5
Two flights have been performed, both in February and March during the summer sea-son, the first in 2001 for testing the flight of a MIR balloon at the southern tropics, and the second two years later in 2003 for preparing a future HIBISCUS project and validating the measurements of the chemistry instruments of ENVISAT. The balloons operated by the CNES were launched from the balloon facility of the Insitute of
Me-10
teorological Research (IPMet) of the State University of Sao Paulo (UNESP) located at Bauru at 22◦S, 49◦W. The balloons of 45 000 m3 volume, were carrying a CNES service payload controlling the flight (balloon technical parameters, safety systems, cut down below 16 km, GPS, pressure, temperature, and global IR radiometer) and the SAOZ gondola 50 m below, totally independent of the service system. The total weight
15
of the system was about 60 kg.
The MIRs are hot air balloons heated by the Earth radiation only at night and the sun during daytime. Therefore, their altitude varies from 26–28 km during the day to 18– 24 km before sunrise depending on the cloud cover. However, since they are inflated with helium for their first ascent, they are flying at higher altitude during the first three
20
days, 34 km on the first morning, the time required to loose totally the additional the helium.
Figure 2 shows the trajectories of the balloons in the summer stratospheric Easterlies and the ozone profiles recorded along their flights at sunset (red) and sunrise (blue), the few profiles starting at high altitude being those of the first days. The flight of 2001
25
travelled twice around the world at almost constant latitude (20◦±5◦S) before falling over Northern Argentina over a thunderstorm after 34 days, where it was recovered.
ACPD
4, 4945–4997, 2004SAOZ UV-Vis remote measurements F. Borchi et al. Title Page Abstract Introduction Conclusions References Tables Figures J I J I Back Close
Full Screen / Esc
Print Version Interactive Discussion
© EGU 2004
However, because of the end of the lithium batteries, the SAOZ stopped functioning after 28 days over the middle of the Indian Ocean. The flight of 2003 travelled for 9 days only before falling over a hurricane, Erika, in the Coral Sea a little East of Australia, where it was lost.
The ozone concentration along the flight is almost constant in the lower stratosphere,
5
but highly variable in the upper troposphere between 12 and 19 km, the profile depart-ing the most from the mean bedepart-ing that observed near the hurricane showdepart-ing a remark-able shift upwards up to 19 km.
2.3. Validation over Reunion Island
The 2001 flight passed close to the NDSC complementary station of Reunion Island,
10
where three instruments could be activated for simultaneous measurements: a tropo-spheric ozone lidar (Baray et al., 1999), a dial stratotropo-spheric ozone lidar (Portafaix et al., 2003) and a dedicated ozonesonde ascent, offering altogether an excellent opportunity for checking the SAOZ measurements. Since other ascents of the SHADOZ network are available along the balloon flights, the comparison with the ozonesonde will not be
15
considered here, but together with the others in the next section. Lidar measurements only will be compared, which unique characteristic is to provide a precise check of the altitude registration.
Because of the presence of clouds associated to the ITCZ, measurements are di ffi-cult during the summer season. The MIR passed almost right above Reunion Island on
20
the afternoon of 24 February. Its closest measurements are those of the morning and the evening of the same day when the tangent points at 20 km were located respec-tively at 22◦S, 70.7◦E (1400 km East of the station) and 21.2◦S, 51◦E (400 km West). The first was performed in clear sky down to 7 km, while the second stopped at 16 km because of the presence of high level clouds. The stratospheric ozone lidar could be
25
activated for 168 min during the evening of 23 February, while the tropospheric lidar performed during the night but from 3 to 8 km only.
ACPD
4, 4945–4997, 2004SAOZ UV-Vis remote measurements F. Borchi et al. Title Page Abstract Introduction Conclusions References Tables Figures J I J I Back Close
Full Screen / Esc
Print Version Interactive Discussion
© EGU 2004
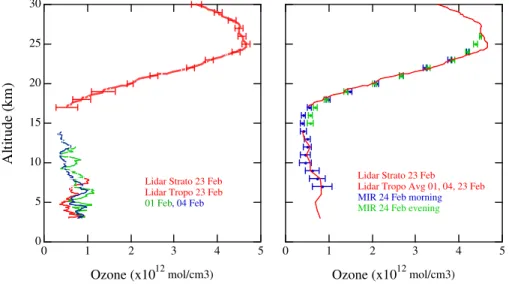
tropospheric profiles performed earlier in the month, on 1 and 4 February reaching higher altitudes. Also shown in the plot is the shot noise of the stratospheric lidar, ev-ery km only for clarity. A drop could be seen in the error bars at 20 km at the transition between lower and higher channels. The uncertainty of the tropospheric ozone lidar is estimated to 10 ppb (7 mol/cm3 at 10 km, about 10%) (Baray et al., 1999). Figure 3b
5
shows the comparison between lidar and SAOZ measurements with the indication of actual SAOZ random errors and Figure 4, the percent difference between them com-pared to total random error (lidar and SAOZ) in the stratosphere and that of SAOZ alone in the troposphere.
Overall, the agreement is excellent. There is no indication of systematic deviation
10
in concentration or altitude registration at all levels, except at 25 km where the peak reported by the lidar is not be observed by SAOZ. The likely explanation for that is the relatively poor vertical (1.4 km FWHM) and horizontal (220 km) resolutions of SAOZ compared to the 100 m of the lidar. Another possible contribution could be the presence of a filament from mid-latitude as suggested by the high resolution MIMOSA contour
15
advection model (Hauchecorne et al., 2002). 2.4. Ozone variability along a latitudinal circle
Figure 5 shows the variability (standard deviation compared to the mean) of ozone con-centration at constant altitude along the flight track in 2001 and 2003. Above 17 km, the figures are very similar on both years, ozone being very little variable in the
strato-20
sphere, while in the upper troposphere, the variability over the Pacific only in 2003 is smaller than over the entire globe in 2001. Asides from random errors, several mech-anisms could contribute: horizontal and vertical transport, convective lifting of ozone poor air from the surface, photochemical production by precursors from biomass burn-ing etc. resultburn-ing in large variations in tropospheric ozone concentration. Among
oth-25
ers, a well-known feature of upper tropospheric ozone in the tropics is the wave number one distribution displaying a maximum over the Atlantic and a minimum over Western Pacific (Thompson et al., 2003b).
ACPD
4, 4945–4997, 2004SAOZ UV-Vis remote measurements F. Borchi et al. Title Page Abstract Introduction Conclusions References Tables Figures J I J I Back Close
Full Screen / Esc
Print Version Interactive Discussion
© EGU 2004
Though the study of the mechanisms controlling the ozone distribution in the tropics is out of scope of this paper, a brief study is shown allowing to identify which part of the variability could be attributed to geophysical changes and which part to measurement errors. The reasons for the ozone variability observed by SAOZ has been explored by correlating measured concentration to several proxies: the variation of the altitude of
5
isentropic surfaces indicative of vertical isentropic displacement, potential vorticity (PV) on isentropic surfaces indicative of horizontal transport and stratosphere-troposphere exchange in the UT, and the thickness of the 340–370 K layer, a proxy of instability and convection. All above parameters are derived from ECMWF operational analyses (6 h, T106, 2◦×2◦, 60 levels) interpolated at the location of the SAOZ tangent points, PV
10
being further calculated using a high-resolution contour advection model (Hauchecorne et al., 2002).
Figure 6 shows the results of subtracting each contribution by a multi-linear regres-sion from the variability observed in 2001.
(a) is the standard deviation of concentration at constant altitude levels;
15
(b) is that calculated on isentropic surfaces;
(c) is the residual after removing horizontal transport by correlation with PV; (d) is remaining variability after removing also vertical convective transport, and (e) is the average SAOZ random error given by the retrieval process.
On average, the thermal tropopause is located at 16 km, while the cold point
20
tropopause is about 1.5–2 km above. At all levels above 12 km the largest contribu-tion to ozone variability is that of horizontal exchange. Conveccontribu-tion becomes more important only below that level. As expected, its impact stops at 19 km, the top of the Tropical Tropopause Layer (TTL).
Table 1 shows a comparison between the variability observed initially at constant
25
altitude, the residual after removing the various contributions and SAOZ random er-rors. The last are of about the same amplitude above 17 km indicating that the random errors are likely well evaluated. However, the precision becomes worse than the ob-served residual in the upper troposphere. This could indicate the presence of some
ACPD
4, 4945–4997, 2004SAOZ UV-Vis remote measurements F. Borchi et al. Title Page Abstract Introduction Conclusions References Tables Figures J I J I Back Close
Full Screen / Esc
Print Version Interactive Discussion
© EGU 2004
systematic error in the analyses of the SAOZ spectra in the troposphere, very likely an interference with water vapour whose absorption bands in the visible are still uncertain. The actual SAOZ precision in the upper troposphere is probably of the order of 6–7% while, because of this additional systematic error, its accuracy would be of the order 6% at 15 km and 15% at 10 km.
5
2.5. Conclusions
Long series of ozone profiles have been derived at the tropics at almost constant lati-tude (20◦±5◦S) during the summer season in February–March 2001 (54 profiles along one and a half turn around the globe) and February 2003 (11 profiles over the Pacific). The profiles extend from 28 km to cloud top or 6 km in clear sky with a vertical
resolu-10
tion of 1.4 km and a precision in geometric altitude, checked by comparison with lidars of ±100 m. The estimated precision of the measurements is better than 2% in the stratosphere above 20 km and 6–7% in the upper troposphere, while the total accuracy of 3.5% in the stratosphere, degrades with altitude in the troposphere from about 12% at 15 km to 25% at 10 km.
15
3. Comparisons with SHADOZ, HALOE, and SAGE II
A number of ozone profiles at the latitude and during the period of the MIR flights in 2001 and 2003 are available from the SHADOZ ozonesonde network as well as from two NASA space instruments, HALOE onboard UARS and SAGE II onboard ERBE. The comparison with those of SAOZ allows studying the relative performances of each
20
of them.
3.1. SHADOZ ozone sonde network
SHADOZ (Southern Hemisphere ADditional OZonesondes) is an effort initiated by NASA in 1998 to develop a coordinated ozonesonde network at the tropics, putting
to-ACPD
4, 4945–4997, 2004SAOZ UV-Vis remote measurements F. Borchi et al. Title Page Abstract Introduction Conclusions References Tables Figures J I J I Back Close
Full Screen / Esc
Print Version Interactive Discussion
© EGU 2004
gether some 10–12 stations supported by in-country agencies or universities (Thomp-son et al., 2003a). Relevant stations at the latitude of the MIR flight are Reunion Island (21◦S, 55.5◦E) in the Indian Ocean and American Samoa (14.2◦S, 171◦W) and Fiji (18.1◦S, 178◦W) in Western Pacific.
Ozone measurements at SHADOZ sites are made with balloon-borne ECC
(electro-5
chemical concentration cell) ozonesondes coupled with a standard Va¨ısala radiosonde and a sensor for relative humidity. But, as various stations prepare their sondes and process the raw data differently, and as each sonde launched is a new instrument, eval-uating the precision and accuracy of SHADOZ data is not easy. According to Thomp-son et al. (2003a), (a) the Thomp-sonde precision is 5%; (b) integrated total ozone column
10
amounts from the sondes are usually to within 5% of independent measurements form ground-based instruments and overpass measurements from the TOMS satellite; (c) systematic variations in TOMS-sonde offsets and in ground-based-sonde offsets from station to station reflect biases in sonde technique as well as satellite retrieval; and fi-nally (d) there is evidence for a zonal wave-one pattern in total and tropospheric ozone,
15
but not in stratospheric ozone.
The data used in this study are taken from the SHADOZ databasehttp://croc.gsfc.
nasa.gov/shadoz/. Ozone partial pressure is converted in concentration in mol.cm−3 using radiosonde data. The altitude of the sondes is a geopotential altitude derived from pressure and temperature measurements of the radiosonde.
20
3.1.1. SHADOZ data selection
The sondes selected are those available in the database in February and March at each of the three stations in 2001 and at Samoa and Fiji only in 2003, since the MIR flew only across the Pacific. The dates of the ascents are displayed in Tables 2 and 3. In total, 19 are available in 2001 and 9 in 2003.
ACPD
4, 4945–4997, 2004SAOZ UV-Vis remote measurements F. Borchi et al. Title Page Abstract Introduction Conclusions References Tables Figures J I J I Back Close
Full Screen / Esc
Print Version Interactive Discussion
© EGU 2004
3.1.2. Statistical comparison
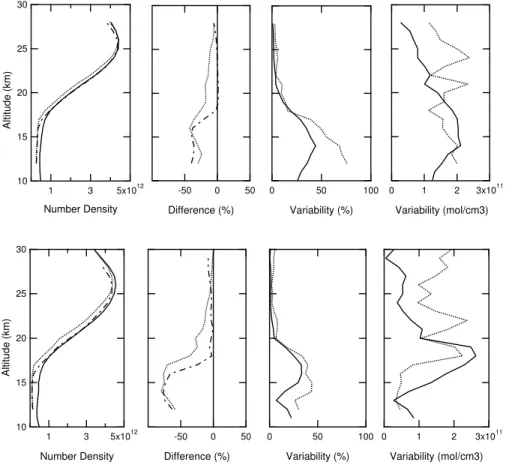
The comparison between ozonesonde and SAOZ mean profiles is shown in Fig. 7 (top for 2001 and bottom for 2003) and the results are summarized in Tables 4 and 5 for the stratosphere and the troposphere respectively.
Above 20 km in the stratosphere, the two profiles are very similar but shifted in
alti-5
tude. The relative difference (panel b) decreases with altitude. It almost vanishes for a shift of 500 m in 2001 and 700 m in 2003 (dashed-dotted lines of panel b), except above 25 km where a small low bias appears at levels where a correction for pump efficiency is applied, known to be a little uncertain. Still in the stratosphere, the vari-ability (standard deviation compared to the mean, panels c and d) of the ozonesondes
10
(5%) is a little larger than that of SAOZ (2%), very consistent with the respective known precision of both instruments.
In the upper troposphere, below 20 km, a low bias appears in the sondes compared to SAOZ, larger over the Pacific in 2003 than over the whole latitudinal circle in 2001. But since tropospheric ozone is known to vary by more than a factor 2 between the
15
Atlantic and the West Pacific (Thompson et al., 2003b), the statistical comparison is not valid. Individual comparisons only could be conclusive. However before doing so, noteworthy is the very similar amplitude of variability of both measurements in the stratosphere, shown to be largely of geophysical origin in the previous section and not to measurement errors.
20
3.1.3. Comparisons during MIR overpass above the SHADOZ stations
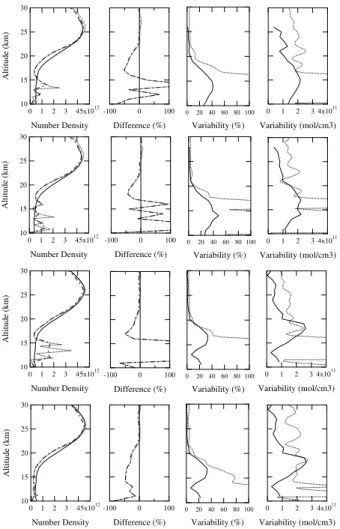
Table 6 shows the dates and time, latitude and longitude differences of the closest sondes and SAOZ measurements in 2001 and Fig. 8 the profiles below 20 km at each of the three stations (left panels) and on right the difference between the means of each instrument before and after shifting down the sondes by the optimum value in the
25
stratosphere (−400 m at Samoa and Reunion Island, −600 m at Fiji). Unfortunately, no ozonesondes closer than 8 days could be found in 2003. Therefore, no reliable
ACPD
4, 4945–4997, 2004SAOZ UV-Vis remote measurements F. Borchi et al. Title Page Abstract Introduction Conclusions References Tables Figures J I J I Back Close
Full Screen / Esc
Print Version Interactive Discussion
© EGU 2004
comparison is available in the troposphere.
The factor two in ozone concentration between Reunion and the Western Pacific stations is consistent with the March–April–May difference of tropospheric column re-ported by Thompson et al. (2003b). But the profiles also show how variable could be the ozone measured by the sondes in the South Pacific Convergence Zone, where
5
sometimes it could drop to zero in the upper troposphere inside or at the vicinity of deep convective cells (Kley et al., 1996). An example of such near-zero ozone in the upper troposphere could be seen at Fiji in Fig. 8.
On average, the difference between SAOZ and sondes (Table 7) is not significant at Reunion Island (in consistence with lidar comparisons shown in Sect. 2). However,
10
significant is the difference at Samoa and Fiji. A possible explanation for that is the ozone drop into convective clouds where the sondes could travel but where the SAOZ remote measurements could not be performed. Another contribution could be a sys-tematic underestimation of tropospheric ozone at Samoa and Fiji related to differences in sonde technique, as suggested by Thompson et al. (2003a).
15
3.1.4. Discussion and concluding remarks
In summary, the most striking feature between sondes and SAOZ measurements at the tropics is the difference of 400–700 m in their altitude registration. If corrected for this, the two data sets show no significant bias in number density in the stratosphere, as well as in the troposphere except in the deep convective area of Samoa and Fiji. They also
20
show a similar variability in ozone concentration, dominated by natural changes, except in the stratosphere where the 5% dispersion of the sondes exceeds the amplitude of atmospheric variability.
The question is thus the origin of the bias of altitude between the two data sets. The altitude of the SAOZ measurements relates to the geometric GPS reference. The
pre-25
cision of the retrieval was checked by comparison with collocated lidar measurements at Reunion Island, with which the difference in altitude does not exceed ±100 m. The altitude of the sondes is a geopotential altitude derived from pressure and temperature
ACPD
4, 4945–4997, 2004SAOZ UV-Vis remote measurements F. Borchi et al. Title Page Abstract Introduction Conclusions References Tables Figures J I J I Back Close
Full Screen / Esc
Print Version Interactive Discussion
© EGU 2004
measurements of the radiosonde. Though differences in altitude between radar and radiosonde data have been often reported suggesting systematic errors in the pres-sure meapres-surements at high altitude, e.g. 300 m (0.5 hPa) at 30 km (De Muer and De Backer, 1994b), density levels derived from the sondes, are identical within ±50 m to those calculated from pressure and temperature measurements on board the MIR.
5
Nothing could be found in these comparisons, which could explain differences as large as 400–700 m, which must be thus attributed to a time constant in the measurements of the ECC cell. For a balloon ascent rate of 5 m/s, this would correspond to a time lag of 80 to 140 s. The almost constant difference in altitude between the sonde and the SAOZ profiles shown in Fig. 7, which could be also described as a relative di
ffer-10
ence between the two measurements proportional to the ozone gradient, is consistent with that. A systematic error in pressure will result in the opposite: smaller impact at low than at high altitude. An error in the SAOZ profile retrieval, for example a wrong correction for refraction, would result in an increasing altitude difference at decreasing altitude, but not at a constant altitude shift.
15
The figure for the response time of the ECC sonde exceeds the 50 s for a 90% re-sponse of the ozonesondes generally quoted (WMO, 1998). However, recent compar-isons between ECC cells and UV photometer measurements in a simulation chamber during the JOSIE experiment, suggests that it could be larger. (Schmidlin, personal communication)
20
An important consideration is that those conclusions apply to the tropics only, where the ozone vertical gradient is large (3 mPa/km) and the natural variability very small (2%) in the stratosphere, allowing unusually precise statistical information. Finally and though the impact on ECC cells is unknown, it must be reminded that the first part of the ascent is performed at very high humidity and that the temperature at the tropopause
25
ACPD
4, 4945–4997, 2004SAOZ UV-Vis remote measurements F. Borchi et al. Title Page Abstract Introduction Conclusions References Tables Figures J I J I Back Close
Full Screen / Esc
Print Version Interactive Discussion
© EGU 2004
3.2. HALOE V19
The HALogen Occultation Experiment (HALOE) on board the Upper Atmosphere Re-search Satellite (UARS), launched in September 1991 and still operational, performs solar occultation measurements to infer high resolution mixing ratio profiles of trace gases (Russell et al., 1993). Ozone measurements are carried out in a channel
cen-5
tered at 9.6 µm. The geometry of the UARS orbit (57◦ inclination, circular and 585 km with orbit period of 96 min) results in 15 sunrises and 15 sunsets daily, with tangent point locations during a day generally confined to small latitude bands which cycle over varying extremes, roughly every 36 days. This measurement strategy provides good longitudinal coverage on two latitude circles each day, one corresponding to the
sun-10
rise locations, and the other corresponding to the sunset locations. Latitude coverage of HALOE varies continuously over each UARS month. The data in use here are those of version 19 available at http://haloedata.larc.nasa.gov/.
The error estimates provided in the HALOE data files include random components due to noise and altitude dependent quasi-systematic errors due to uncertainties in
15
aerosol corrections. Estimates of total uncertainty, including these systematic effects, range from about 5–10% in the middle and upper atmosphere, up to around 30% at 100 hPa.
3.2.1. HALOE data selection
The HALOE data selected for this study are series of measurements on 13-15
con-20
secutive orbits around the world during, or the closest as possible of the balloon flight period, on the day where the tangent location is within the latitudinal range (20◦±5◦S) of the MIR location. Since the MIR travelled only over the Pacific in 2003, a sub-set of data was also built from orbits between 45◦W and 150◦E. The dates and the events are displayed in Tables 8 and 9.
ACPD
4, 4945–4997, 2004SAOZ UV-Vis remote measurements F. Borchi et al. Title Page Abstract Introduction Conclusions References Tables Figures J I J I Back Close
Full Screen / Esc
Print Version Interactive Discussion
© EGU 2004
3.2.2. Comparison with SAOZ
The HALOE data available in the data files are ozone-mixing ratios. Since the SAOZ measured quantity is a number density, the HALOE data have been converted using NCEP (National Centers for Environmental Prediction) pressure and temperature also available in the data files.
5
The comparisons between HALOE and SAOZ are displayed in Fig. 9 (2001 in top and 2003 in bottom panels), separately for sunrise and sunset and the results are summarised in Table 10. Overall, the agreement is satisfactory in the stratosphere (no significant bias, comparable zonal variability though a little larger for HALOE). But it degrades rapidly below 22 km, where larges biases as well as large zonal variability
10
appear, suggesting that the HALOE data are little reliable in the tropical upper tropo-sphere.
However, the comparison of mean profiles in the stratosphere indicates some sys-tematic difference in altitude registration. The reason found for that is the difference in altitude-density relationship, different in NCEP on the one hand and SAOZ in the
15
other, the NCEP density being a little larger. Figure 10 shows an example (SR 2001) of the difference in altitude of the two density profiles, the results for other years or events (not shown) being very similar. If the SAOZ altitude-density relationship is used instead in the conversion of HALOE mixing ratios into ozone number density, the di ffer-ence in altitude registration drops. The profiles after applying this correction are shown
20
in dashed-dotted lines in Fig. 9, as well as revised results of the statistical analysis in Table 10. The correction improves the results. No bias could be any more observed in altitude registration (within ±100 m) or in ozone number density (within ±2% for the longest series of data in 2001), either at SR or SS. The only remaining difference is a slightly larger variability in HALOE (4–5%; 1.5–2e11mol/cm3) compared to SAOZ
25
(2.7–2.8%; 1e11mol/cm3), suggesting a 3–4% precision for HALOE.
But the agreement between the two instruments degrades rapidly on all events and years below 22 km, HALOE displaying a low bias increasing at decreasing altitude
ACPD
4, 4945–4997, 2004SAOZ UV-Vis remote measurements F. Borchi et al. Title Page Abstract Introduction Conclusions References Tables Figures J I J I Back Close
Full Screen / Esc
Print Version Interactive Discussion
© EGU 2004
down to 17 km and then fast increasing noise below. The increasing difference between 22 and 17 km is systematic. It could indicate either an underestimation of the ozone number density (e.g. a temperature dependence), or a systematic error in the altitude registration. Table 11 shows the magnitude of the difference between 22 and 17 km expressed in percent difference in concentration or in altitude.
5
Below 17 km, the HALOE data becomes extremely noisy displaying at the same time unrealistic ozone profiles and zonal variability in both relative and absolute units. The HALOE data are not reliable in tropical upper troposphere.
3.2.3. Discussion and concluding remarks
HALOE and SAOZ ozone profiles are in excellent agreement in the tropical
strato-10
sphere above 22 km. No significant bias could be observed either in altitude regis-tration or ozone concenregis-tration. The only difference is the little larger zonal variability suggesting a little larger precision (3–4%) than that of SAOZ.
Below 22 km but still above the tropopause, HALOE displays an increasing system-atic bias compared to SAOZ. This behaviour is very similar to that found also at the
15
tropics in comparison to SAGE II (Morris et al., 2002). The HALOE percent zonal variability also increases but remarkably not the absolute variability, similar to that of SAOZ, suggesting that, if the bias was not due to a loss of ozone sensitivity (e.g. alti-tude registration), useful information could be derived down to 17 km.
3.3. SAGE II V6.1 and 6.2
20
The Stratospheric Aerosols and Gaz Experiment II (SAGE II) aboard the Earth Radi-ation Budget Satellite (ERBS), launched in October 1984 and still operRadi-ational, utilizes the solar occultation method to retrieve ozone, water vapor, aerosols and NO2(Mauldin et al., 1985). Ozone measurements are carried out in a channel centered at 600 nm (Cunnold et al., 1989). ERBS orbits the Earth along a circular path at a distance of
25
ACPD
4, 4945–4997, 2004SAOZ UV-Vis remote measurements F. Borchi et al. Title Page Abstract Introduction Conclusions References Tables Figures J I J I Back Close
Full Screen / Esc
Print Version Interactive Discussion
© EGU 2004
roughly 1 month, SAGE II records observations at latitudes between 70◦S and 70◦N. Thus, about 15 profiles for each event, sunrise and sunset but on a different day, are available each month at given tropical latitude. The data in use here are those avail-able on the SAGE II websitewww.sage2.larc.nasa.gov, obtained with the V6.1 retrieval algorithm for 2001 and V.6.2 for 2001 and 2003.
5
In the past versions, the precision of ozone observations was usually less than 1% in the middle stratosphere, increasing to around 2% near the stratopause and the tropopause and to higher percentage in regions of very low ozone (Maney et al., 2001). A rough estimate, including uncertainty in cross sections and knowledge of spectral re-sponse, suggests uncertainties around 2.5% from all systematic sources (Maney et al.,
10
2001). The main changes in version 6.1 are a better aerosol clearing and the inclusion of the absorption of the oxygen dimer. Version 6.1 improved algorithm has led to re-duce errors in altitude registration that resulted in a vertical resolution of 1 km, gridded at 0.5 km and the effects of clouds on ozone retrievals (Wang et al., 2002). Compared to previous versions, the change in ozone is 0.5%. The primary change of version 6.2
15
is an improvement of water vapour products and has no impact on ozone. The only change, which could have an impact, is the correction of an error in the interpolation of the NCEP meteorological data used to remove Rayleigh attenuation.
3.3.1. SAGE II data selection
The SAGE II data selected for the study with the same collocated criteria as for HALOE
20
are displayed in Tables 12 and 13. Both V6.1 and V6.2 are available for 2001, but only V6.2 in 2003. Because of the short duration of the MIR flight in 2003, only sunrise data are available during the flight period. In addition the selection is restricted to Pacific area (45◦W, 150◦E).
ACPD
4, 4945–4997, 2004SAOZ UV-Vis remote measurements F. Borchi et al. Title Page Abstract Introduction Conclusions References Tables Figures J I J I Back Close
Full Screen / Esc
Print Version Interactive Discussion
© EGU 2004
3.3.2. Comparison with SAOZ
The SAGE II data available are ozone number densities, which could be thus directly compared to that of SAOZ. The results of the comparison are displayed in Fig. 11 and Table 14. As could be seen on the mean profiles, the maxima ozone are a little larger at SR than SS in 2001, which could indicate an ozone increase between 3–
5
4 February and 21–22 March. SR and SS will be therefore treated separately. The v6.1 and v6.2 SAGE mean profiles in 2001 are very similar at sunrise displaying a small high bias of 5% compared to SAOZ in the stratosphere and a low bias of 60% in the troposphere. However since the MIR started on 19 February this bias is little significant. The main change is in the variability, which drops significantly between 18
10
and 25 km from v6.1 to v6.2, close to that of SAOZ above 18 km. A little different are the results of the comparison at sunset where the v6.1 mean profile is found shifted up by 300 m compared to v6.2 and SAOZ. The bias relative to SAOZ is 2.1±3.7% that is insignificant in the stratosphere, but again low by 50–60% in the troposphere. The variability is very similar in both versions: about 4% in the stratosphere and 80% in the
15
troposphere.
In 2003, therefore only over the Pacific and at sunrise, v6.2 is in very close agreement with SAOZ in the stratosphere above 19 km (−0.3±4.0% bias, 3.5% variability), even better (0.8±1.6% bias) if the SAGE profiles are shifted down by 250 m. However, the limited number of MIR profiles compared to 2003, do not allow concluding definitely on
20
that point. In the troposphere, the results are very similar to those of 2001: −60% bias, variability 2–3 times larger than that of SAOZ.
Overall SAGE II v6.2 and SAOZ ozone profiles are in very close agreement in the stratosphere. Only a small high bias (2% at sunset and 5% at sunrise) could be ob-served and the variability along a latitudinal circle is very similar. The change between
25
v6.1 and v6.2 appears minor at SS, limited to a slightly better altitude registration, but significant at SR resulting in an improvement of precision in the lower stratosphere. In contrast, large systematic differences are found in the troposphere at both SR and SS,
ACPD
4, 4945–4997, 2004SAOZ UV-Vis remote measurements F. Borchi et al. Title Page Abstract Introduction Conclusions References Tables Figures J I J I Back Close
Full Screen / Esc
Print Version Interactive Discussion
© EGU 2004
2001 and 2003, the SAGE ozone being low biased by 50–60% and 2–3 times more variable than that of SAOZ.
3.3.3. Discussion and concluding remarks
The very close agreement between the SAGE II and SAOZ in the stratosphere is not surprising since the two instruments are performing in the same visible Chappuis bands
5
region where the absorption cross-sections are well known and independent of tem-perature. The small high bias with SAOZ is very similar to that found between SAGE 2 and HALOE around 20–25 km by Randal et al., (2003). However, the small difference in zonal variability (2.7–2.8% for SAOZ, 3.8–4.1% for SAGE II for the longest series in 2001) could indicate a slightly better precision in SAOZ. This could be likely related to
10
the higher precision of spectral measurements, allowing a better removal of interfer-ences (aerosol and Rayleigh attenuation, water vapour, oxygen dimer) than the use of a limited number of channels. The excellent agreement in altitude registration, checked by direct lidar comparisons in the case of SAOZ, confirms the quality of both retrievals at the tropics.
15
The large systematic underestimation of 50% of tropospheric ozone by SAGE II com-pared to SAOZ, confirms that already reported between SAGE II and ozonesondes at the tropics (Kar et al., 2002, Wang et al., 2002), attributed to the high sensitivity of the retrieved ozone abundance to the background (electronic offset) of the SAGE II 525 nm channel. Indirectly, the similarity of systematic difference in both analyses,
20
confirms also the agreement previously found between SAOZ and sondes.
Another difference between SAGE II and SAOZ in the troposphere is the significantly larger (2–2.5 times) percent zonal variability of the first, suggesting a worse precision, perhaps related to the influence of clouds for the removal of which no effort has been paid in this study. However, if the variability in number density is considered, the SAGE
25
II variability becomes closer to that of SAOZ. If the bias was not due to a loss of sensitiv-ity but to something independent (e.g. shift of zero), this could suggest, as concluded by Kar et al. (2002), that useful information on tropospheric ozone could be derived
ACPD
4, 4945–4997, 2004SAOZ UV-Vis remote measurements F. Borchi et al. Title Page Abstract Introduction Conclusions References Tables Figures J I J I Back Close
Full Screen / Esc
Print Version Interactive Discussion
© EGU 2004
from SAGE II.
4. Summary
Long series of ozone profiles have been obtained at almost constant latitude (20±5◦S) from 6 to 28 km at the southern tropics by spectrometric solar occultation measure-ments in the visible Chappuis bands using a SAOZ UV-vis spectrometer flown onboard
5
long duration balloons. The error analysis, confirmed by comparisons with tropospheric and stratospheric ozone lidars measurements during the overpass of the balloon at Re-union Island, indicates that the precision of the measurements is better than 2% in the stratosphere (3.5% accuracy) and 5–6% in the troposphere (12% and 25% accuracy at 15, and 10 km respectively, degrading likely because of interferences with water vapour
10
absorption bands not totally removed) and an altitude registration better than ±100 m. According to the measurements, the natural variability of the ozone concentration along a latitudinal circle at 20◦S in the SH summer is less than 1–2% in the strato-sphere above 20 km increasing to 40% at 14 km in the upper tropostrato-sphere. This variabil-ity is mostly due to horizontal exchanges and to a lesser extend to vertical convective
15
transport. The smallest concentrations are observed over Western Pacific.
In the stratosphere and compared to that of SAOZ (Table 15), the measurements of the SHADOZ ozonesondes network and the HALOE and SAGE II instruments in orbit are found a little noisier (2–3% for SAGE, 3–4% for HALOE, 4–5% for the sondes), and of insignificant or small high biased (SAGE II). The new v6.2 SAGE 2 retrieval algorithm
20
is found to improve the precision at sunrise. But major differences appear in altitude registration. No differences in altitude could be found between SAOZ and SAGE II at all levels, and HALOE above 22 km. But the ozonesondes appear to be systematically displaced upwards by some 400–700m at all levels, suggesting of a response time in the sondes measurements larger than anticipated. And the HALOE profiles do show
25
an increasing error at decreasing altitude below 22 km, reaching 1.5 km at 17 km. At lower altitude in the upper troposphere, the SAOZ measurements are found
con-ACPD
4, 4945–4997, 2004SAOZ UV-Vis remote measurements F. Borchi et al. Title Page Abstract Introduction Conclusions References Tables Figures J I J I Back Close
Full Screen / Esc
Print Version Interactive Discussion
© EGU 2004
sistent with those of the sondes and the lidar at Reunion Island, and high biased on average over the Western Pacific, at American Samoa and Fiji. Compared to SAOZ, SAGE II shows a 50–60% low bias similar to that already found with the ozonesondes, and a 2–2.5 times larger zonal variability, suggesting a degradation of its precision be-low the tropopause. Finally, the unrealistic large offsets and variability in the HALOE
5
data compared to all others, suggests that its measurements are no reliable below 17 km in the troposphere.
Most of these findings are very consistent with the results of previous comparisons between SAGE 2, HALOE and sondes. In general, they confirm the differences already reported between the instruments. The only new feature, for which little reference is
10
available, is the systematic shift of altitude in ozonesondes profiles, likely attributed to a response time larger than thought. The altitude shift of the sondes could be respon-sible for their low bias in the tropical stratosphere below the ozone maximum at 25 km compared to SAGE II (Wang et al., 2002) or HALOE (Bhatt et al., 1999). Attention to this shift should be paid in all comparisons between sondes and other instruments.
15
Appendix A
Mathematical background
The statistical method is to compare mean zonal profiles indicative of possible rela-tive bias in concentration or altitude registration, the mean difference (see Eq. A1), as
20
well as absolute and relative variability (respectively Eqs. A2 and A3) along a latitudinal circle indicative of measurement precision.
Diffi = 100xi − SAOZi SAOZi
ACPD
4, 4945–4997, 2004SAOZ UV-Vis remote measurements F. Borchi et al. Title Page Abstract Introduction Conclusions References Tables Figures J I J I Back Close
Full Screen / Esc
Print Version Interactive Discussion
© EGU 2004
Std Devi= Abs. Vari= s
1 ni
X
(xi − xi)2 (A2)
Rel. Vari= 100Abs. Vari SAOZi
(A3)
All variables in these three equations are implicitly altitude dependent, so i index refers to the variable at ith altitude. xi and SAOZi refers to the mean ozone profiles (in molecules/cm3) of correlative data (SHADOZ, SAGE II and HALOE) and of SAOZ
mea-5
surements. Diffiis the relative percent difference. Std Devi, the standard deviation, is equivalent to the absolute ozone variability (in molecules/cm3) Abs. Vari. The rela-tive variability, Rel. Vari, is expressed in percentage. The SHADOZ and HALOE data having a vertical sampling different from that of SAOZ, they are linearly interpolated to the SAOZ altitude grid (i.e. 10, 11, 12 km, . . . ). The SAGE data available on a 0.5 km
10
vertical altitude grid are used directly without further interpolation.
Acknowledgements. The authors thank the personnel of the Institute of Meteorology (IPMet)
of the State University of Sao Paulo (UNESP) and of the Centre National d’Etudes Spatiales (CNES) for their support in balloon operations. They also thank J. L. Baray, T. Portafaix, S. Godin-Beekman, and F. Posny for the lidar and ozonesondes measurements at the NDSC
sta-15
tion of Reunion Island, the NASA Langley Research Center (NASA-LaRC) and the NASA Lan-gley Radiation and Aerosols Branch for the SAGE 2 and HALOE data, and the NASA-GSFC for the SHADOZ ozonesondes. The project was supported by the ENVISAT validation programme ESABC, project 713, the CNES, including a post-doc fellowship for FB, and the Programme National de Chimie de l’Atmosphere (PNCA) in France and the European Commission within
20
ACPD
4, 4945–4997, 2004SAOZ UV-Vis remote measurements F. Borchi et al. Title Page Abstract Introduction Conclusions References Tables Figures J I J I Back Close
Full Screen / Esc
Print Version Interactive Discussion
© EGU 2004
References
Baray, J. L., Leveau, J., Porteneuve, J., Ancelet, G., Kekhut, P., Posny, F., and Baldy, S.: De-scription and evaluation of tropospheric ozone lidar implemented on an existing lidar in the southern tropics, Appl. Optics, 38, 6808–6817, 1999.
Bhatt, P. P., Remsberg, E. E., Gordley, L. L., McInerney, J. M., Bracket, V. G., and Russel III,
5
J. M.: An evaluation of the quality of HAlogen Occultation Experiment ozone profiles in the lower stratosphere, J. Geophys. Res., 104(D8), 9261–9275, 1999.
Brion, J., Chakir, A., Charbonnier, J., Daumont, D., Parisse, C., and Malicet, J.: Absorption spectra measurments for the ozone molecule in the 350–830 nm region, J. Atmos. Chem., 30, 291–299, 1998.
10
Cunnold, D. M., Chu, W. P., Barnes, R. A., McCormick, M. P., and Veiga, R. E.: Validation of SAGE II ozone measurements, J. Geophys. Res., 94, 8447–8460, 1989.
De Muer, D. and De Backer, H.: The discrepancy between stratospheric ozone profiles from balloon soundings and other techniques: A possible explanation, Proc. of the Quadrennial Ozone Symposium, Charlottesville, VA, June 4–13, 1992, 1994b.
15
Dessler, A. E., Hintsa, E. J., Weinstock, E. M., Anderson, J. G., and Chan, K. R.: Mechanism controlling water vapor in the lower stratosphere: “A tale of two stratospheres”, J. Geophys. Res., 100, D11, 23 167–23 172, 1995.
Dessler, A. E.: The effect of deep, tropical convection on the tropical tropopause layer, J. Geophys. Res., 107, D3, doi:101029/2001JD000511, 2002.
20
Hauchecorne, A., Godin, S., Marchand, M., Heese, B., and Souprayen, C.: Quantification of the transport of chemical constituents from the polar vortex to midlatitudes in the lower stratosphere using the high-resolution advection model MIMOSA and effective diffusivity, J. Geophys. Res., 107(D20), 8289, doi:10.1029/2001JD000491, 2002.
Jeker, D. P., Pfister, L., Thompson, A. M., Brunner, D., Boccippio, D. J., Pickering, K. E., Wernli,
25
H., Kondo, Y., and Staehelin, J.: Measurements of nitrogen oxides at the tropopause: at-tribution to convection and correlation with lightning, J. Geophys. Res., 105, 3679–3700, 2000.
Kar, J., Trepte, C. R., Thomason L. W., Zawodny, J. M., Cunnold, D. M., and Wang, H. J.: On the tropospheric measurements of ozone by the Stratospheric Aerosol and Gas Experiment
30
II (SAGE II, version 6.1) in the tropics, Geophys. Res. Lett., 29, doi:10.1029/2002GL016241, 2002.
ACPD
4, 4945–4997, 2004SAOZ UV-Vis remote measurements F. Borchi et al. Title Page Abstract Introduction Conclusions References Tables Figures J I J I Back Close
Full Screen / Esc
Print Version Interactive Discussion
© EGU 2004
Kley, D., Crutzen, P. J., Smit, H. G. J., V ¨omel, H., Oltmans, S. J., Grassl H., and Ramanathan, V.: Observations of near-zero ozone concentrations over the convective Pacific: effects on air chemistry, Science, 274, 230–233, 1996.
Malaterre, P., Dubourg, V., Letrenne, G., and Durand, M.: The long duration MIR balloon, in proceedings of the 12th ESA symposium on Rocket and balloon program, ESA SP-370, Eur.
5
Space Agency, Paris, France, 329–334, 1996.
Manney, G. L., Michelsen, H. A., Bevilacqua, R. M., Gunson M. R., Irion, F. W., Livesey, N. J., Oberheide, J., Riese, M., Russell III, J. M., Toon, G. C., and Zawodny, J. M.: Comparison of satellite ozone observations in coincident air masses in early November 1994, J. Geophys. Res., 106(D9), 9923–9943, 2001.
10
Mauldin, L. E., III, Zaun, N. H., McCormick, M. P., Guy, J. H., and Vaugh, W. R.: Stratospheric Aerosol and Gas Experiment II instrument: A functional description, Opt. Eng., 24, 307–312, 1985.
Morris, G. A., Gleason, J. F., Russell III, J. M., Schoeberl, M. R., and McCormick, M. P.: A comparison of HALOE V19 with SAGE II V6.00 ozone observations using trajectory mapping,
15
J. Geophys. Res., 107(D13), 4177, doi:10.1029/2001JD000847, 2002.
Pommereau, J. P. and Hauchecorne, A.: A new Atmospheric vehicle: The Infra-Red Mont-golfier, Adv. Space Res., 55, 1979.
Pommereau, J. P. and Goutail, F.: O3 and NO2 Ground-Based Measurements by Visible Spec-trometry during Arctic Winter and Spring 1988, Geophys. Res. Lett., 15, 891–894, 1988.
20
Pommereau, J. P. and Piquard, J.: Ozone, Nitrogen dioxide and Aerosol vertical distributions by UV-visible solar occultation from balloons, Geophys. Res. Lett, 21, 1227, 1994.
Portafaix, T., Morel, B., Bencherif, H., Baldy, S., Godin-Beekmann, S., and Hauchecorne, A.: Fine-scale study of a thick stratospheric ozone lamina at the edge of the southern subtropical barrier, J. Geophys. Res., 108, 4196, doi:10.129/2002JD002741, 2003.
25
Randall, C. E., Rusch, D. W., Bevilacqua, R. M., , and Hoppel, K. W.: Validation of POAM III ozone: Comparison with ozonesonde and satellite data,, J. Geophys. Res., 108(D12), doi:10.1029/2002JD002944, 2003.
Roscoe, H. K, Johnston, P. V., Van Roozendael, M., Richter, A., Preston, K., Lambert, J.C., Hermans, C., de Cuyper, W., Dzenius, S., Winterath, T., Burrows, J., Sarkissian, A., Goutail,
30
F., Pommereau, J. P., d’Almeida, E., Hottier, J., Coureul, C., Ramond, D., Pundt, I., Bartlet, L. M., Kerr, J. E., Elokhov, A., Giovanelli, G., Ravegnani, F., Premudan, M., Kostadinov, M., Erle, F., Wagner, T., Pfeilsticker, K., Kenntner, M., Marquand, L. C., Gil, M., Puentedura, O.,
ACPD
4, 4945–4997, 2004SAOZ UV-Vis remote measurements F. Borchi et al. Title Page Abstract Introduction Conclusions References Tables Figures J I J I Back Close
Full Screen / Esc
Print Version Interactive Discussion
© EGU 2004
Arlander, W., Kastad-Hoiskar, B. A., Tellefsen, C. W., Heese, C. W., Jones, R. L., Aliwalle, S. R., and Freswater, R. A.: Slant column measurements of O3 and NO2 during the NDSC intercomparison of zenith-sky UV-visible spectrometers in June 1996, J. Atmos. Chem., 291– 314, 1999.
Russel III, J. M., Gordley, L. L., Park, J. H., Drayson, S. R., Hesketh, W. D., Cicerone, R.
5
J., Tuck, A. F., Frederick, J. E., Harries, J. E., and Crutzen, P.J.: The HAlogen Occultation Experiment, J. Geophys. Res., 98(D6), 10 777–10 797, 1993.
Solomon, S., Borrmann, S., Garcia, R. R., Portmann, R., Thomason, L., Poole, L. R., Winker, D., and, McCormick, M. P.: Heterogeneous chlorine chemistry in the tropopause region, J. Geophys. Res., 102, 21 411–21 429, 1997.
10
Thompson, A. M., Witte, J. C., McPeters, R. D., Oltmans, S. J., Schmidlin, F. J., Loga, J. A., Fujiwara, M., Kirchhoff, V. W. J. H., Posny, F., Coetzee, G. J. R., Hoegger, B., Kawakami, S., Ogawa, T., Johnson, B. J., V ¨omel, H., and Labow, G.: Southern Hemisphere Ad-ditional Ozonesondes (SHADOZ) 1998–2000 tropical ozone climatology, 1. Comparison with TOMS and Grond-based Measurements, J. Geophys. Res., Vol. 108 No. D2, 8241,
15
doi:10.1029/2002JD002241, 2003a.
Thompson, A. M., Witte, J. C., McPeters, R. D., Oltmans, S. J., Schmidlin, F. J., Loga, J. A., Fujiwara, M., Kirchhoff, V. W. J. H., Posny, F., Coetzee, G. J. R., Hoegger, B., Kawakami, S., Ogawa, T., Fortuin, J. P. F., and Kelder, H. M.: Southern Hemisphere Additional Ozoneson-des (SHADOZ) 1998–2000 tropical ozone climatology, 2. Tropospheric variability and the
20
zonal wave-one, J. Geophys. Res., Vol. 108 No. D2, 8241, doi:10.1029/2002JD002241, 2003b.
Wang, H. J., Cunnold, D. M., Thomason, L. W., Zawodny, J. M., and Bodeker, G. E.: As-sessment of SAGE version 6.1 ozone data quality, J. Geophys. Res., 107(D23), 4691, doi:10.1029/2002JD002418, 2002.
25
WMO (World Meteorological Organisation), SPARC / IOC / GAW: Assessment of trends in the vertical distribution of ozone, edited by Harris, N., Hudson, R., and Philips, C., SPARC report N◦1, WMO: Ozone research and monitoring project, Rep. 43, 1998.
ACPD
4, 4945–4997, 2004SAOZ UV-Vis remote measurements F. Borchi et al. Title Page Abstract Introduction Conclusions References Tables Figures J I J I Back Close
Full Screen / Esc
Print Version Interactive Discussion
© EGU 2004
Table 1. Ozone variability before and after removal of transport compared to SAOZ random error estimate from spectral fit.
Altitude (km) Observed Std. Dev. % Residual Std. Dev. % SAOZ Precision % 25 22.5 20 17.5 15 12.5 10 1.8 3 7 33 39 36 26 1.2 1.9 2.4 5.2 5.7 6.5 7.5 1.2 1.2 2.1 5.0 10 13 23
ACPD
4, 4945–4997, 2004SAOZ UV-Vis remote measurements F. Borchi et al. Title Page Abstract Introduction Conclusions References Tables Figures J I J I Back Close
Full Screen / Esc
Print Version Interactive Discussion
© EGU 2004
Table 2. Dates of selected SHADOZ ascents in 2001.
Station February March Total
Number
Samoa 16, 23 none 2
Fiji 2, 9, 16, 23, 2, 9, 19, 26 8 Reunion Island 2, 15, 21, 24, 28 7, 15, 21, 28 9
ACPD
4, 4945–4997, 2004SAOZ UV-Vis remote measurements F. Borchi et al. Title Page Abstract Introduction Conclusions References Tables Figures J I J I Back Close
Full Screen / Esc
Print Version Interactive Discussion
© EGU 2004
Table 3. Dates of selected SHADOZ ascents in 2003.
Station February March Total Number Samoa 7, 21, 28 7, 14, 21, 28 7
ACPD
4, 4945–4997, 2004SAOZ UV-Vis remote measurements F. Borchi et al. Title Page Abstract Introduction Conclusions References Tables Figures J I J I Back Close
Full Screen / Esc
Print Version Interactive Discussion
© EGU 2004
Table 4. SHADOZ-SAOZ difference and zonal variability in the stratosphere. Diff % Diff % Alt Corr. Var SAOZ % Var Shadoz % Var SAOZ e10mol/cm3 Var Shadoz e10mol/cm3 2001 −5.2±5.1 −0.9±2.2 2.7±1.9 5.3±2.7 8.6±3.4 16.8±4.6 2003 −8.3±8.2 −4.3±2.4 1.7±1.4 4.8±2.0 5.7±3.1 15.3±4.4
ACPD
4, 4945–4997, 2004SAOZ UV-Vis remote measurements F. Borchi et al. Title Page Abstract Introduction Conclusions References Tables Figures J I J I Back Close
Full Screen / Esc
Print Version Interactive Discussion
© EGU 2004
Table 5. SHADOZ-SAOZ difference and zonal variability in the troposphere.
v Diff % Diff % Alt Corr. Var SAOZ % Var Shadoz % Var SAOZ e10mol/cm3 Var Shadoz e10mol/cm3 2001 −36.3±10 −26.5±10 31.4±11.2 48.3±24 18.6±2.2 16.8±4.6 2003 −61.2±20 −48.2±32 22.2±9.5 33.9±9.2 15.2±9.1 9.0±7.7
ACPD
4, 4945–4997, 2004SAOZ UV-Vis remote measurements F. Borchi et al. Title Page Abstract Introduction Conclusions References Tables Figures J I J I Back Close
Full Screen / Esc
Print Version Interactive Discussion
© EGU 2004
Table 6. Dates of SAOZ overpass and SHADOZ selected ascents in 2001.
Station SAOZ overpass SHADOZ ascent ∆Time (day) ∆Lat (deg) ∆Lon (deg) Distance (km) Samoa 18–19 Feb. 16, 23 Feb. 3.5±1.4 0.8±0.6 8.7±5.0 914±518 Fiji 8–9 March 2, 9 March 3.5±3.2 3.1±0.4 5.6±1.9 690±156 Reunion Isl. 24-25 Feb. 21, 24, 28 Feb. 2.5±1.6 0.5±0.5 9.8±5.3 1030±556
ACPD
4, 4945–4997, 2004SAOZ UV-Vis remote measurements F. Borchi et al. Title Page Abstract Introduction Conclusions References Tables Figures J I J I Back Close
Full Screen / Esc
Print Version Interactive Discussion
© EGU 2004
Table 7. SHADOZ-SAOZ difference in the troposphere.
Station Difference % Alt Shift (m) Samoa −44.4±13.8 −400
Fiji −37.7±8.8 −600
ACPD
4, 4945–4997, 2004SAOZ UV-Vis remote measurements F. Borchi et al. Title Page Abstract Introduction Conclusions References Tables Figures J I J I Back Close
Full Screen / Esc
Print Version Interactive Discussion
© EGU 2004
Table 8. HALOE selection in 2001.
Date Event Number 17–19 Feb. SS 13 4–6 March SR 25
ACPD
4, 4945–4997, 2004SAOZ UV-Vis remote measurements F. Borchi et al. Title Page Abstract Introduction Conclusions References Tables Figures J I J I Back Close
Full Screen / Esc
Print Version Interactive Discussion
© EGU 2004
Table 9. HALOE selection in 2003.
Date Event Number 4–6 Feb. SS 14 19–20 Feb. SR 14
ACPD
4, 4945–4997, 2004SAOZ UV-Vis remote measurements F. Borchi et al. Title Page Abstract Introduction Conclusions References Tables Figures J I J I Back Close
Full Screen / Esc
Print Version Interactive Discussion
© EGU 2004
Table 10. Comparison between HALOE and SAOZ above 22 km. Diff % Diff % Alt Corr. Var SAOZ % Var Haloe % 2001 SR −2.3±3.7 0.0±2.0 2.7 4.1 2001 SS 1.1±3.7 −0.5±2.7 2.8 5.4 2003 SR −0.7±1.3 −3.9±1.2 1.7 4.6 2003 SS 0.4±2.0 −2.2±1.8 1.7 3.5
ACPD
4, 4945–4997, 2004SAOZ UV-Vis remote measurements F. Borchi et al. Title Page Abstract Introduction Conclusions References Tables Figures J I J I Back Close
Full Screen / Esc
Print Version Interactive Discussion
© EGU 2004
Table 11. Difference in ozone number density or altitude registration between HALOE and SAOZ below 22 km. Altitude (km) Diff % Alt. Diff km 22 −5 0.5 21 −20 0.9 20 −30 1.15 19 −37 1.5 18 −45 17 −52
ACPD
4, 4945–4997, 2004SAOZ UV-Vis remote measurements F. Borchi et al. Title Page Abstract Introduction Conclusions References Tables Figures J I J I Back Close
Full Screen / Esc
Print Version Interactive Discussion
© EGU 2004
Table 12. Selection of SAGE II in 2001.
Date Event Number 3–4 Feb. SS 30 21–22
March
ACPD
4, 4945–4997, 2004SAOZ UV-Vis remote measurements F. Borchi et al. Title Page Abstract Introduction Conclusions References Tables Figures J I J I Back Close
Full Screen / Esc
Print Version Interactive Discussion
© EGU 2004
Table 13. Selection of SAGE II in 2003.
Date Event Number 7–8 March SR 12
ACPD
4, 4945–4997, 2004SAOZ UV-Vis remote measurements F. Borchi et al. Title Page Abstract Introduction Conclusions References Tables Figures J I J I Back Close
Full Screen / Esc
Print Version Interactive Discussion
© EGU 2004
Table 14. Difference of SAGE II v6.1 and v6.2 with SAOZ and zonal variability at sunrise and sunset in 2001 and 2003 above 20 km.
Diff % Var SAOZ % Var SAGE % 2001 SR v6.1 5.0±3.2 2.8 6.7 2001 SR v6.2 5.1±2.7 2.8 3.8 2001 SS v6.1 −2.3±7.1 2.7 3.8 2001 SS v6.2 2.1±3.7 2.7 4.1 2003 SR v6.2 −0.3±4.0 1.7 3.5