This is an author-deposited version published in: https://sam.ensam.eu Handle ID: .http://hdl.handle.net/10985/6885
To cite this version :
Fabien ROUAULT, Denis BRUNEAU, Patrick SEBASTIAN, Serge EKOMY ANGO, Jérôme LOPEZ - Numerical modeling and experimental study of a box-section tube bundle thermal energy storage for free-cooling of buildings - 2012
Any correspondence concerning this service should be sent to the repository Administrator : archiveouverte@ensam.eu
1 INNO-SP-59
Numerical modeling and experimental study of a box-section tube
bundle thermal energy storage for free-cooling of buildings
Fabien Rouault1, 2, Denis Bruneau3, Patrick Sebastian4, Serge Ekomy Ango5, Jérôme Lopez6
1
Arts et Métiers ParisTech, I2M, UMR 5295, F-33400 Talence, France.
2Nobatek, F-64600 Anglet, France, Phone: (00 33) 5-56-84-63-72, Fax: (00 33) 5-56-84-63-71, e-mail:
frouault@nobatek.com
3 Arts et Métiers ParisTech, I2M, UMR 5295, F-33400 Talence, France, Phone: (00 33) 5-56-84-54-19,
Fax: (00 33) 5-56-84-63-36, e-mail: denis.bruneau@ensam.eu
4 Univ. Bordeaux, I2M, UMR 5295, F-33400 Talence, France., Phone: (00 33) 5-56-84-54-14,
Fax: (00 33) 5-56-84-63-36, e-mail: patrick.sebastian@ensam.eu
5 Institut de recherches technologiques (IRT), B.P.14070 Libreville, Gabon, e-mail:
ekomyango@yahoo.fr
6Nobatek, Talence, Phone: (00 33)5-56-84-63-74, Fax: (00 33) 5-56-84-63-71, e-mail:
jlopez@nobatek.com
Nomenclature
A Heat exchange surface (m2) Cp Sensible heat capacity (J.kg-1.K-1) d Diameter (m)
h Heat exchange coefficient (W.m-2.K-2) H Enthalpy (J.m-3)
k Convective gain factor(-) Nt Number of aluminum tubes (-)
Nu Nusselt Number (-) p Perimeter (m) S Cross section (m2)
s Lateral or top distance from the PCM melting front to tube walls (m)
T Temperature (°C)
t Time (s)
v Air velocity (m.s-1) x Axial coordinates (m) Y Internal tube width (m) Z Internal tube height (m)
Greek symbols
Corrective factor (-)
δ PCM liquid film thickness (m) λ Thermal conductivity (W.m-1.K-1) ρ Density (kg.m-3)
σ Molten fraction (-) Subscripts
a Air
ext Experimental room fd Fully developed hyd Hydraulic
l Liquid (melted) PCM ld Leading edge
PCM Phase Change Material
s Solid PCM
w Tube walls
1. Introduction
In Europe, the ownership rate of air-conditioning systems is 27% in the service sector, and it represents 5% in the households sector [1]. The growth of the air conditioning market is 9% between 1996 and 2000 and only 18% of sold air conditioner are replacements for existing air conditioners [2]. Consequently, it is necessary to develop technological solutions able to regulate summer comfort of occupants with reduced energy cost. Fig. 1 shows the university project called “Napevomo” which aims to build a lightweight single-family house which brings out an optimal comfort to occupants along the year and has been designed using an approach of energetic sobriety. This house embeds a short term Latent Heat Thermal Energy Storage (LHTES) to cool air with a reduced electrical cost. The system stores heat surpluses in the day time and releases this heat during night-time provided that outdoor temperature is beneath PCM freezing temperature. Zalba and al. [3] reviewed 237 articles on this subject and focuses on PCM properties, phase-change problems and application of LHTES. The LHTES device made
2 for free-cooling of the house (see Fig. 1) is composed of four heat exchangers made of a box-section tube bundle filled with 2 different paraffin waxes.
Fig. 1: House (Napevomo) using squared tubes LHTES
Fig. 2: Synoptic of the whole PCM energy storage system. The aim of the present paper is to develop a one-dimensional model accurate enough to predict the heat transfer between the air flowing in the energy storage unit such as shortly described here above. Dutil et al. [4] reviewed several modelling and simulations on phase change problems. These authors conclude that the variation of the PCM properties makes difficult the generalization of models.
Due to the squared sections of the tubes, the close-contact melting phenomenon of PCM materials is proving to be the dominating phenomenon of heat transfers between PCM and tubes and fosters the thermal transfers. During the melting of the PCM, the solid goes down to the bottom wall of the tube and is permanently in the vicinity of this wall because of the decreasing of the density of the material when it melts. Lacroix et al. [5], Fukusako et al. [6] and Oka et al. [7] investigate heat transfers occurring between PCM and solid materials in its close environment (ducts or external bodies) for many geometrical configurations. Those authors point out that close-contact melting is indeed a physical phenomenon that must be considered for optimizing the modelling of heat transfers between PCM and a contact surface. However, numerical modelling of LHTES units considering close-contact melting is rarely cited in the literature especially for box-section tubes. Following those authors conclusions, these configurations may lead to efficient thermal transfer systems in particular for squared section tubes.
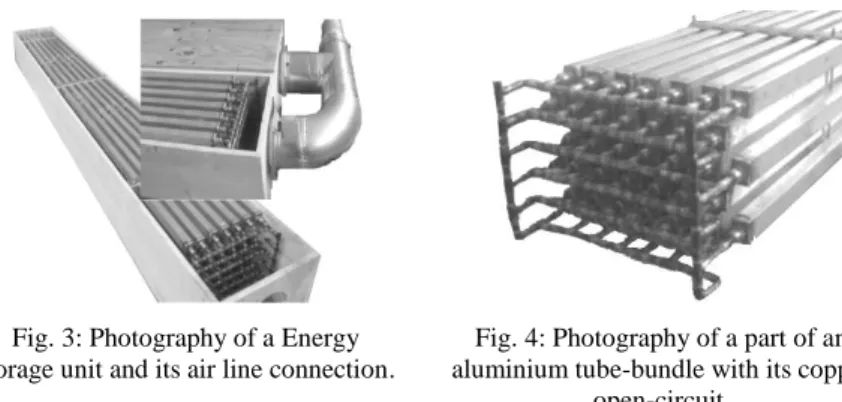
Fig. 3: Photography of a Energy storage unit and its air line connection.
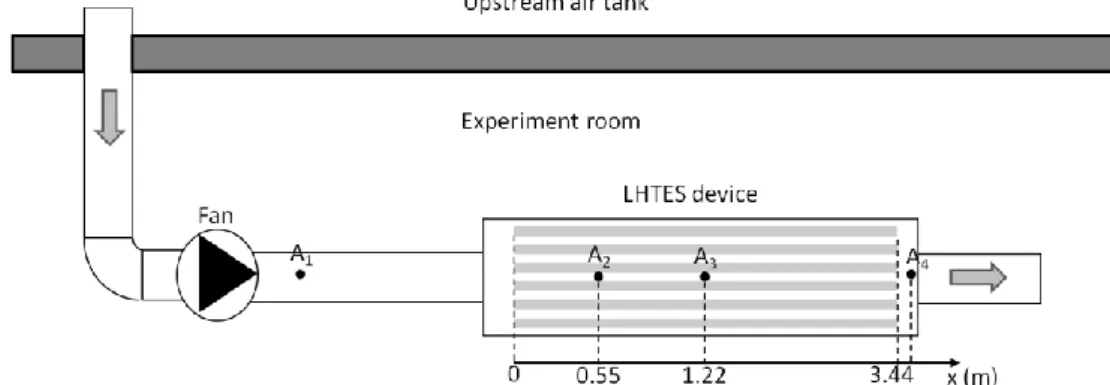
Fig. 4: Photography of a part of an aluminium tube-bundle with its copper
open-circuit.
A one-dimensional dynamic differential model related to the temperature of the air flowing through the LHTES device is proposed. In the transverse direction, thermal transfers between air and PCM material are computed from thermal gradients and heat transfer coefficients correlated to the melted PCM buoyancy phenomenon. Numerical results are then presented and analysed.
3
2. Experimental setup
An experimental unit has been built and instrumented to investigate the behaviour of this LHTES device in laboratory conditions (Fig. 5). It is mainly composed of the LHTES device, a fan coupled with a variable electric supply and an upstream air tank (a room neighbouring to the experiment room, heated by electric space heaters) in which the air temperature is maintained at an almost constant temperature. During each experiment, the upstream air velocity, which is the average velocity in the duct connecting the fan to the energy storage unit, is constant and ranges from 2 m.s-1 to 6 m.s-1. The air flowing through the LHTES device is exhausted inside the experiment room where the LHTES device is settled. The inlet temperature of this air ranges from 30°C to 50°C. The experiment runs until the complete melting of the PCM is reached. Four K-type thermocouples measure the air temperature: one upstream to the LHTES device (A1), two inside the LHTES device respectively 0.550 m distant (A2) and 1.22m distant (A3)
from its entrance, and one downstream to the LHTES device (A4). Recording time step of
temperatures is of one minute.
Fig. 5: Schematic view of the experimental device. In A1, A2, A3, A4: K-type thermocouples (air temperature
measurements).
3. Numerical Modelling approach and numerical procedure
The air-cooling system investigated consists in a LHTES device made of 42 parallel aluminium tubes (30mmx40mmx3440mm) evenly spaced by 25 mm and distributed in 7 over-stacked stages (Fig. 4). The air circulation is globally parallel to the box-section tubes, but the baffles are fixed along the tubes length in order to ensure a tortuous and turbulent airflow. Tubes are filled with the commercial RT28 HC paraffin wax and interconnected using an open circuit of copper ducts (Fig. 4). The main function of this open circuit is to offset the stress that could occur in the tubes during the melting of the PCM because of its increasing of volume per unit of mass. This copper open circuit also links the aluminium tubes and thus facilitates their initial filling with PCM. The whole connected tube-bundle is fixed in place in a wooden box beam with a 300mmx400mm external cross section (Fig. 3).
Properties Values
Melting Temperature (°C) 28
Latent heat (kJ.kg-1) 245 Solid heat capacity (J.kg-1.K-1) 1650 Liquid heat capacity (J.kg-1.K-1) 2200 Heat conductivity (W.m-1.K-1) 0.2
4 Solid density (kg.m-3) 880
Liquid density (kg.m-3) 768 Melting volume expansion (%) 14 Kinetic viscosity (mm2.s-1) 3.1 Tab. 1: Thermo-physical properties of RT28 HC [8] and [9] .
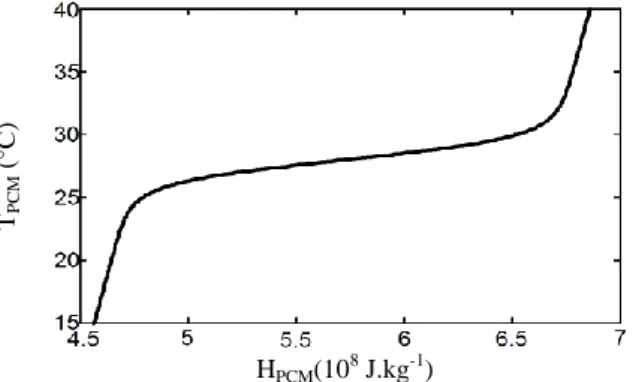
The main thermo-physical properties of the RT28 HC paraffin wax are summarized in Tab. 1: Thermo-physical properties of RT28 HC [8] and [9] .[8]. Its heat capacities values are estimated from the n-octadecane ones, the main component of RT28 HC [9]. The paraffin wax RT28 HC is a commercial one. It is a non-eutectic mix of several pure elements so that its phase change transition is a gradual function of the temperature. This gradual transition has been established by using material properties in Tab. 1, experimental results [10][11], and a descriptive approach of those experiments proposed in [12], [13]. PCM temperature is then considered as a reversible function of PCM enthalpy, and is presented in Fig. 6.
TP
C
M
(°C)
HPCM(108 J.kg-1)
Fig. 6: RT28 HC temperature as function of its enthalpy.
The ratio between tubes height and width being closed to 1 (the tube section is almost squared), the close-contact melting between the solid phase of the PCM and the lower surface of those tubes act as a dominating phenomenon in this heat transfer [14].
The governing equations of this model are transient and one-dimensional along the main axis of the device which corresponds to the direction of the tubes and to the main direction of the airflow. Hereafter, this direction is denoted dx. Longitudinal (that is along the x-axis) heat transfers in PCM are supposed to be negligible. Depending on its local temperature TPCM(x, t)
and its molten fraction (x, t) which are reversible functions of its local enthalpy HPCM(x, t),
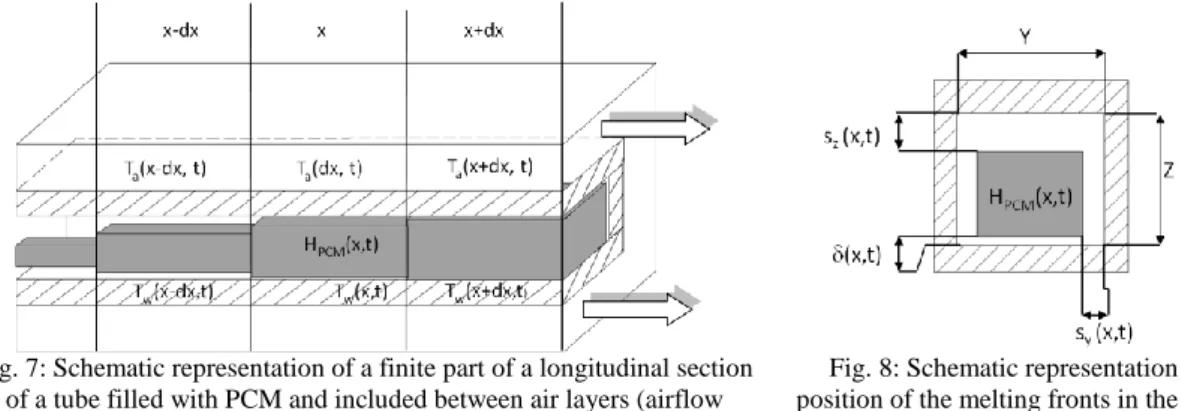
PCM is, or fully solid, or a mix composed of liquid PCM and solid PCM, or fully liquid. A schematic representation of a finite part of a longitudinal section of a tube, filled with PCM surrounded by air is proposed in Fig. 9. In this figure, three half air layers are displayed in white, the aluminium tube walls are hatched and the solid PCM is shaded. In addition, the different local temperatures values used in the energy balance equations are indicated on the Fig. 7. On Fig. 8, liquid PCM layers are schematically represented in white. Their thicknesses between the solid PCM and the top, bottom and side tube walls are respectively denoted , sZ
5 Fig. 7: Schematic representation of a finite part of a longitudinal section
of a tube filled with PCM and included between air layers (airflow direction in white arrows).
Fig. 8: Schematic representation of position of the melting fronts in the cross
section of a tube.
Heat transfer balance equations of the whole energy storage unit, are written in three domains of length dx: an air domain, a tube wall domain and a PCM domain (solid + melted). These equations are the following:
Air domain: ρa va a pa a
x dx ρa pa a
a
t dx ha-w d a-w w- a hext-a d ext-a ext- a ,
(1)
Tube walls domain: ρw pw w w
t dx λw w
w
x dx ha-w d a-w a- w hw-P M d w-P M P M HP M - w (2)
Melted and solid PCM domain: P M H tP M dx hw-P M d w-P M w- P M HP M . (3)
In the preceding equations, dAext-a is the inner surface area of an element of length dx of the
wooden box beam, and dAa-w and dAw-PCM are respectively the surface areas of elements of
length dx of the outer and the inner tubes walls. These surface areas are calculated from the perimeters of the aluminium tubes as follows:
d a-w Nt pa-w dx and d w-P M Nt pw-P M dx (4)
where Nt is the number of tubes in the bundles, and pw-PCM and pa-w are respectively the inner
and outer perimeters of a tube cross-section.
The present model being a dynamic and one-dimensional one, the variables Ta, Tw and HMCP in
equations (3) to (5) are functions of x-coordinate and time t. Furthermore, in these equations, the expression of the convective exchange coefficient between air and tube walls, namely ha-w,
is:
ha-w x Nua-w x λa
dhyd ,
(5) where the Nusselt number Nua-w is calculated from:
Nua-w x x Nua-wfd x with x for x xld for x xld
(6) The Nusselt non-dimensional number Nua-wfd coming from a classical correlation related to fluid flows inside non-circular ducts [15]. We chose to weight the classical Nusselt correlation by using a corrective factor (x) which accounts for both the leading edge effect (the non-dimensional number Nua-wfd correlation being established for a fully developed airflow) and the baffles effect (the non-dimensional number Nua-wfd correlation being established for a non-disturbed flow). These leading edge and baffles effects are taken into account through k1 and k2
parameters values, and of the leading edge effect spatial limit through the xld parameter value.
Concerning the heat exchange between the air flowing through the LHTES device and the external air of the device (see Eq. 3), the corresponding global exchange coefficient hext-a
6 depends on: (i) the forced convective heat exchange coefficient between air and the wooden box beam which is similar to ha-w, (ii) the conduction coefficient of wood and the thickness of the
walls of the wooden box beam, and (iii) the natural convection at the outer surface of the box beam.
In equations (2) and (3), the heat transfers that occur between the inner tube walls and the PCM are considered not to be purely conductive when the melting proceeds, but dependent on a PCM close contact melting phenomenon. Hirata et al. [20, 21] investigate this phenomenon for PCM (ice water and octadecane) inside isothermally heated horizontal and rectangular tubes. Developing an experimental approach, the authors point out that heat conduction drives heat transfers at the top wall of each tube, while natural convection and conduction both occur at the bottom and lateral walls [16]. Using those PCM to the tubes walls distances definitions define by Hirata et al., the heat exchange coefficient hw-PCM between the tube walls and PCM (see
equations 4 and 5) can be written as follows:
hw-P M x t λl pw-P M Nu - s x t δ x t - s x t s x t Nu s x t , (7)
where the Nusselt number NuY and the distances (see Fig. 8) sY, sZ, (exchange between the
bottom wall of the tubes and the solid PCM) are given by empirical correlations proposed by Hirata et al. [16] and where the Nusselt number NuZ (exchange between the two side walls of
the tubes and the solid PCM) is given by an empirical correlation for natural convection in rectangular cavities [22].
The boundary conditions of the model are based on the hypothesis of negligible heat fluxes at the edges of the tubes:
w x t x , (8) w x L t x . (9) The initial PCM enthalpy is computed at ambient temperature:
HP M x HP M ext t , (10)
and the initial tube walls temperature is
w x ext t , (11)
In addition, the value of air temperature is fixed to the inlet boundary at each time step, this value being the experimental one.
a x t t , (12)
The one-dimensional numerical equations (1) to (3) with their boundary conditions (8) and (9) and the initial conditions (10) to (12) is solved using the finite differences method. The discretization is centred on each node and since, the convective exchange coefficients between tube walls and PCM (hw-PCM) depends on the PCM temperature TPCM[HPCM(x, t)], the air
temperature Ta and the tube walls temperature Tw, the time integration is performed using the
implicit Euler method. Furthermore, for each time step, an iterative procedure with a 0.5 relaxation parameter and a convergence criterion on the PCM enthalpy value is used to solve the equations until the convergence of the PCM enthalpy occurs.
Numerical results presented in the next section have been obtained from a twenty spatial elements along the x-axis and a constant time step which value is sixty seconds.
7
4. Results and discussion
4.1 Numerical results and interpretation
In this section, the simulations are carried out for the conditions developed above with the intrinsic velocity between the tubes of the bundle va=2.1 m.s
-1
. The corrective factor (x) of the convective exchange coefficient between air and tube walls (see Eqs. 7 and 8). It has been obtained by fitting numerical results with the experimental results for a unique air velocity value, namely va= 2.1m.s
-1
. Its expression is the following:
x for x x for x x . (13)
Fig. 9, Fig. 10 and Fig. 11 present the temperature time evolution for air (Ta) tubes (Tw) and
PCM (TPCM), in locations A2, A3 and A4. Fig. 12 shows the PCM molten fraction time evolution
() in the same locations, and the time evolution of its spatial average.
T(A 2 ,t) (°C) T(A 3 ,t) (°C) t (min) t (min)
Fig. 9: Numerical results for temperatures vs. time: in location A1 for air (x-dots), and in location A2 for air
(dashed-dotted line), tubes (dashed line) and PCM (solid line). Air velocity va=2.1 m.s-1.
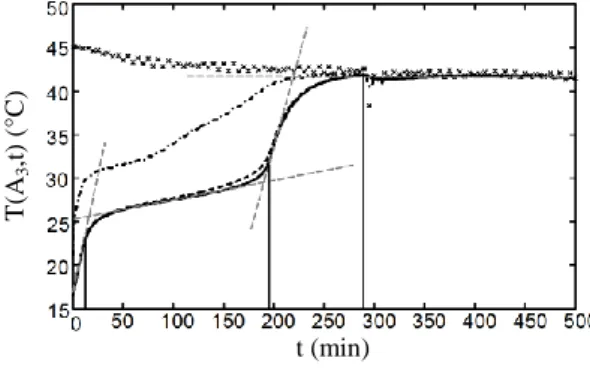
Fig. 10: Numerical results for temperatures vs. time: in location A1 for air (x-dots), and in location A3 for air
(dashed-dotted line), tubes (dashed line) and PCM (solid line). Air velocity va=2.1 m.s-1.
T(A 4 ,t) (°C) (x , t) (-) t (min) t (min)
Fig. 11: Numerical results for temperatures vs. time: in location A1 for air (x-dots), and in location A4 for air
(dashed-dotted line), tubes (dashed line) and PCM (solid line). Air velocity va=2.1 m.s-1.
Fig. 12: Numerical results for PCM molten fraction vs. time: in locations A2 (dashed-dotted line), A3 (dotted
line) and A4 (dashed line). Spatial average PCM molten
fraction vs. time (solid line). Air velocity va=2.1 m.s-1.
Fig. 9, Fig. 10 and Fig. 11 show at their respective locations A2, A3 and A4, that temperature
evolutions are decomposed in four main phases. Tangents (grey dashed lines) and vertical lines are drawn on curves of PCM temperature to mark out each phase from others and the evolution of the corresponding calculated molten fraction (see Fig. 12) confirms this finding. For instance, basing on Fig. 11, the PCM cooling phases at the outlet (A4) are as following:
Phase 1 (from 0 to 20 min): global sensible heating of the PCM. The curve behave approximately as an exponential decay (TPCM(A4,t) 1-exp[-t/s]) reaching a T=41.3°C
8 PCM temperature curve leads to determine the time constant s= 81 min. During this
phase, the molten fraction at location A4 is zero (see Fig. 15).
Phase 2 (from 20 to 290 min): melting of the PCM. During this phase, the molten fraction increases until its value reaches unity (Fig. 12). Phase change in A4 starts from
t=20 min (see Fig. 12), that is significantly before s= 81 min. This transition between
sensible heat transfer and latent heat transfer is marked out by a separation between the PCM temperature curve and the tangent at t=0 to this curve (see Fig. 14). From t=80 min to t=230 min, temperature increases almost linearly. Then, from t=230 min to t=290 min, the transition between latent heat transfer (melting) and sensible heat transfer occurs. This transition ends when the PCM is fully melted (see Fig. 12), that is when the PCM temperature curve reach an inflexion point (see Fig. 11).
Phase 3 (from t= 290 to 360 min): sensible heating of the PCM. The curve shape is an exponential decay reaching the T=41.3°C stabilisation temperature value. The corresponding time constant is l= 14 min. We here consider that the PCM temperature
is stabilized after 5.l delay, i.e. 70 minutes after the beginning of phase 3.
Phase 4 (from t= 360 to 500 min): steady state. The LHTES device has reached its equilibrium state: air, PCM and tubes walls temperatures are almost the same. The stabilisation temperature of this system is mainly influenced by the air inlet temperature in the LHTES device and by the heat exchange, through the wooden box beam walls, between the air flowing through the LHTES device and the experiment room air. Whether numerical results presented in Fig. 12 to 14, the determination of the PCM melting phase starting time is vague. This is because this starting time is in both cases determined by the use of air temperature values in the LHTES system: these air temperature values are influenced by the thermal behaviour of the whole LHTES device (PCM melting, heat transfer from PCM to air) from its air inlet location to the these values determination locations (see Fig. 5). Fortunately, the spatial average molten fraction curve presented in Fig. 12 gives more direct and accurate information on P M than air temperature measurements Let’s thus define the P M melting starting time as the time for which the spatial average PCM molten fraction value is 0.01. Using this definition, the PCM melting starting time value is approximately 8 min. Without any surprise, this value is much smaller than the one estimated from air measurements or numerical calculations (20 min): because of high heat transfers that occur on the leading edges of this LHTES device, the melting process begins very early in the storage energy process.
The temperature difference in Fig. 9 to Fig. 11, between air (dash-dotted lines) and tubes (dashed lines) are higher than between tubes and PCM (solid lines). Therefore, the limiting factor of heat transfer is due to the properties of the air boundary layer at the interface air/tubes. From this observation, it can be stated that increasing heat transfers inside the current LHTES device should mainly be achieved from improvements of the transfer between air and tubes. For such a LHTES device as the one considered in the present paper, conductivity doping of the PCM is not useful. It could be furthermore counterproductive since this technical doping solutions tends to reduce the PCM quantity in the LHTES device, and consequently to reduce its latent heat storage capacity.
Fig. 12 shows that the PCM is totally melted after 110 minutes at point A2 whereas it is melted
in the complete system after 290 minutes. As a consequence, the available surface for latent heat transfer decreases with the time progress of the storage process. In order to avoid this efficient surface exchange decreasing with time, one can suggest either to a design energy storage unit that contains a larger amount of PCM in its inlet location than its outlet location, or to use different PCMs with different thermal properties along the air route.
9
4.2 Comparison between Numerical and experimental results
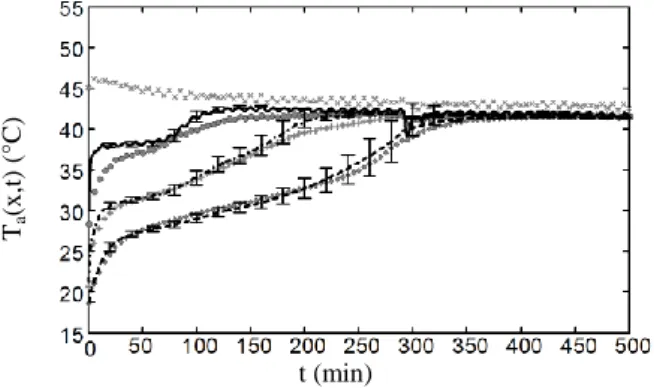
Fig. 7 shows a comparisons of temperatures at the measuring points A1, A2, A3 et A4 between
experimental and numerical results for the air velocity va =2.1 m.s
-1
. The temperatures in A1 are
the same for the simulation and the experimental results because they belong to the boundary conditions in the numerical model. A measuring error of +/-10% is estimated on air velocity. Therefore, error bars are depicted to show the influence of such a uncertainty on numerical results. Ta (x ,t) (°C) t (min)
Figure 1 : empératures de l’air en fonction du temps pour les résultats expérimentaux en A1 (x), A2 (points), A3 (croix)
et A4 (losanges) et numériques en A1 (x), A2 (continu), A3
(trait-point) et A4 (trait s) va=2.1m.s-1
Numerical results globally fit to the experimental results. However, a discrepancy is significant between the both results in the point A2. Errors bars show that does not result from the
uncertainty of air velocity. One of the consequences of this mismatching is the modelling of the heat exchange coefficient between the melting PCM and the tube wall. Indeed, the air temperature during the phase 2 (melting of the PCM) is more pronounced for numerical results, i.e the modelled heat transfer is overestimated. This modelling assumed that the close-contact melting occurs all along the tubes, whereas in practice the solid core of the melting PCM seems to be maintained at the centre of the cross section of tubes by the unmelted PCM in the remainder of the tubes which increase the thermal resistance.
Consequently, the optimisation of heat transfers between PCM and container in this type of geometry of LHTES is to segment the tubes to ensure the close contact melting in the entire energy storage.
5. Conclusion
A model has been developed to simulate the thermal transfers inside LHTES devices made of a bundle of squared-section tubes filled with PCM. This model is concerned with melting phases, when LHTES devices absorb energy from air and cool the airflow. This analysis shows that the close-contact melting is a dominating phenomenon in this kind of geometry. PCM melting is a complex physical phenomenon since the model mixes thermal and mechanical aspects. The comparison between experimental and numerical results mainly shows that modelling uncertainties are currently due to the estimation of the heat exchange coefficients between air and tube walls, because of the turbulences induced by the shape of the exchanger at the air inlet. Therefore, the Nusselt correlations for fully developed flow in-ducts are not sufficient and a corrective factor calibrated on experimental results is proposed but not approved for all conditions.
Furthermore, close contact melting is the second uncertainty because it does not occur in the first part of the melting process. Therefore, heat transfer coefficient between the PCM and the tubes at a given point of the system depends on the downstream state of melting. Consequently, it is necessary to experimentally analyse the influence of those modelling uncertainties on the
10 final results. For that purpose, a new experimental device will be set up by adding in-duct thermo regulated air heater, surface thermocouples along tube walls and airflow measurements by differential pressures in an orifice plate.
A new prototype is being manufactured for the participation to the competition Solar Decathlon Europe 2012. This new device uses plates rather than tubes to improve the compactness, the maintainability and the manufacturability of the system compared to the previous prototype.
6. References
[1] Energy Efficiency and certification of central air conditioners- study for the D.G.
Transprotation-Energy (DGTREN) of the commission of the E.U., vol. Volume 1. 2003.
[2] Pout and E R Hitchin “ he future environmental impact of room air conditioners in Europe ” presented at the ir conditioning and the low carbon challenge, Winsor, UK, 2008. [3] B alba J M Marin L F abeza and H Mehling “Review on thermal energy storage with phase change: materials heat transfer analysis and applications ” Applied Thermal Engineering, vol. 23, no. 3, pp. 251–283, 2003.
[4] Dutil D R Rousse N B alah and Lassue “ review on phase-change materials: Mathematical modeling and simulations ” Renewable and Sustainable Energy Reviews, 2010.
[5] M Lacroix “ ontact melting of a phase change material inside a heated parallelepedic capsule ” Energy conversion and management, vol. 42, no. 1, pp. 35–47, 2001.
[6] Fu usa o and M amada “Melting heat transfer inside ducts and over external bodies ” Experimental Thermal and Fluid Science, vol. 19, no. 2, pp. 93–117, Feb. 1999. [7] M O a and V P arey “ unified treatment of the direct contact melting processes in several geometric cases ” International communications in heat and mass transfer, vol. 23, no. 2, pp. 187–202, 1996.
[8] Rubi herm GmbH “R - data sheets ” www.rubitherm.com, 2011. [Online]. Available: www.rubitherm.com. [Accessed: 07-Oct-2011].
[9] “Properties of molecule: Octadecane ”
chemie.de/infotherm/html/molpages/02/66/mol26673.html. [Online]. Available: http://www.fiz-chemie.de/infotherm/html/molpages/02/66/mol26673.html. [Accessed: 14-Dec-2011].
[10] E omy ngo D Bruneau P ebastian and ommier “ aracterisation expérimentale des performances d’un échangeur à faisceau tubulaire air/M P ” in Proceedings of SFT 2011 Congress, Perpignan, France, 2011, vol. Tome 2, pp. 1005–1011.
[11] B E omy ngo “ ontribution au stoc age d’énergie thermique en bâtiment: développement d’un système actif à matériaux à changement de phase ” Ph D thesis rts et Métiers ParisTech, Talence, France, 2011.
[12] E. P. del Barrio and J.-L Dauvergne “ non-parametric method for estimating enthalpy-temperature functions of shape-stabilized phase change materials ” International Journal of Heat and Mass Transfer, vol. 54, no. 5–6, pp. 1268–1277, 2011.
[13] J.-L Dauvergne and E Palomo del Barrio “ oward a simulation-free pod approach for low-dimensional description of phase-change problems ” International Journal of Thermal Sciences, vol. 49, no. 8, pp. 1369–1382, Aug. 2010.
[14] Hirata Ma ino and Kane o “ nalysis of close-contact melting for octadecane and ice inside isothermally heated horizontal rectangular capsule ” International Journal of Heat and Mass Transfer, vol. 34, no. 12, pp. 3097–3106, Dec. 1991.
[15] F P Incropera and D P De Witt “Fundamentals of heat and mass transfer ” 1985. [16] Hirata Ma ino and Kane o “ nalysis of natural convection melting inside isothermally heated horizontal rectangular capsule ” Wärme- und Stoffübertragung, vol. 28, no. 1–2, pp. 1–9, Jan. 1993.