Science Arts & Métiers (SAM)
is an open access repository that collects the work of Arts et Métiers Institute of Technology researchers and makes it freely available over the web where possible.
This is an author-deposited version published in: https://sam.ensam.eu
Handle ID: .http://hdl.handle.net/10985/18319
To cite this version :
Emmanuelle FERRERO, Wafa SKALLI, Virginie LAFAGE, Cédric MAILLOT, Robert CARLIER, Antoine FEYDY, Adrien FELTER, Marc KHALIFE, Pierre GUIGUI - Relationships between radiographic parameters and spinopelvic muscles in adult spinal deformity patients - European Spine Journal p.1-12 - 2020
Any correspondence concerning this service should be sent to the repository
Relationships between radiographic parameters and spinopelvic
muscles in adult spinal deformity patients
Emmanuelle Ferrero1,2 · Wafa Skalli2 · Virginie Lafage3 · Cédric Maillot2 · Robert Carlier4 · Antoie Feydy5 · Adrien Felter4 · Marc Khalifé1 · Pierre Guigui1
Abstract
Introduction While the clinical impact of coronal and sagittal alignment in adult spinal deformity (ASD) patients (pts) is established, there is a paucity of data in terms of axial plane deformity and potential association between muscle degenera-tion and 3D deformity. The purpose of this study was to analyze spinopelvic muscles characteristics in associadegenera-tion with the 3D deformity of ASD patients.
Methods This is a prospective cohort study; primary lumbar scoliosis patients (Cobb > 20°) were enrolled and sustained a low-dose X-rays with 3D spinal reconstructions and a fat/water separation MRI (from C7 to the knee). Volumetric 3D reconstructions and fat infiltration (FI) of 6 muscles groups were performed. Relationships between muscular data, radio-graphic parameters and health-related quality of life were investigated. Patients were stratified and compared based on the SRS classification, the odontoid-hip axis (ODHA) angle (> or < 6.1°) and occurrence of rotatory subluxation.
Results and discussion Twenty-eight patients were enrolled with a mean age of 60 ± 16yo and mean body mass index of 26 ± 4 kg/m2 without differences between groups. There were a moderate sagittal malalignment and a Cobb angle of 45 ± 11°
(table). Muscular volume was smaller in patients with more severe deformity (p > 0.05). Pts with ODHA > 6.1° or pelvic incidence minus lumbar lordosis > 10° had significantly higher FI for the 6 muscular groups, patients with pelvic tilt > 20° had significantly higher FI for erector spinae, hip flexors and extensors (p < 0.05). SF36-PCS significantly correlated with the muscular volume; SRS and Oswestry disability index correlated with the erectors spinae volume (p < 0.05).
Conclusion This study analyzed for the first time the relationship between 3D radiographic parameters and muscular charac-teristics in ASD. Sagittal malalignment is associated with increased FI and decreased muscle volumes with poor outcomes.
p
Introduction
With aging of the population worldwide, prevalence of adult scoliosis is increasing and associated corrective sur-gery is more and more frequent [1]. While the disability of adult spinal deformity (ASD) has been clearly estab-lished in the literature [2, 3]. Its physiopathology remains unclear; multiple degenerative processes have been evoked such as bone, muscles, disks and central nervous system degeneration. Therefore, ASD analysis is complex.
When sagittal alignment occurs, several compensatory mechanisms may be recruited in an effort to maintain an erected posture, such as pelvic retroversion with hip hyper-extension, knee flexion, or change in thoracic alignment (flattening), after activation of different muscle groups [4–6]. Thereby, a better understanding of the role of mus-cles and their degeneration in the evolution of adult sco-liosis may lead to a better understanding of the pathology and therefore better treatments. To date, very few studies have investigated the role of the muscular system in the regulation of the sagittal alignment. Research on subjects without spinal deformities demonstrated an increase in fat infiltration of nearly 15% with aging [7]. Similarly, some authors have observed a decrease in volume and an increase in fat infiltration of spinal erectors in patients with loss of lumbar lordosis [8]. Others have found an association between this increase in fat infiltration and the functional discomfort associated with low back pain [9]. Nevertheless, most of these studies analyzed surface (cross-sectional area, CSA) and did include a reliable method to investigate muscular volume.
The use of new 3D reconstruction methods with MRI makes it possible to better quantify and characterize muscles, thus to better understand their impact on spi-nal deformity and its evolution [10–12]. Moal et al. were the first to use this specific MRI in spinal pathology; they described the muscles characteristics of 19 adult patients with spinal deformity [11]. Amabile et al., more recently, from a cohort of young, non-deformed subjects, reported muscle volume values from T12 to the femoral condyles, thus constituting the first database of asymptomatic sub-jects [10]. However, none of these studies analyzed the relationships between radiographic and muscular param-eters, and to our knowledge, no work exists on the relation-ship between the existence of a rotatory subluxation and soft tissue degeneration (particularly muscles).
Thus, to better understand muscles degeneration phe-nomena, such as fat infiltration and loss of volume, associ-ated with the spinal deformity, the objective of this work was to describe the characteristics of the spinal and pelvic muscles in a population of patients with adult lumbar sco-liosis and analyze their relationship with 3D radiographic
parameters, including rotatory subluxation. Our hypothesis was that coronal, sagittal and axial deformity was respon-sible for muscles degeneration.
Methods
Study
This prospective cohort study was compiled between 2016 and 2018, after local ethic committee approval. Patients over 40 years of age, with a primary degenerative lumbar scolio-sis and a Cobb angle greater than 20°, were included. Exclu-sion criteria included patients with history of spinal surgery and other causes of scoliosis (ie, neurological, congenital, traumatic, neoplastic).
Demographic and clinical data
For each patient, the following demographic data were recorded: age, sex, body mass index (BMI). Different health-related quality of life scores (HRQOL) were collected: the Oswestry disability index (ODI), the Scoliosis Research Society 30 (SRS30) and the Short Form 12 mental and phys-ical component (SF12-MCS and SF12-PCS), visual analog scale for lumbar pain (VAS-L) [13–17].
Radiographic analysis
All patients sustained a low-dose biplanar full-spine X-rays, in standing position, with the EOS system (EOS imaging, Paris, France). X-rays were performed according to a stand-ardized free standing protocol to avoid superimposition of the arm on the spine [18]. All images included at least the skull to the femoral heads. From the biplanar radiographic acquisitions, the 3D reconstructions of the spine were per-formed with an adapted methods of sterEOS software (EOS imaging, Paris, France), from the identification of specific anatomical points [19]. Thus, the vertebrae C2 to S1, the pelvis with the 2 femoral heads were reconstructed.
In the coronal plane, the Cobb angle of the main lum-bar curve was measured. Coronal imbalance was defined as coronal C7 coronal tilt greater than 3°. In the sagittal plane, spinal parameters analyzed were L1S1 lordosis, T1T12 kyphosis, and pelvic parameters with pelvic incidence (PI), pelvic tilt (PT) and sacral slope (SS). Overall sagittal align-ment was measured with T1 spinopelvic inclination angle (T1SPi) [20] and the ODHA angle, angle between the verti-cal reference line the line joining the summit of the odontoid (OD) and the center of the hip axis (HA) [21–23] (Fig. 1). Sagittal malalignment was also described using the 3 param-eters of the SRS-Schwab classification: SVA greater than 40 mm, the difference between pelvic incidence and lumbar
lordosis (PI-LL) greater than 10°, and pelvic tilt greater than 20° [24]. In the axial plane, axial intervertebral rotation (AIR) was defined as the rotation of the superior vertebra with respect to the underlying vertebra. Therefore, rotatory subluxation was defined by an axial intervertebral rotation greater than 5° and by a lateral listhesis of more than 3 mm on the frontal radiograph. Patients were separated into two groups: those with rotary subluxation (RS) and those with-out (non-RS).
MRI analysis
All patients had MRI from C7 vertebra to the femoral condyles. The axial slices were consecutive, parallel and contiguous with a constant thickness of 5 mm. The fat/ water separation MRI protocol used was the same as the one described in a previous study (Dixon method) [25].The
MRI machine was set with the following parameters: TR/ TE = 427/11.3 ms, acquisition matrix = 416 * 416 pixels, phase oversampling = 100%, in plane resolution = 0.82 mm2,
8 stages, 40 slices by stage, slice thickness = 5 mm, slice gap = 0 mm, parallel imaging acceleration factor(iPat) = 2, bandwidth = 391 Hz/pixel, echo spacing = 11.3 ms, acquisi-tion time per stage = 7 min, total acquisiacquisi-tion time = 50 min [26, 27]. A first set of images where the intensity of each voxel was correlated with the amount of water (Water image) and a second set of images where the intensity of each voxel was correlated with the amount of fat (Fat image) were auto-matically generated. These two sequences had exactly the same slices’ positions and orientations.
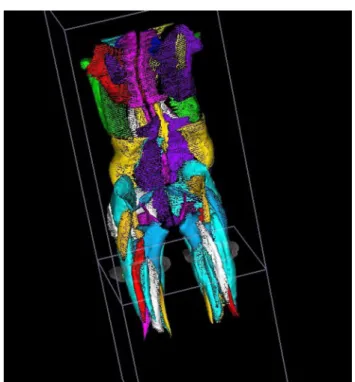
Using the DPSO (deformation of parametric specific object) method with dedicated software (Muscl’X, ENSAM, Paris, France), volumetric 3D reconstructions and fat infil-tration (FI) of right and left muscles were performed (with information from all MRI slices) [28] (Fig. 2). The fat infil-tration (FI) of 30 muscles was also evaluated by a calibration between a pure fat zone in the subcutaneous area (100% FI) and a pure muscular zone in the psoas (0% FI). Six muscle groups were defined: the posterior muscles of the thoracic belt (trapezius, rhomboid, latissimus dorsi), the erectors spi-nae (spinalis, longissimus and iliocostalis) and the flexors of the spine (abdominal, psoas, iliacs, quadratus lumborum, external and internal obliquus and transversalis), the hip extensors (biceps femoris, semi-tendinous, semi-membra-nous) and hip flexors (quadriceps and sartorius) and the pec-torals (small and large). The erector spinae were analyzed in Fig. 1 Global sagittal alignment parameters: T1 spinopelvic
incli-nation angle (T1SPi), C7 tilt, sagittal vertical axis (SVA), odontoid (OD) and the center of the hip axis (HA) angle (ODHA)
total from T1 to sacrum. The volume ratio of each muscle relative to the total muscle volume was also calculated. Statistical analysis
Statistical analysis was performed with Stata software ver-sion 15.0 (Statacorp, College Station, Texas). The normal distribution of the variables was verified by Shapiro Wilk’s test. A descriptive analysis of the demographic, clinical, radiographic and MRI (muscle volume and fat infiltration) was performed. Muscle data from the MRI were compared between the sides of the concavity and convexity. Then, the relationships between muscle characteristics, radiographic and clinical parameters were analyzed. Different patients groups were defined according SRS-Schwab classification criteria (SVA greater than 40 mm, PI-LL greater than 10°, and pelvic tilt greater than 20°) and abnormally high ODHA value (greater than 6.1°, based on analysis of asymptomatic subjects) [10, 21, 24]. Muscles characteristics (volume and FI) of patients were compared between these groups. Finally, the radiographic and muscular data of the two groups of patients without and with RS were compared. A value of
p < 0.05 was considered significant.
Results
Patients
Twenty-eight patients were enrolled, with 71% of women (n = 20). The mean age was 60 ± 16 years (40–81 years), and the average BMI was 26 ± 4 kg/m2.
Nineteen patients completed clinical scores. The mean SRS score was 2.8 ± 0.9 (2.2–4.4), the ODI score was 37.2 ± 21 with a large range of values from 4 to 60. Regard-ing quality of life, the mean value of the mental compo-nent of the SF36 was the highest (SF36 MCS = 45.3 ± 11.5 (35–58), SF36 PCS = 33.5 ± 10.5 (22–52). The mean value of the VAS-L was 6.7 ± 2.7 (2–9.3), and that of the VAS-R was 4.1 ± 3.9 (0–8.9).
Radiographic analysis
The mean lumbar Cobb angle was 45 ± 11° (24°–64°). Twenty-one patients had a coronal malalignment (in 13 cases on the left). The average coronal tilt was 2.6 ± 2.2° (0°–8.9°). The axial rotation of the apical vertebra was 28.6 ± 9.9° (10°–46°).
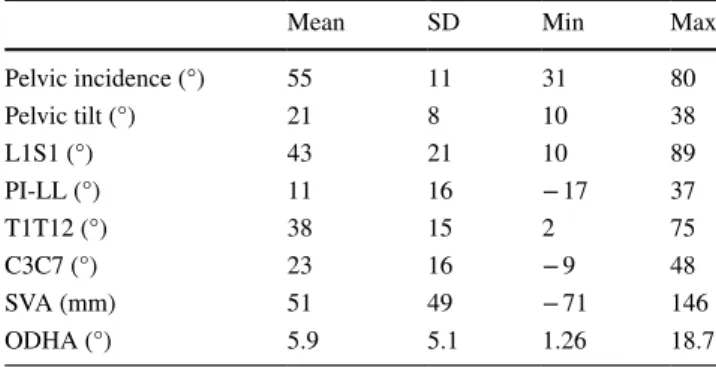
The radiographic parameters are reported Table 1. Four-teen patients had SVA > 40 mm, 10 had PT > 20°, 14 had PI-LL > 10°, and 8 had ODHA > 6.1°.
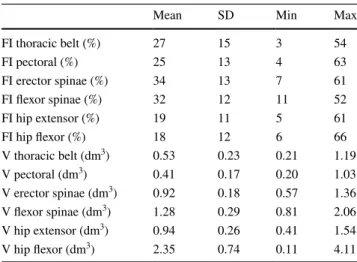
The total muscular volume was 10 ± 3 dm3. A great
vari-ability of values was observed between the different muscles
and between patients, as evidenced by the large range of volume and fat infiltration (FI) values (Fig. 3) (Table 2). For none of the thirty muscles, volumes were significantly differ-ent between the right and left sides, concavity and convex-ity. Increased infiltration for the erector spinae, abdominal, oblique and dorsal erectors was observed with regard to other muscles groups.
Comparison of patients’ muscular volume according to the importance of sagittal deformity
The comparison of patients’ total muscular volume accord-ing to the severity of sagittal deformity (Table 3) showed no significant difference either in total volume nor volume of any of the muscle groups (PT > or < 20°: 8.9 ± 3.5 dm3 vs.
10.5 ± 2.7 dm3, p = 0.20; SVA > or > 40 mm: 9.9 ± 3.1 dm3
vs. 10.4 ± 3.0 dm3, p = 0.49; PI-LL > or < 10°: 9.7 ± 1.7 dm3
vs. 10.2 ± 3.9 dm3, p = 0.72; ODHA > or < 6.1°: 9.9 ± 2.2
dm3 vs. 10.2 ± 2.2 dm3, p = 0.83). The muscles volumes
of patients with an ODHA > 6.1° tend to be lower than the volumes of the other patients, except for the spinal flexors. Comparison of patients’ muscular fat infiltration according to the importance of sagittal deformity In contrast, comparison of patients’ muscular fat infiltration according to the severity of sagittal deformity demonstrated significant differences between groups (Table 4).
FI was greater for all muscle groups in patients with PT > 20° than those with PT < 20° and significantly for spi-nal erectors, hip flexors and extensors. The detailed aspi-nalysis of the gluteus medius revealed that if the volume was not dif-ferent between the 2 groups (0.54 ± 0.06 dm3 vs. 0.52 ± 0.07
dm3, p = 0.66), fat infiltration was greater in the group with
greater retroversion (30% ± 12 vs. 19% ± 9, p = 0.008). FI was greater for all muscle groups in patients with SVA > 40 mm and significantly for upper thoracic muscles, erectors and flexors of the spine.
Table 1 Sagittal radiographic parameters of 28 adults with lumbar scoliosis
Mean SD Min Max
Pelvic incidence (°) 55 11 31 80 Pelvic tilt (°) 21 8 10 38 L1S1 (°) 43 21 10 89 PI-LL (°) 11 16 − 17 37 T1T12 (°) 38 15 2 75 C3C7 (°) 23 16 −9 48 SVA (mm) 51 49 − 71 146 ODHA (°) 5.9 5.1 1.26 18.7
Similarly, FI was significantly greater for all muscle groups in patients with loss of lumbar lordosis of more than 10°, except for the abdominals. Detailed analysis of the obliquus and psoas revealed that if the volume was not different between the 2 groups of patients (respec-tively, 0.41 ± 0.08 dm3 vs. 0.44 ± 0.07 dm3, p = 0.71 and
0.44 ± 0.03 dm3 vs. 0.44 ± 0.04 dm3, p = 0.58), the fat
infiltration was greater in the group with a greater loss of lordosis (respectively, 37% ± 11 vs. 29% ± 10, p = 0.04 and 36% ± 11 vs. 25% ± 12, p = 0.03). Fat infiltration of the gluteus medius was also greater in this group (26% ± 8 vs. 17% ± 9, p = 0.01).
FI tended to be greater for all muscle groups in patients with ODHA > 6.1° (p > 0.05), except for abdominals (Fig. 4). Comparison of patients with and without rotatory
subluxation (RS) (Table 5)
Seventeen patients (61%) presented with RS, most often at L3L4 level (76% of cases, n = 13). Demographics were not significantly different between patients with and without RS. The radiographic parameters are reported in Table 1, with-out difference between groups. The average Cobb angle was 45 ± 11°. Nevertheless, in the sagittal plane, patients with RS had a tendency to a greater loss of lordosis (15 ± 15° vs. 7 ± 15°, p > 0.05) and to a larger anterior tilt (0.6 ± 7° vs. − 1.4 ± 4°, p > 0.05). Mean intervertebral axial rotation at the rotatory subluxation stage was 17.0 ± 5°.
The average total volume of the muscles was 10 ± 2 dm3.
There was a nonsignificant difference of 1.4 dm3 in total
volume between the 2 groups of patients. The spinal erec-tors and flexors, and the hip flexors were smaller in the RS group, but without significant difference, while the volume of the abdominus and hip extensors was similar between the groups.
The particular study of the volume of spinalis, longis-simus, iliocostalis, psoas and gluteus medius did not find any significant difference between the 2 groups of patients, although the volumes are always lower in the RS group (on average of 0.1 dm3).
Fat infiltration was more important for patients with RS (particularly spinal erectors, hip extensors and abdominus) between 20–42% versus 17–35% fat infiltration for patients Fig. 3 Fat infiltration of the main spinopelvic muscles
Table 2 Fat infiltration (FI) and volume (V) of the muscles groups in
the cohort (n = 28)
Mean SD Min Max
FI thoracic belt (%) 27 15 3 54 FI pectoral (%) 25 13 4 63 FI erector spinae (%) 34 13 7 61 FI flexor spinae (%) 32 12 11 52 FI hip extensor (%) 19 11 5 61 FI hip flexor (%) 18 12 6 66 V thoracic belt (dm3) 0.53 0.23 0.21 1.19 V pectoral (dm3) 0.41 0.17 0.20 1.03 V erector spinae (dm3) 0.92 0.18 0.57 1.36 V flexor spinae (dm3) 1.28 0.29 0.81 2.06 V hip extensor (dm3) 0.94 0.26 0.41 1.54 V hip flexor (dm3) 2.35 0.74 0.11 4.11
Table 3 Com par ison of patients ’ muscular v olume accor ding t o t he im por tance of sagitt al def or mity ( n = 28): pel vic tilt g reater t han 20°, a S VA > 40 mm, PI-LL > 10°, ODHA > 6.1° and t he res t of t he cohor t Volume (dm 3 ) PT > 20° (n = 10) PT < 20° (n = 18) p SV A > 40 mm (n = 14) SV A < 40 mm (n = 14) p PI-LL > 10° (n = 14) PI-LL < 10° (n = 14) p ODHA > 6.1° (n = 8) ODHA < 6.1° (n = 20) p Mean SD Mean SD Mean SD Mean SD Mean SD Mean SD Mean SD Mean SD Thor acic belt 0.55 0.19 0.52 0.26 0.68 0.50 0.18 0.56 0.29 0.54 0.49 0.18 0.56 0.28 0.44 0.49 0.11 0.53 0.24 0.72 Er ect or spinae 0.86 0.91 0.96 0.99 0.33 0.90 0.1 0.94 0.1 0.63 0.9 0.1 0.96 0.1 0.46 0.86 0.11 0.92 0.1 0.40 Fle xor spinae 1.2 0.25 1.3 0.32 0.38 1.31 0.16 1.26 0.39 0.69 1.24 0.21 1.31 0.35 0.56 1.32 0.21 1.22 0.26 0.50 Pect or al 0.42 0.12 0.41 0.21 0.94 0.39 0.12 0.44 0.23 0.43 0.36 0.12 0.45 0.21 0.31 0.04 0.41 0.15 0.12 Abdominus 0.24 0.03 0.28 0.04 0.28 0.26 0.04 0.28 0.04 0.88 0.24 0.03 0.3 0.04 0.13 0.22 0.04 0.27 0.04 0.29 Hip fle xor 2.12 0.72 2.47 0.74 0.25 2.34 0.68 2.36 0.83 0.95 2.12 0.58 2.56 0.82 0.12 2.22 0.56 2.33 0.71 0.72 Hip e xtensor 0.95 0.29 0.94 0.26 0.95 0.95 0.25 0.93 0.28 0.85 0.87 0.19 1.0 0.31 0.23 0.92 0.23 0.93 0.28 0.93 Table 4 Com par ison of patients ’ muscular f at infiltr ation accor ding t o t he im por tance of sagitt al def or mity ( n = 28): pel vic tilt g reater t han 20, S VA > 40 mm, PI-LL > 10° and ODHA > 6.1° and the r es t of t he cohor t Fat infiltr ation (%) PT > 20° (n = 10) PT < 20° (n = 18) p SV A > 40 mm (n = 14) SV A < 40 mm (n = 14) p PI-LL > 10° (n = 14) PI-LL < 10 (n = 14)° p ODHA > 6.1° (n = 8) ODHA < 6.1° (n = 20) p Mean SD Mean SD Mean SD Mean SD Mean SD Mean SD Mean SD Mean SD Thor acic belt 31 16 25 15 0.37 32 14 21 15 0.04 35 14 20 14 0.009 28 20 23 14 0.46 Er ect or spinae 45 10 36 10 0.049 43 8 35 12 0.04 44 9 35 10 0.02 42 13 38 10 0.35 Fle xor spinae 36 10 31 12 0.29 39 10 28 12 0.03 39 10 27 11 0.01 33 16 30 12 0.60 Pect or al 31 16 21 0.07 28 14 21 13 0.14 31 14 19 10 0.02 26 22 22 11 0.61 Abdominus 39 10 34 12 0.3 39 11 33 11 0.17 38 11 34 12 0.32 35 16 36 12 0.93 Hip fle xor 25 18 15 0.049 23 15 14 8 0.07 24 15 13 7 0.03 22 22 15 7 0.30 Hip e xtensor 25 16 16 8 0.048 23 13 15 8 0.08 24 13 15 7 0.04 23 20 17 7 0.35
without RS (p > 0.05) (Fig. 5). The most infiltrated muscles were the extensors and flexors of the spine, and then the abdominus. Hip flexors and extensors were the least infil-trated muscles in both groups (Fig. 6).
Correlation analysis (Table 6)
Age was inversely correlated with hip flexor and psoas volumes (R = − 0.553, p < 0.05). BMI correlated with vol-umes of spinal erectors, spinal flexors, psoas and obliquus (0.413 < R < 0.687, p < 0.05).
Significant correlations existed between radiographic and muscle parameters. Axial intervertebral rotation cor-related with the fat infiltration of several muscle groups, specifically psoas, spinal erectors, latissimus dorsi, abdomi-nus and obliquus (0.65 < R < 0.89, p < 0.05). SVA was mod-erately correlated with fat infiltration of the spinal erec-tor (0.46 < R < 0.51, p < 0.05). The PI-LL mismatch was moderately correlated with increased fat infiltration of all muscle groups (0.456 < R < 0.551, p < 0.05). The detailed muscle analysis revealed significant correlations between pelvic tilt and abdominus volume (R = − 0.426, p < 0.05). Fig. 4 Muscular reconstructions of a patient with ODHA > 6.1° (top) and a patient with ODHA < 6.1° (bottom). Higher FI and less muscles vol-ume is observed on patient with ODHA > 6.1°
Table 5 Comparison of muscle
volumes and fat infiltration between patients with and without RS
Volume (dm3) Fat infiltration (%)
Without RS
(n = 11) RS (n = 17) p Without RS (n = 11) RS (n = 17) p
Mean SD Mean SD Mean SD Mean SD
Thoracic belt 0.57 0.27 0.51 0.23 0.57 26 17 15 0.70 Erector spinae 0.97 0.90 0.90 0.97 0.35 22 11 42 13 0.09 Flexor spinae 1.31 0.36 1.27 0.26 0.76 31 15 34 11 0.59 Pectoral 0.45 0.24 0.39 0.14 0.39 22 13 26 14 0.50 Abdominus 0.7 0.2 0.7 0.2 0.76 29 10 35 9 0.17 Hip flexor 2.48 0.83 2.28 0.70 0.50 17 9 20 14 0.15 Hip extensor 0.94 0.28 0.94 0.26 0.99 18 9 23 13 0.61
No correlation was found between muscle parameters and cervical lordosis or thoracic kyphosis.
Correlations were also observed between the clinical scores available for 19 patients and the muscle parameters. The physical component of the SF12 quality of life score
correlated well with the volume of spinal erector (R = 0.662,
p < 0.05), psoas (R = 0.767, p < 0.05), gluteal means
(R = 0.729, p < 0.05). SRS 30 and ODI correlated with spi-nal erector volume (respectively, R = 0.750 and R = 0.640,
p < 0.05). No correlation with fat infiltration was observed.
Fig. 5. Sixty-one-year-old patient with L3L4 rotatory subluxation, with significant fat infiltration of muscles, particularly spinal erectors and abdominals
Discussion
In this study, in addition to analyzing the 3D radiographic parameters of a cohort of patients with adult lumbar sco-liosis, we provided information on the characteristics of major spinal and pelvic muscle groups. This study also established relationships between radiographic data of the deformity and muscle data (particularly Cobb angle, SVA and axial rotation); the importance of deformity was asso-ciated with a significant increase in fat infiltration and a tendency to decrease certain muscle volume.
A large intermuscular and interindividual variabil-ity was observed for muscle volumes and fat infiltration (Fig. 3). The muscle group most affected by FI was the spinal erector group (34%), followed by the spinal flexors (32%). The least affected muscles were hip flexors and extensors (19% and 18%). Moal et al., in a study of 19 women with spinal deformity, found similar results with 31.9% fat infiltration of the same group [25]. However, they described a more important fat infiltration of the hip extensors.
In our study, the analysis of the relationships between muscles and deformity demonstrated that sagittal deformity was associated with significantly greater fat infiltration. This concerned particularly the flexors and extensors of the spine, in the case of pelvic retroversion of more than 20°, of SVA of more than 40 mm, of PI-LL of more than 10°. Pelvic ret-roversion was also associated with increased fat infiltration of the gluteus medius. In addition, in the case of lack of lum-bar lordosis, all muscle groups had increased fat infiltration. All of these degenerative phenomena may be associated with difficulty in maintaining an erect posture. Relationships have also been observed between intervertebral axial rotation and muscle degeneration. One of our hypotheses was that mus-cle degeneration could be more important in the concavity of the curvature. However, no difference could be detected between the muscles of concavity and convexity, whereas
Shafaq et al. observed a fat degeneration of the psoas more important in the concavity of the curvature [29].
While correlations were observed between the volume of the hip flexor and age, these correlations were not found with the extensor or flexor muscles of the spine, showing that the degeneration of these muscles was not only related to the physiological aging changes but that there is a close association with the deformity. Analysis of correlations with radiographic and muscular parameters confirmed the rela-tionship between deformity and involvement of the main muscles responsible for maintaining spinopelvic alignment. Indeed, a defect in the sagittal alignment was associated with an increase in the fat infiltration of the spinal erector, thus making it possible to explain the failure to maintain the extension of the spine. In addition, there were even more important correlations between axial intervertebral rota-tion at the level of rotatory subluxarota-tion and fat infiltrarota-tion of spinal erectors and flexors, as well as with hip flexors. These results suggested an overall muscle degeneration in these patients with degenerative scoliosis. Yagi and Shafaq obtained similar conclusions with a more important decrease of psoas and multifidus volume in patients with degenerative scoliosis than in those with a single lumbar spinal stenosis. They also observed fat infiltration of spinal erectors propor-tional to the Cobb angle, but these studies were performed from cross-sectional area analysis on a single lumbar level [29, 30].
In adult degenerative scoliosis, there are an evolution of the deformity with the appearance of rotary subluxation and an aggravation of the lateral or anterior tilt, which can lead the patient in a situation of great imbalance. The fac-tors responsible for this aggravation are not clearly defined. Nevertheless, in this study, a trend of decreased volume of erectors and flexors of the spine, but also of the extensors and flexors of hip in patients with RS, was observed. More than the loss of volume, it is the fat infiltration of these 4 muscle groups that was greater in patients with RS (23–42%) Table 6 Analysis of correlations
between radiographic, demographic and muscular parameters (n = 28) (AIR RS: axial intervertebral rotation at the rotatory subluxation level)
Age BMI PT L1S1 PI-LL SVA AIR RS
V thoracic belt (dm3) V pectoral (dm3) V erector spinae (dm3) 0.587 V flexor spinae (dm3) 0.618 V hip extensor (dm3) V hip flexor (dm3) − 0.538 − 0.396 − 0.43 FI thoracic belt (%) − 0.503 0.456 FI pectoral (%) − 0.465 0.463 FI erector spinae (%) 0.423 − 0.544 0.484 0.465 0.755 FI flexor spinae (%) 0.4 −0.561 0.511 0.409 0.645 FI hip extensor (%) −0.492 0.541 0.415 FI hip flexor (%) − 0.502 0.551 0.533
than those without RS (13–29%). It is interesting to note that the fat infiltration values of patients without RS were close to the values found by Moal et al. in his study on ASD women [25].
Given the muscular degeneration in patients with spinal deformity but also existing relationships between muscle characteristics and radiographic parameters of the deformity, it might be interesting to perform a preoperative exploration of these patients and offer a pre-habilitation program. These findings may help to choose the length of fusion by not stop-ping in the thoraco-lumbar zone in the case of advanced muscular degeneration in order to avoid the occurrence of junctional kyphosis. Hyun et al., for example, in its series of 44 operated adult scoliosis found that a fat infiltration of spinal erectors of more than 60% was a risk factor for post-operative junctional kyphosis [31].
Limitations
This study had some limitations, including the small size of the cohort, which may explain the lack of significant differ-ence on some results. One of the reasons of the small cohort is the MRI method which is very specific and difficult to perform; the other reason is that MRI reconstructions are very time-consuming (15 h/patients). Nevertheless, it is one of the most important series of patients with scoliosis in adults and 3D muscle analysis (and not cross-sectional area analysis). The addition of an electromyographic evaluation could have made it possible to better analyze the denervation of the muscles [32]. And of course, a dynamic study of these patients would be interesting. In addition, the assessment of fat infiltration was performed from the psoas.
Finally, although a premise of relationship between mus-cle degeneration and deformity is now established, we have no answer about the role of muscles as a cause or conse-quence of deformity. Another hypothesis on the pathophysi-ology of degenerative lumbar scoliosis is that the lumbar curvature is itself a compensatory mechanism after disk fail-ure and lateral listhesis. Moreover, in clinical practice, some patients with neurological signs such as extra-pyramidal symptoms (Parkinson’s disease) have progressive deformi-ties despite a preserved physical activity. It is therefore likely that certain genetic determinants are also involved in degen-erative deformity. However, few studies have been conducted in this direction and a longitudinal study on a large cohort would be necessary to know the primum movens of de novo scoliosis. Moreover, the existence of correlation between muscle parameters and quality of life raises the question of the benefit of rehabilitation with muscle reinforcement in these patients. Similarly, Miyakoshi in studies on postmeno-pausal women (which are often ASD patients) observed that decrease in back extensor strength was associated with poor quality of life [33, 34].
Conclusion
This study analyzed for the first time the relationship between 3D radiographic parameters and muscular char-acteristics in ASD. There is a great variability of muscles characteristic among patients. We observed a tendency toward a loss of volume and an increase in fat infiltration in relation to the coronal and axial parameters. Neverthe-less, sagittal malalignment, particularly anterior tilt and loss of lumbar lordosis, was associated with increased fat infiltration for all muscle groups (more severely for erec-tor spinae, hip flexor and extensor), and decreased muscle volumes were associated with worst outcomes. Thus, the detailed muscular analysis is interesting to consider in the therapeutic strategy and surgical planning to avoid some complications.
However, a longitudinal study with a larger cohort is needed to analyze the evolution of these parameters in degenerative scoliosis. In addition, the comparison with healthy subjects would help to better understand age-related muscle degenerative phenomena and those age-related to deformity.
Compliance with ethical standards
Conflict of interest We have no potential conflict of interest.
References
1. Kebaish KM, Neubauer PR, Voros GD, Khoshnevisan MA, Sko-lasky RL (2011) Scoliosis in adults aged forty years and older: prevalence and relationship to age, race, and gender. Spine 36(9):731–736
2. Bess S, Line B, Fu K-M, McCarthy I, Lafage V, Schwab F et al (2016) The health impact of symptomatic adult spinal deform-ity: comparison of deformity types to United States population norms and chronic diseases. Spine 41(3):224–233
3. Pellisé F, Casademunta A, Ferrer M, Sàbat M, Bagó J, FJS et al (2015) Impact on health related quality of life of adult spinal deformity (ASD) compared with other chronic conditions. Eur Spine J Off Publ Eur Spine Soc Eur Spinal Deform Soc Eur Sect Cerv Spine Res Soc 24(1):3–11
4. Diebo BG, Varghese JJ, Lafage R, Schwab FJ, Lafage V (2015) Sagittal alignment of the spine: What do you need to know? Clin Neurol Neurosurg 139:295–301
5. Ferrero E, Liabaud B, Challier V, Lafage R, Diebo BG, Vira S et al (2016) Role of pelvic translation and lower-extremity com-pensation to maintain gravity line position in spinal deformity. J Neurosurg Spine 24(3):436–446
6. Diebo BG, Ferrero E, Lafage R, Challier V, Liabaud B, Liu S et al (2015) Recruitment of compensatory mechanisms in sagittal spinal malalignment is age and regional deformity dependent: a full-standing axis analysis of key radiographical parameters. Spine 40(9):642–649
7. Meakin JR, Fulford J, Seymour R, Welsman JR, Knapp KM (2013) The relationship between sagittal curvature and extensor muscle volume in the lumbar spine. J Anat 222(6):608–614 8. Kang CH, Shin MJ, Kim SM, Lee SH, Lee C-S (2007) MRI of
paraspinal muscles in lumbar degenerative kyphosis patients and control patients with chronic low back pain. Clin Radiol 62(5):479–486
9. Teichtahl AJ, Urquhart DM, Wang Y, Wluka AE, Wijethilake P, O’Sullivan R et al (2015) Fat infiltration of paraspinal muscles is associated with low back pain, disability, and structural abnor-malities in community-based adults. Spine J Off J North Am Spine Soc 15(7):1593–1601
10. Amabile C, Moal B, Chtara OA, Pillet H, Raya JG, Iannessi A et al (2017) Estimation of spinopelvic muscles’ volumes in young asymptomatic subjects: a quantitative analysis. Surg Radiol Anat SRA 39(4):393–403
11. Zhang C, Moal B, Dubois G, Raya J, Lafage V, Skalli W (2014) Comparison of two MRI sequences for subject-specific 3D thigh muscle reconstruction. Comput Methods Biomech Biomed Eng 17(1):136–137
12. Gille O, Jolivet E, Dousset V, Degrise C, Obeid I, Vital J-M et al (2007) Erector spinae muscle changes on magnetic resonance imaging following lumbar surgery through a posterior approach. Spine 32(11):1236–1241
13. McHorney CA, Ware JE, Rogers W, Raczek AE, Lu JF (1992) The validity and relative precision of MOS short- and long-form health status scales and Dartmouth COOP charts. Results from the Medical Outcomes Study. Med Care 30(Suppl):MS253–MS265 14. Asher M, Min Lai S, Burton D, Manna B (2003) The reliability
and concurrent validity of the scoliosis research society-22 patient questionnaire for idiopathic scoliosis. Spine 28(1):63–69 15. Lonjon G, Ilharreborde B, Odent T, Moreau S, Glorion C, Mazda
K (2014) Reliability and validity of the French–Canadian version of the scoliosis research society 22 questionnaire in France. Spine 39(1):E26–34
16. Vogler D, Paillex R, Norberg M, de Goumoëns P, Cabri J (2008) Cross-cultural validation of the Oswestry disability index in French. Ann Readaptation Med Phys Rev Sci Soc Francaise Reeducation Fonct Readaptation Med Phys 51(5):379–385 17. Grönblad M, Hupli M, Wennerstrand P, Järvinen E, Lukinmaa
A, Kouri JP et al (1993) Intercorrelation and test-retest reliability of the Pain Disability Index (PDI) and the Oswestry Disability Questionnaire (ODQ) and their correlation with pain intensity in low back pain patients. Clin J Pain 9(3):189–195
18. Faro FD, Marks MC, Pawelek J, Newton PO (2004) Evaluation of a functional position for lateral radiograph acquisition in ado-lescent idiopathic scoliosis. Spine 29(20):2284–2289
19. Humbert L, De Guise JA, Aubert B, Godbout B, Skalli W (2009) 3D reconstruction of the spine from biplanar X-rays using para-metric models based on transversal and longitudinal inferences. Med Eng Phys 31(6):681–687
20. Vialle R, Levassor N, Rillardon L, Templier A, Skalli W, Guigui P (2005) Radiographic analysis of the sagittal alignment and bal-ance of the spine in asymptomatic subjects. J Bone Joint Surg Am 87(2):260-267
21. Amabile C, Pillet H, Lafage V, Barrey C, Vital J-M, Skalli W (2016) A new quasi-invariant parameter characterizing the pos-tural alignment of young asymptomatic adults. Eur Spine J Off
Publ Eur Spine Soc Eur Spinal Deform Soc Eur Sect Cerv Spine Res Soc 25(11):3666–3674
22. Ferrero E, Lafage R, Vira S, Rohan PY, Oren J, Delsole E, Gui-gui P, Schwab F, Lafage V, Skalli W (2017) Three-dimensional reconstruction using stereoradiography for evaluating adult spinal deformity: a reproducibility study. Eur Spine J 26(8):2112–2120 23. Ilharreborde B, Steffen JS, Nectoux E, Vital JM, Mazda K, Skalli W et al (2011) Angle measurement reproducibility using EOS three-dimensional reconstructions in adolescent idi-opathic scoliosis treated by posterior instrumentation. Spine 36(20):E1306–E1313
24. Schwab F, Farcy J-P, Bridwell K, Berven S, Glassman S, Harrast J et al (2006) A clinical impact classification of scoliosis in the adult. Spine 31(18):2109–2114
25. Moal B, Bronsard N, Raya JG, Vital JM, Schwab F, Skalli W et al (2015) Volume and fat infiltration of spino-pelvic musculature in adults with spinal deformity. World J Orthop 6(9):727–737 26. Dixon WT (1984) Simple proton spectroscopic imaging.
Radiol-ogy 153(1):189–194
27. Ragan DK, Bankson JA (2010) Two-point Dixon technique pro-vides robust fat suppression for multi-mouse imaging. J Magn Reson Imaging JMRI 31(2):510–514
28. Hausselle J, Assi A, El Helou A, Jolivet E, Pillet H, Dion E et al (2014) Subject-specific musculoskeletal model of the lower limb in a lying and standing position. Comput Methods Biomech Biomed Eng 17(5):480–487
29. Shafaq N, Suzuki A, Matsumura A, Terai H, Toyoda H, Yas-uda H et al (2012) Asymmetric degeneration of paravertebral muscles in patients with degenerative lumbar scoliosis. Spine 37(16):1398–1406
30. Yagi M, Hosogane N, Watanabe K, Asazuma T, Matsumoto M, Keio Spine Research Group (2016) The paravertebral muscle and psoas for the maintenance of global spinal alignment in patient with degenerative lumbar scoliosis. Spine J Off J North Am Spine Soc 16(4):451–458
31. Hyun S-J, Kim YJ, Rhim S-C (2016) Patients with proximal junc-tional kyphosis after stopping at thoracolumbar junction have lower muscularity, fatty degeneration at the thoracolumbar area. Spine J Off J North Am Spine Soc 16(9):1095–1101
32. Haig AJ (2002) Paraspinal denervation and the spinal degenerative cascade. Spine J Off J North Am Spine Soc 2(5):372–380 33. Miyakoshi N, Kudo D, Hongo M, Kasukawa Y, Ishikawa Y,
Shimada Y (2017) Comparison of spinal alignment, muscular strength, and quality of life between women with postmenopau-sal osteoporosis and healthy volunteers. Osteoporos Int J Establ Result Coop Eur Found Osteoporos Natl Osteoporos Found USA 28(11):3153–3160
34. Miyakoshi N, Hongo M, Maekawa S, Ishikawa Y, Shimada Y, Itoi E (2007) Back extensor strength and lumbar spinal mobility are predictors of quality of life in patients with postmenopausal osteoporosis. Osteoporos Int J Establ Result Coop Eur Found Osteoporos Natl Osteoporos Found USA 18(10):1397–1403
Affiliations
Emmanuelle Ferrero1,2 · Wafa Skalli2 · Virginie Lafage3 · Cédric Maillot2 · Robert Carlier4 · Antoie Feydy5 · Adrien Felter4 · Marc Khalifé1 · Pierre Guigui1
* Emmanuelle Ferrero emmanuelle.ferrero@aphp.fr
1 Department of Orthopaedic Surgery, Hopital Européen
Georges Pompidou, APHP, Paris V University, 20 Rue Leblanc, 75015 Paris, France
2 Laboratoire de biomécanique Georges Charpak, Ecole
Nationale supérieure Des Arts Et métiers, 75013 Paris, France
3 SpineLab, Department of Orthopaedic Surgery, Hospital
for Special Surgery, New York, NY, USA
4 Department of Radiology, Hopital de Garches, APHP,
Garches, France
5 Department of Radiology, Hopital Cochin, APHP, Paris V