HAL Id: hal-00295253
https://hal.archives-ouvertes.fr/hal-00295253
Submitted on 17 Apr 2003
HAL is a multi-disciplinary open access
archive for the deposit and dissemination of
sci-entific research documents, whether they are
pub-lished or not. The documents may come from
teaching and research institutions in France or
abroad, or from public or private research centers.
L’archive ouverte pluridisciplinaire HAL, est
destinée au dépôt et à la diffusion de documents
scientifiques de niveau recherche, publiés ou non,
émanant des établissements d’enseignement et de
recherche français ou étrangers, des laboratoires
publics ou privés.
during the MINOS campaign
M. Traub, H. Fischer, M. de Reus, R. Kormann, H. Heland, H. Ziereis, H.
Schlager, R. Holzinger, J. Williams, C. Warneke, et al.
To cite this version:
M. Traub, H. Fischer, M. de Reus, R. Kormann, H. Heland, et al.. Chemical characteristics assigned
to trajectory clusters during the MINOS campaign. Atmospheric Chemistry and Physics, European
Geosciences Union, 2003, 3 (2), pp.459-468. �hal-00295253�
Atmos. Chem. Phys., 3, 459–468, 2003
www.atmos-chem-phys.org/acp/3/459/
Atmospheric
Chemistry
and Physics
Chemical characteristics assigned to trajectory clusters during the
MINOS campaign
M. Traub1, H. Fischer1, M. de Reus1, R. Kormann1, J. Heland2, H. Ziereis2, H. Schlager2, R. Holzinger1, J. Williams1, C. Warneke3, J. de Gouw3, and J. Lelieveld1
1Max Planck Institute for Chemistry, Mainz, Germany
2Institute for Atmospheric Physics, German Aerospace Center, DLR, Oberpfaffenhofen, Germany 3NOAA Aeronomy Laboratory, Boulder, Colorado, USA
Received: 26 November 2002 – Published in Atmos. Chem. Phys. Discuss.: 10 January 2003 Revised: 19 March 2003 – Accepted: 2 April 2003 – Published: 17 April 2003
Abstract. During the Mediterranean Intensive Oxidant Study (MINOS) in August 2001 a total of 14 measurement flights were performed with the DLR Falcon jet aircraft from Heraklion, Crete. One objective of this campaign was to in-vestigate the role of long-range transport of pollutants into the Mediterranean area. An analysis of 5-day back trajec-tories indicates that in the lower troposphere (0–4 km) air masses originated from eastern and western Europe, in the mid-troposphere (4–8 km) from the North Atlantic Ocean region and in the upper troposphere (8–14 km) from North Atlantic Ocean/North America (NANA) as well as South Asia. We allocated all back trajectories to clusters based on their ending height and source region. The mixing ra-tios of ozone, nitrogen oxide, total reactive oxidized nitrogen (NOy), formaldehyde, methanol, acetonitrile, acetone,
per-oxyacetyl nitrate (PAN), carbon dioxide, carbon monoxide and methane measured along the flight tracks are examined in relation to the different cluster trajectories. In the lower troposphere the mean trace gas mixing ratios of the east-ern Europe cluster trajectories were significantly higher than those from western Europe. In the upper troposphere air from the NANA region seems to be influenced by the stratosphere, in addition, air masses were transported from South Asia, be-ing influenced by strong convection in the Indian monsoon.
1 Introduction
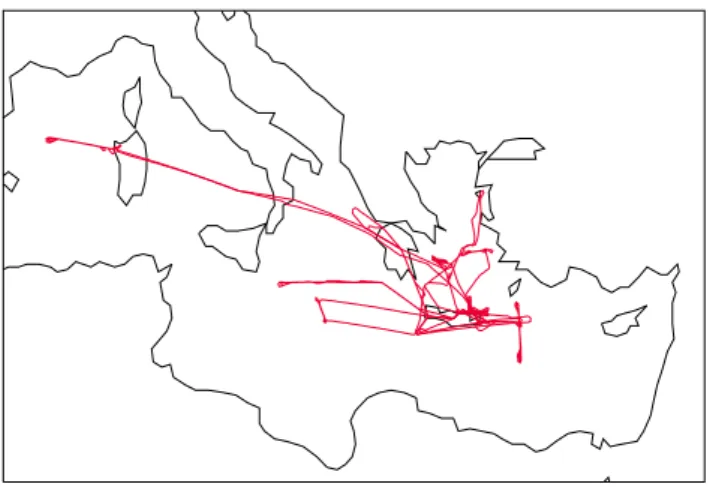
A large number of chemical measurements was made from the DLR Falcon aircraft during the Mediterranean Intensive Oxidant Study (MINOS) flights in August 2001. The flight tracks of this experiment are shown in Fig. 1. The measure-ments were designed to explore the role of long-range trans-port of pollutants into the Mediterranean basin. As a result of
Correspondence to: M. Traub
the regional meteorological conditions (cloud-free, high tem-peratures and intense solar radiation), photochemistry can be very active (Kouvarakis et al., 2000), and the area is sensi-tive to air pollution. An overview is given by Lelieveld et al. (2002).
Backward trajectory analysis has become a widely used method for interpretation of trace gas measurements in rela-tion to large-scale air mass transport (Moody et al., 1995). The trajectories can be categorized into particular clusters to characterize different types of air masses. In most cases, the origin of the air masses and their transport routes have been used as the main criteria for clustering. By assuming that the chemical composition changes at the same rate along all transport paths, the variability in the measured trace gas con-centrations can be explained in terms of the trajectory ori-gin and emission influences along the route (Pochanart et al., 2001).
It should be mentioned, however, that the implicit assump-tion that the trajectories accurately represent transport path-ways may sometimes be incorrect. There are many uncer-tainties involved in the measurements of the meteorological conditions, the generation of reanalysis data with help of the observed parameters and assimilation methods, the interpola-tion of the wind in time and space, and also the representainterpola-tion of small-scale effects (e.g. convection) in the meteorological data. Stohl (1998) estimated the accuracy of computed trajec-tories with position errors up to 20% of the travel distance. Nevertheless, trajectories provide a useful tool to character-ize patterns in the large-scale motion.
In the next Section a short overview of the measurement techniques on board the Falcon is given. In Section 3 a gen-eral overview of the large-scale circulation over the Mediter-ranean area is presented. Section 4 subsequently describes the model used, and Section 5 presents the three-dimensional trajectory analysis and the chemical characteristics of the dif-ferent trajectory clusters. Section 6 concludes by summariz-ing the relative importance of different source regions.
c
Fig. 1. Flight tracks of the DLR Falcon aircraft over the eastern and
central Mediterranean Sea during MINOS in August 2001.
2 Measurement techniques
CO, CO2 , CH4 , CH3OH , CH3COCH3 , CH3CN , PAN
and HCHO were measured by the Max Planck Institute for Chemistry, Mainz, Germany.
For CO, CO2and CH4a Tunable Diode Laser Absorption
Spectrometer (TDLAS), with a time resolution of 6 s, was used. The precision was 1.5 ppm for CO2, 1.5 ppbv for CO
and 16.5 ppb for CH4and the average accuracy was 1% for
all species. A detailed description of the instrument can be found in Wienhold et al. (1998).
The mixing ratios of CH3OH , CH3CN , CH3COCH3
and PAN were measured using proton-transfer reaction mass spectrometry (PTR-MS). The accuracy for CH3OH was
20%, for CH3CN and CH3COCH315%. The measurement
technique is described in detail by Lindinger et al. (1998) and by Holzinger et al. (2003).
The measurement of HCHO was based on the fluorimetric detection of the Hantzsch reaction product, as originally de-scribed by Belman (1963). The instrument’s noise is about 1.5% of the concentration reading up to concentrations of about 20 ppbv. A detailed description of these measurements is given by Kormann et al. (2003).
NO, NOyand O3were measured by the DLR
Oberpfaffen-hofen, Germany. For NO and NOya chemiluminescence
de-tector was used. The accuracy of the NO and NOy
measure-ments is 5% and 15%, respectively, for concentration levels of 1 ppbv. O3is measured with the UV absorption technique
with an accuracy of 5%. Details of the instruments are given in Schlager et al. (1997) and Ziereis et al. (2000).
3 Meteorological situation
The mean flow in the extratropics is characterized by the westerlies. The geographical position of the Azores High and the Icelandic Low can modify the zonal flow and therefore
have a great impact on the weather in Central Europe and the Mediterranean region. When the High and Low are strongly developed and therefore the pressure gradient is relatively high, relatively moist air masses from the Atlantic Ocean are transported to Europe. In the alternate case, the zonal air flow is weak and meridional and blocking weather systems over Central Europe prevail. The interannually varying pres-sure gradient between the Icelandic Low and Azores High is generally known as the North Atlantic Oscillation (NAO). It is linked to the general atmospheric and the oceanic cir-culation systems, the latter being affected by the formation of cold bottom waters in the Arctic ocean and the influx of salty water from the Mediterranean Sea through the Strait of Gibraltar (Bolle, 2003). By definition, a relatively high pressure gradient between the Azores High and the Icelandic Low yields a positive NAO index, a low gradient to a neg-ative NAO index. Although its influence has been studied primarily for the winter season, the NAO is associated with considerable monthly and interannual variability and effects have been identified for all seasons. During August 2001, the mean NAO index was 0.3 (source ftp://ftp.ncep.noaa.gov/ pub/cpc/wd52dg/data/indices/tele index.nh).
In summer the Intertropical Convergence Zone (ITCZ) and the Azores High shift toward higher latitudes. This anticy-clone in combination with eastward moving low pressure systems over Central Europe lead to westerly flow in the lower and middle atmosphere toward the eastern Mediter-ranean area. Spreading of the high pressure across Central Europe diminishes the westerly flow and mostly air from easterly or northerly directions respectively is transported into the Mediterranean region. In the upper troposphere air masses are transported by the upper level westerlies toward the Mediterranean.
During spring and summer the Asian continent begins to heat up, developing a heat low over northern India, Pak-istan and Iran that causes the ITCZ to move north, generating the Indian monsoon, with intense deep convection. A semi-permanent anticyclone is located over the surface heat low, the Tibetan High. The Tropical Easterly Jet (TEJ) stream is an inherent feature of the Indian summer monsoon. It is a belt of strong easterly winds, which is part of the southern periph-ery of the upper tropospheric anticyclone. This TEJ between 200 and 100 hPa transports air from Asia over North-Africa and, aided by the upper tropospheric anticyclone over the Arabian Peninsula, toward the eastern Mediterranean. Under the influence of the subtropical jetstream and the westerlies the air is subsequently transported back east over the Asian continent.
During the summer months the Mediterranean area is di-rectly under the descending branch of the Hadley circulation, which is driven by deep convection in the ITCZ. In the upper troposphere, poleward moving air from the ITCZ is deflected by the Coriolis force. The resulting eastward flow reaches a maximum strength in the subtropical jetstream at about 40◦in summer, north of the Mediterranean. As a result of
M. Traub et al.: Cluster analysis 461
subsidence, the region is characterized by cloud-free condi-tions with high solar radiation intensity. Over land, convec-tion can develop, which is generally not very deep at coastal locations. The air near the surface returns to the equatorial region in the trade winds, gathering moisture over the sea.
In summer teleconnections are found between the Mediterranean region and the South-Asian monsoon and Sahel rainfall regimes on an interannual time-scale (Ward, 1992). The sea level pressure over the eastern Mediter-ranean is anticorrelated with that in the Indian monsoon, mainly in the July-September period, while that in the west-ern Mediterranean is positively correlated with a maximum during September-November. The meridional wind compo-nent is anticorrelated with the Indian monsoon over the cen-tral and eastern Mediterranean basin. This means that a more active monsoon is connected with lower sea level pressure over the eastern basin and higher over the western basin, and stronger northerly wind over most of the Mediterranean.
4 Modeling tools
4.1 Backward trajectories
The trajectories are computed with the FLEXTRA trajectory model (Stohl et al., 1995; Stohl and Seibert, 1998). Stohl and Seibert (1998), studying potential vorticity conservation, have shown that three-dimensional trajectories are more ac-curate than all other types, including isentropic trajectories. Thus three-dimensional trajectories were used throughout this study. In addition to the trajectory positions, FLEXTRA also provides other information, such as potential vorticity (PV), which is interpolated from grid point values. PV is given in PVU (1 PVU = 1 PV unit = 10−6m2s−1K kg−1).
The positions of all parcels are given every 30 min.
As input data, three-dimensional wind fields from the European Centre for Medium-Range Weather Forecasts (ECMWF) analyses are used. For this study a horizontal res-olution of 2.0◦and a nested domain (latitude range: 15◦to
75◦, longitude range: −30◦to 70◦) of 0.5◦were employed.
It has to be mentioned that the computed position of the tra-jectories, especially of those trajectories that have a temporal range of several days, is dependent on the resolution of the wind data. This results from the fact that the wind fields are archived every 6 h and consequently this data has to be interpolated in time and in space. The calculations are sen-sitive to initial conditions in the sense that a trajectory can separate rapidly from another trajectory starting nearby (in time or space). As a consequence, uncertainties in the origin of 5-day back trajectories can add up to several hundreds of kilometers, even using the latest high-resolution global me-teorological analyses (Stohl, 1998).
To determine the source regions of the air masses which were sampled during the MINOS campaign, 5-day
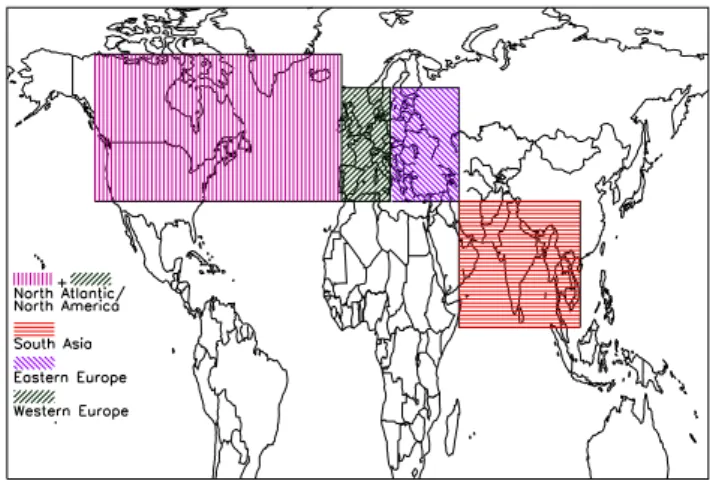
Fig. 2. Source regions of the trajectories during the MINOS
cam-paign.
backward-trajectories were computed. Trajectories were ini-tialized at every minute along the Falcon flight tracks.
We divided the atmosphere into four different height inter-vals: level one from the ground up to 2 km, level two from 2 to 4 km, level 3 from 4 to 8 km and level 4 from 8 to about 14 km. These levels refer to the flight altitude of the Fal-con aircraft during the measurements, i.e., the initialization points of the back trajectories. This implies, for example, that all trajectories with initialization points between 4 and 8 km are attributed to one height level regardless of altitude 5 days earlier.
4.2 Mean trace gas mixing ratios
The temporal resolution of the measurement of the different gases was not unique. To compute mean concentrations for the trajectory clusters, the measured values were converted to one minute averages. Hence the gas concentrations could be assigned to the corresponding trajectories, which also have a temporal resolution of one minute.
5 Source regions
On first inspection of all back trajectories computed for the MINOS campaign period we visually identified four main clusters of trajectories. Therefore we defined each of these clusters to represent a source region. These are: 1) west-ern Europe; 2) eastwest-ern Europe; 3) the North Atlantic region and North America; and 4) South Asia. These regions are depicted in Fig. 2. It should be mentioned that especially for the middle and upper tropospheric trajectories the expression ”source region” is debatable. Often the trace gases in these air parcels do not have their origin in the particular region depending on whether the trace gas life time exceeds that of the trajectory. Some trace gases are moreover chemically formed from precursor gases that are emitted elsewhere. In this study we nevertheless adopted this expression to
Table 1. Approximate lifetime of the sampled trace gases during summer HCHO hours NOx days NOy days to weeks O3 days to weeks
CH3COCH3 weeks to months
PAN weeks to months CO weeks to months CH3OH months CH3CN months
CH4 years
CO2 years
Table 2. Comparison of mean concentrations for height level 1 (0–2
km) for western Europe and eastern Europe trajectories western Europe eastern Europe Mean Std Dev Mean Std Dev
NO 0.04 0.01 0.05 0.02 NOy 1.1 0.5 1.4 0.4 HCHO 0.9 0.2 1.3 0.4 O3 58 5 70 6 CH3OH 1426 411 3169 808 CH3CN 136 25 203 31 CH3COCH3 1953 276 2755 435 PAN 324 99 627 224 CO2 359 3 358 3 CO 126 17 156 23 CH4 1873 21 1883 29
NO, NOy, HCHO, O3, CO, CH4in ppbv, CO2in ppmv,
CH3OH, CH3CN, CH3COCH3, PAN in pptv.
guish the different clusters. For the approximate lifetimes of the sampled trace gases see Table 1.
By definition, if an air parcel trajectory resides over a de-fined region it is added to the particular cluster. Often it ap-pears that the back trajectories reside over two or more de-fined regions. In this case the residence time of the air parcel above the regions is the decisive point. In this study a mini-mum residence time of 2.75 days is used to assign such tra-jectories to their source region. It is thus assumed that during this period the air mass has adopted the chemical characteris-tics of this region. If a trajectory does not fulfil this criterion for any region it is declared as “non-defined” and is not fur-ther considered. As a result, 184 of the 2690 computed back trajectories (6.8%) were disregarded.
5.1 Ground – 2 km
Using the criteria described above we distinguish between air masses from western Europe, notably France, Germany and northern Italy, and from eastern Europe. These two clusters
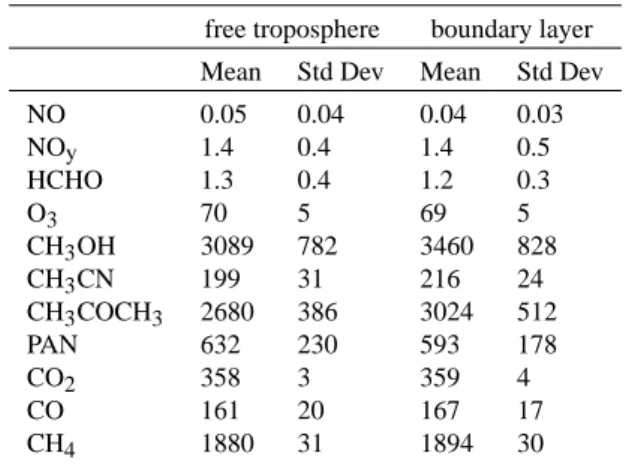
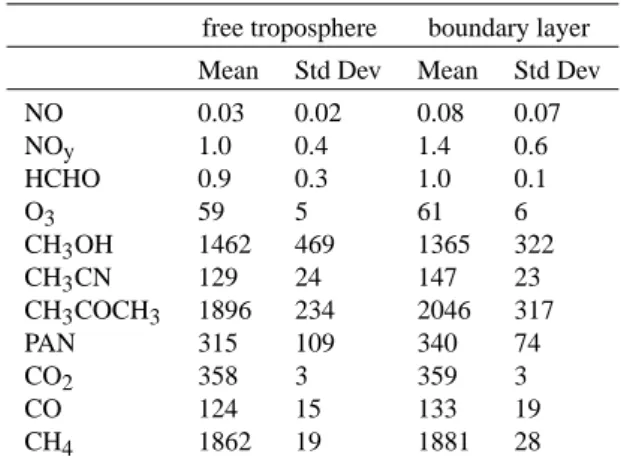
Table 3. Comparison of eastern Europe mean concentrations at
height level 1 (0-2km) of trajectories originating in the free tropo-sphere and in the boundary layer.
free troposphere boundary layer Mean Std Dev Mean Std Dev
NO 0.05 0.04 0.04 0.03 NOy 1.4 0.4 1.4 0.5 HCHO 1.3 0.4 1.2 0.3 O3 70 5 69 5 CH3OH 3089 782 3460 828 CH3CN 199 31 216 24 CH3COCH3 2680 386 3024 512 PAN 632 230 593 178 CO2 358 3 359 4 CO 161 20 167 17 CH4 1880 31 1894 30
NO, NOy, HCHO, O3, CO, CH4in ppbv, CO2in ppmv,
CH3OH, CH3CN, CH3COCH3, PAN in pptv.
are shown in Fig. 3a and 3b. 176 trajectories were counted for the western region. That is about 22% of all trajectories at this height level. 595 trajectories (about 74%) from the eastern area were registered. The remaining 4% was ignored as being ”non-defined”. The mean gas concentrations of the eastern and western Europe trajectories are listed in Table 2. It can be seen that all trajectories with source regions in eastern Europe are associated with higher mean con-centrations than those from westerly directions, except for CO2. In particular the mean value of PAN is nearly twice
as high (627±224 and 324±99 pptv). The values of ace-tone (2755±435 and 1953±276 pptv), acetonitrile (203±31 and 136±25 pptv), especially methanol (3169±808 and 1426±411 pptv) but also O3 (70±6 and 58± 5) and CO
(156±23 and 126±17) are significantly higher in eastern Eu-ropean air.
Fig. 4 depicts the temporal height development of the western European trajectories. Two thirds originate at al-titudes lower than 2 km and mostly do not change altitude much toward the Mediterranean, except a few which are up-lifted by low pressure systems over the Atlantic. The re-maining one third of these trajectories originates in the free troposphere and descends in the following days toward the Mediterranean region. Likewise about one third of the east-ern Europe trajectories originates in the free troposphere (see Fig. 4b). We differentiated trajectories originating on the one hand in the free troposphere and on the other hand in the boundary layer, listing the associated mean concentrations in Table 3 for eastern Europe and Table 4 for western Europe.
Although for both western and eastern Europe the bound-ary layer trajectories are mostly associated with higher con-centrations, the differences are generally small. We hypoth-esize that the lower about 4 km are generally well mixed by
M. Traub et al.: Cluster analysis 463
Table 4. Same as Table 3, but for western Europe trajectories
free troposphere boundary layer Mean Std Dev Mean Std Dev
NO 0.03 0.02 0.08 0.07 NOy 1.0 0.4 1.4 0.6 HCHO 0.9 0.3 1.0 0.1 O3 59 5 61 6 CH3OH 1462 469 1365 322 CH3CN 129 24 147 23 CH3COCH3 1896 234 2046 317 PAN 315 109 340 74 CO2 358 3 359 3 CO 124 15 133 19 CH4 1862 19 1881 28
NO, NOy, HCHO, O3, CO, CH4in ppbv, CO2in ppmv,
CH3OH, CH3CN, CH3COCH3, PAN in pptv.
Table 5. Comparison of western and eastern Europe trajectories at
height level 2 (2–4 km)
western Europe eastern Europe Mean Std Dev Mean Std Dev
NO 0.04 0.03 0.02 0.01 NOy 0.7 0.3 0.9 0.2 HCHO 0.4 0.2 0.7 0.2 O3 73 13 73 8 CH3OH 1614 602 2195 586 CH3CN 176 33 180 26 CH3COCH3 1862 469 2206 433 PAN 537 129 744 149 CO2 361 3 360 4 CO 99 11 112 15 CH4 1837 18 1839 20
NO, NOy, HCHO, O3, CO, CH4in ppbv, CO2in ppmv,
CH3OH, CH3CN, CH3COCH3, PAN in pptv.
shallow convection over southern Europe, as evident from satellite images during MINOS. Many of these small-scale convective events are probably not resolved in the ECMWF analysis used to compute the trajectories.
Acetonitrile can be used as a unique tracer for biomass burning (Holzinger et al., 1999). Accordingly the mean gas concentrations suggest more biomass burning in eastern compared to western Europe during the MINOS campaign. Figure 5 shows a map with the registered nighttime fires in eastern Europe in August, 2001. In western Europe no fires have been registered for this period. Many of the computed trajectories of the eastern Europe cluster moved over the re-gion with a high density of fires north of the Black Sea (see Fig. 3b), explaining the enhanced concentration of biomass burning tracers.
Table 6. Comparison of eastern Europe mean concentrations at
height level 2 (2-4km) of trajectories originating in the free tropo-sphere and in the boundary layer
free troposphere boundary layer Mean Std Dev Mean Std Dev
NO 0.02 0.01 0.02 0.01 NOy 0.9 0.3 0.9 0.2 HCHO 0.7 0.3 0.7 0.1 O3 72 8 75 9 CH3OH 2143 561 2439 694 CH3CN 176 25 198 23 CH3COCH3 2190 432 2284 428 PAN 749 155 718 104 CO2 361 4 360 4 CO 109 12 121 19 CH4 1839 20 1838 21
NO, NOy, HCHO, O3, CO, CH4in ppbv, CO2in ppmv,
CH3OH, CH3CN, CH3COCH3, PAN in pptv.
Table 7. Mean concentrations of the North Atlantic region between
4 and 8 km Mean Std Dev NO 0.03 0.02 NOy 0.6 0.2 HCHO 0.3 0.1 O3 72 12 CH3OH 1014 441 CH3CN 159 26 CH3COCH3 1549 376 PAN 447 146 CO2 366 3 CO 83 11 CH4 1833 21
NO, NOy, HCHO, O3, CO, CH4in ppbv, CO2in ppmv,
CH3OH, CH3CN, CH3COCH3, PAN in pptv.
5.2 2–4 km
The situation for the height interval between 2 and 4 km is very similar to the first level. There are also two main re-gions from where the air was transported toward the Mediter-ranean area, one from westerly and one from easterly direc-tions. From the west 75 trajectories (23%) were counted, from the east 201 (62%). The remaining 15% was associated with other regions. Figures 3c and 3d show the associated 5-day back trajectories. It is notable that the eastern trajec-tories at this height level 5 days previously do not originate as far north as at the height level below. In this case they originate especially over Turkey, Greece, Bulgaria and the Ukraine. Nevertheless the difference in the mean gas
(a) (b)
(c) (d)
(e) (f)
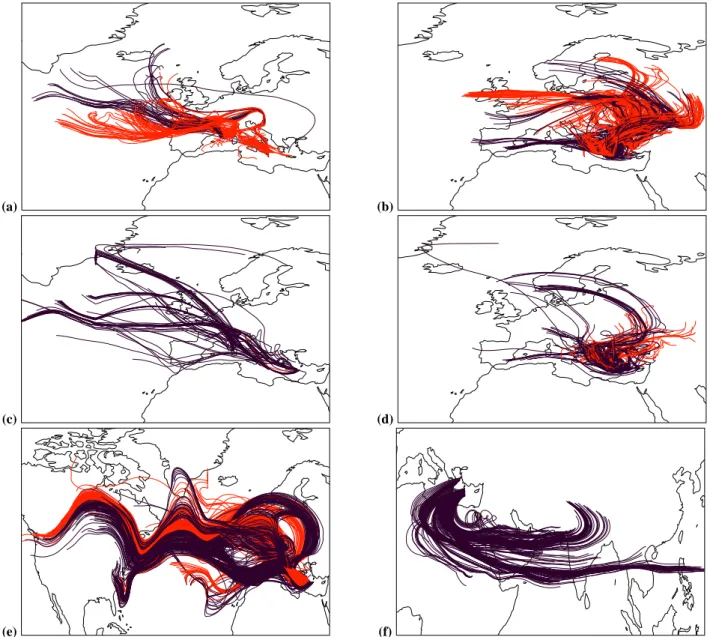
Fig. 3. Clusters of 5-day back trajectories for different height levels. (a) Western Europe trajectories between the ground and 2km, (b)
same height level for eastern Europe trajectories, (c) same as (a) but between 2 and 4km, (d) same as (b) but between 2 and 4km, (e) North Atlantic/North American trajectories between 8 and 14km, (f) same as (e) but for the South Asian cluster. The red marking in (a) to (d) indicates trajectories passing through the planetary boundary layer, in (e) stratospheric trajectories.
trations (see Table 5) of these western and eastern trajectories is qualitatively similar to level 1. Whereas nearly all western Europe trajectories originate in the free troposphere between about 4 and 9 km, at least about 25% of the eastern Europe trajectories originate in the boundary layer (see Fig. 4c and Fig. 4d). The remaining 75% associated with altitudes up to 8 km descend during transport toward the Mediterranean.
Also for this height interval we obtain differences in the mean gas concentrations between western and eastern Eu-rope air masses. Comparable to the height level below the mean gas concentrations of the eastern Europe trajectories are higher, with the exception of CH4(west: 1837±18 ppbv,
east: 1839±20 ppbv), CO2(west: 361±3 ppmv, east: 360±4
ppmv) and O3(west: 73±13 ppbv, east: 73±8 ppbv). Only
the mean NO concentration is higher for the western Europe air masses (west: 0.04±0.03 ppbv, east: 0.02±0.01 ppbv).
As mentioned in the previous section the enhanced mean concentration of the biomass burning tracer acetonitrile, as well as methanol, acetone and CO, can be traced to the large number of fires north of the Black Sea (Holzinger et al., 2003).
In Table 6 the differences of the mean concentrations in the eastern Europe air mass according to their height are shown. Comparable to the level below the lowest layer is most strongly affected by fresh emissions, although the dif-ferences are generally small.
M. Traub et al.: Cluster analysis 465
(a) (b)
(c) (d)
(e) (f)
Fig. 4. Altitude versus time of the 5-day cluster back trajectories. (a) Western Europe trajectories between the ground and 2km, (b) same
height level for eastern Europe trajectories, (c) same as (a) but between 2 and 4km, (d) same as (b) but between 2 and 4km, (e) North Atlantic/North American trajectories between 8 and 14km, (f) same as (e) but for the South Asian cluster.
5.3 4–8 km
A large fraction, i.e. 406 of the total number of 509 com-puted trajectories ending between 4 and 8 km altitude, orig-inates from the North Atlantic/North America region (80%). The remaining 20 % is associated with other source regions. Because the number of trajectories from these regions is very low, we did not compare trace gas concentrations of differ-ent clusters at this height. Nevertheless, in Table 7 the mean concentrations for the trace gas concentrations of the NANA cluster are listed to compare these with the NANA region values of the height interval aloft.
5.4 8–14 km
At this height interval two main directions appear from where the air is transported toward the Mediterranean area. Most of the air originates from the west. For these trajectories (see Fig. 3e), there seems to be a coherent cluster at the west of Africa. By computing these back trajectories for more than 5 days it can be shown that they also have their source region over North America. A separate analysis of the gas concentrations of this cluster moreover shows no significant differences with the rest of the trajectories shown in Fig. 3e. Therefore all these trajectories are treated as one cluster. On
Fig. 5. Fires detected during nighttime for eastern Europe in
Au-gust, 2001. The region defined as eastern Europe is outlined with the inner box. Source: ATSR World Fire Atlas http://shark1.esrin. esa.it/ionia/FIRE/AF/ATSR/.
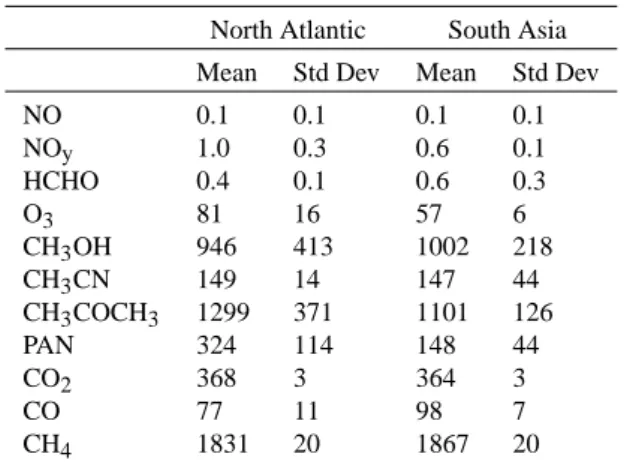
Table 8. Comparison of mean concentrations of North Atlantic
re-gion (NANA) and South Asian trajectories mean concentrations be-tween 8 and 14 km. For the NANA cluster only tropospheric trajec-tories are considered.
North Atlantic South Asia Mean Std Dev Mean Std Dev
NO 0.1 0.1 0.1 0.1 NOy 1.0 0.3 0.6 0.1 HCHO 0.4 0.1 0.6 0.3 O3 81 16 57 6 CH3OH 946 413 1002 218 CH3CN 149 14 147 44 CH3COCH3 1299 371 1101 126 PAN 324 114 148 44 CO2 368 3 364 3 CO 77 11 98 7 CH4 1831 20 1867 20
NO, NOy, HCHO, O3, CO, CH4in ppbv, CO2in ppmv,
CH3OH, CH3CN, CH3COCH3, PAN in pptv.
the other hand, Fig. 3f consistently shows 5-day back trajec-tories originating over South Asia. Consequently these two very different clusters can be analyzed and compared. The number of the NANA trajectories is 645, which is 61% of all trajectories at this height level. For the Asian cluster 271 trajectories were counted (26%). 13% were associated with other source regions.
The North American trajectories mainly start 5 days back at heights above 8 up to 14 km (Fig. 4e), decreasing with alti-tude in time due to subsidence. Only a few trajectories origi-nating in the lower troposphere are apparent. The geographi-cal position of many upper tropospheric trajectories is further north, close to the jet stream, so there may be an enhanced
Fig. 6. Potential vorticity of a subset of the North Atlantic region
trajectories. Some air parcels are temporarily associated with po-tential vorticity values higher than 2 PVU, indicating stratospheric influence.
possibility of mixing with stratospheric air. In Fig. 6 the PV values along a representative selection of all NANA trajec-tories is depicted, showing stratospheric influence along the transport paths and also over the Mediterranean, indicating that some measurements onboard the aircraft took place in the lowermost stratosphere. The Asian trajectories, starting between 9 and 16 km (Fig. 4f), furthermore decrease with al-titude in time associated with subsidence deeper into the tro-posphere especially near North-Africa. The position of these trajectories is more toward the south where the tropopause is relatively high (about 16 km). PV analyses of these trajecto-ries indicates no stratospheric influence (not shown).
For comparison with the Asian air masses we removed all NANA trajectories directly influenced by the stratosphere (about 50%). The mean gas concentrations for these two clusters are listed in Table 8. It appears that the standard deviations of the NANA cluster trace gas concentrations are partly much higher than that for South Asia, notably of ace-tone, methanol and PAN, signifying a much higher variabil-ity of the sources in this region, associated with a much higher geographical spread of the NANA trajectories.
In contrast to the lower height levels, none of these two clusters is clearly characterized by enhanced mean con-centrations of all trace gases. Whereas NOy, O3 and
CH3COCH3 of the NANA sector are higher, the values of
HCHO, CO, methanol and CH4 are higher for the South
Asian cluster. The mean PAN concentration for that clus-ter is low compared with NANA. It has to be emphasized, however, that the number of trajectories associated with PAN concentrations for the Asian cluster is very limited (16). Therefore the comparison of the PAN concentrations is of limited value.
Although the stratospheric trajectories are excluded, the mean NANA ozone concentration is still higher than the Asian value. This may be caused by small-scale mixing
pro-M. Traub et al.: Cluster analysis 467
(a) (b)
(c) (d)
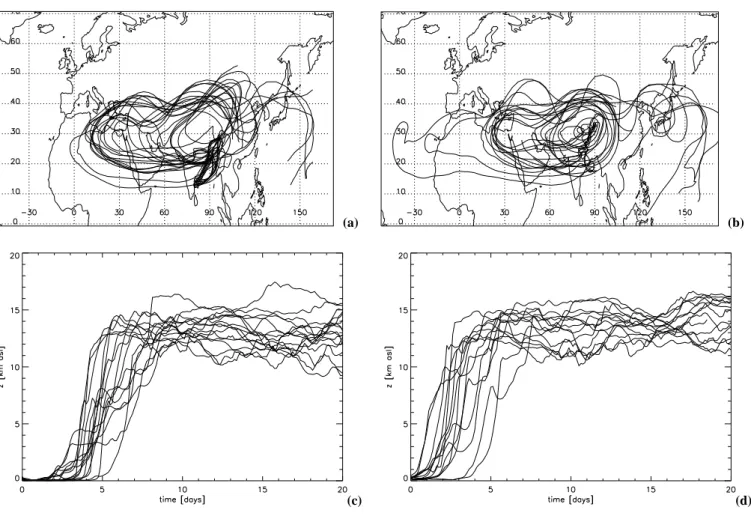
Fig. 7. 20-day forward trajectories from two large Indian cities (a) Madras (80.76E / 13.85N, SE India) and (b) Patna (85.72E / 26.01N, NE
India) in July, 2001. Fig. 7c shows the temporal development of the trajectory height above sea level for the (c) Madras trajectories and (d) for those from Patna.
cesses with stratospheric air near the tropopause, which can-not be accurately simulated with trajectory models, or strong upward transport from the polluted boundary layer previous to the simulated five days.
Mean CO mixing ratios exceeding 80 ppbv in the mid-dle and upper troposphere suggest a direct continental in-fluence (Board et al., 1999). CH4 is also enhanced in the
South Asian cluster, possibly from rice cultivation. There-fore, it is likely that South Asian air pollution is transported within a few days through the Asian monsoon convection to the upper troposphere, after which it follows the upper-level anticyclone toward the eastern Mediterranean. A selection of 20-day forward trajectories, initialized each day in Juli 2001, with starting points in two West Indian cities (Madras, Patna) in Fig. 7 support this assumption. Fig. 7a and 7b clearly show the anticylonic circlulation, while in Fig. 7c and 7d the fast upward transport of the trajectories up to about 15 km in the monsoon convection is depicted. The duration of transport from the Indian cities to the upper troposphere over the east-ern Mediterranean is about 10 - 15 days. Even if the un-certainties in the origin of 20-day back-trajectories can add
up to several hundreds of kilometers, these trajectories seem to be representative of transport from Indian boundary layer air. Once being transported by the strong monsoon convec-tion into the upper troposphere (2 - 7 days), the Tibetan High transports the air toward the Mediterranean area.
6 Conclusions
We have analyzed back trajectories for the MINOS campaign in August 2001 combined with measured trace gas concen-trations. The goal was to find a relationship between the ori-gin of trajectories and the observed concentration at the time of their arrival. Other articles in the present special issue of MINOS will discuss the details of trace gas sources and their chemical influences.
As determined by the large-scale atmospheric circulation, we identified ”typical” flow patterns at different height levels. Between the surface and 2 km altitude we infer strong influ-ences from western and eastern Europe. The same applies to the height level of 2 to 4 km. About 74% of the computed
trajectories at the lowest level was associated with the east-ern European cluster, whereas 22% was westeast-ern European. The remaining 4% was ignored as being “non-defined”. At the height of 2 to 4 km these values changed to about 62%, 23% and 15%, respectively. Whereas the air between 4 and 8 km mainly originated from the North Atlantic region (80%), there was an additional strong influence above 8 km from South Asia. At this level about 61% of the trajectories came from the west, and 26% from South Asia. The remaining 13% was associated with other source regions.
In spite that the definition of the ”source regions” is some-what subjective and therefore open to discussion, substantial differences in the mean gas concentrations between the dif-ferent clusters and hence source regions are evident.
This is especially true for the lowest two height levels. The trace gas concentrations with the eastern European 5-day back trajectories were significantly higher than with the western European trajectories, signifying a higher level of air pollution. By differentiating between trajectories originating on the one hand in the boundary layer and on the other hand in the lower free troposphere, the differences in the mean gas concentrations are generally small, which can be explained by mixing in shallow convection over southern Europe.
Generally speaking the concentrations of the trace gases at the highest level (between 8 and 14 km), originating from the NANA region and from South Asia, do not differ as much as at the levels below, indicating a relatively higher level of uniformity in upper tropospheric air pollution in the northern hemisphere. Nevertheless these air masses did show typical chemical characteristics. Air from the NANA source region seems to be directly influenced by the stratosphere, whereas air from South Asia, on the other hand, did not show these influences. Since CO and CH4 were enhanced in these air
masses, we infer relatively rapid transport from the surface by strong convection in the Indian monsoon.
References
Belman, S.: The fluorimetric determination of formaldehyde, Ana-lytica Chimica Acta, 29, 120–126, 1963.
Board, A., Fuelberg, H., Gregory, G., Heikes, B., Schultz, M., Blake, D., Dibb, J., Sandholm, S., and Talbot, R.: Chemical char-acteristics of air from different source regions during the Pacific Exploratory Mission-Tropics A (PEM-Tropics A), J. Geophys. Res., 104, 16 181–16 196, 1999.
Bolle, H.-J.: Mediterranean Climate, Climate, Climate Variablitity and Impacts in the Mediterranean Area: An Overview, Springer-Verlag, Berlin, 2003.
Holzinger, R., Warneke, C., Jordanm, A., Hansel, A., Lindinger, W., Scharffe, D., Schade, G., and Crutzen, P.: Biomass burning as a source of Formaldehyde, Acetaldehyde, Methanol, Acetone, Acetonitrile, and Hydrogen Cyanide, Geophys. Res. Lett., 26, 1161, 1999.
Holzinger, R., Salisbury, G., Williams, J., Kl¨upfel, T., de Reus, M., Traub, M., Crutzen, P.J. and Lelieveld, J.: Acetonitrile over the Eastern Mediterranean and its use for assessing the biomass
burning contribution to the tropospheric burdens of CO, acetone, methanol and PAN, Atmos. Chem. Phys. Discuss., submitted. Kormann, R., Fischer, H., de Reus, M., Lawrence, M., Br¨uhl, Ch.,
von Kuhlmann, R., Holzinger, R., Williams, J., Lelieveld, J., Warneke, C., de Gouw, J., Heland, J., Ziereis, H. and Schlager, H.: Formaldehyde over the eastern Mediterranean during MI-NOS: Comparison of airborne in-situ measurements with 3D-model results, Atmos. Chem. Phys. Discuss., 3, 1303–1331, 2003
Kouvarakis, K., Tsigaridis, K., Kanakidou, M., and Mihalopoulos, N.: Temporal variations of surface regional background ozone over Crete Island in the southeast Mediterranean, J. Geophys. Res., 105, 4399–4407, 2000.
Lelieveld, J., Berresheim, H., Borrmann, S., Crutzen, P., Dentener, F., Fischer, H., Feichter, J., Flatau, P., Heland, J., Holzinger, R., Korrmann, R., Lawrence, M., Levin, Z., Markowicz, K., Mihalopoulos, N., Minikin, A., Ramanathan, V., de Reus, M., Roelofs, G., Scheeren, H., Sciare, J., Schlager, H., Schultz, M., Siegmund, P., Steil, B., Stephanou, E., Stier, P., Traub, M., Warneke, C., Williams, J., and Ziereis, H.: Global air pollution crossroads over the Mediterranean, Science, 298, 794–799, 2002. Lindinger, W., Hansel, A., and Jordan, A.: On-line monitoring of volatile organic compounds at pptv levels by means of Proton-Transfer-Reaction Mass Spectrometry (PTR-MS) medical appli-cations, food control and environmental research, Int. J. Mass Spectrom. Ion Processes, 173, 1998.
Moody, J., Oltmans, S., Levy II, H., and Mertill, J.: Transport cli-matology of tropospheric ozone: Bermuda, 1988-1991, J. Geo-phys. Res., 100, 7179–7191, 1995.
Pochanart, P., Akimoto, H., Maksyutov, S., and Staehelin, J.: Sur-face ozone at the Swiss Alpine site Arosa: The hemispheric back-ground and the influence of large-scale anthropogenic emissions, Atmos. Environ., 35, 5553–5566, 2001.
Schlager, H., Konopka, P., Schulte, P., Schumann, U., Ziereis, H., Arnold, F., Klemm, M., Hagen, D., Whitefield, P., and Ovarlez, J.: In situ observations of air traffic emission signatures in the North Atlantic flight corridor, J. Geophys. Res., 102, 10 779– 10 750, 1997.
Stohl, A.: Computation, Accuracy and Applications of Trajectories – A Review and Bibliography, Atmos. Environ., 32, 947–996, 1998.
Stohl, A. and Seibert, P.: Accuracy of trajectories as determined from the conservation of meteorological tracers, Q. J. R. Met. Soc., 125, 1465–1485, 1998.
Stohl, A., Wotawa, G., Seibert, P., and Kromp-Kolb, H.: Interpo-lation errors in wind fields as a function of spatial and temporal resolution and their impact on different types of kinematic tra-jectories, J. Ap. Me., 34, 2149–2165, 1995.
Ward, M.: Provisionally corrected surface wind data, worldwide ocean-atmosphere surface fields and Sahelian rainfall variability, J. Climate, 5, 454–475, 1992.
Wienhold, F., Fischer, H., Hoor, P., Wagner, V., K¨onigstedt, R., Har-ris, G., Anders, J., Grisar, R., Knothe, M., Riedel, W., L¨ubken, F., and Schilling, T.: Tristar – a tracer in situ TDLAS for atmo-spheric research, Appl. Phys. B., 67, 411–417, 1998.
Ziereis, H., Schlager, H., Schulte, P., van Velthoven, P., and Slemr, F.: Distributions of NO, NOx, and NOy in the upper troposphere and lower stratosphere between 28 and 61◦N during POLINAT 2, J. Geophys. Res., 105, 3653–3664, 2000.