HAL Id: hal-02169384
https://hal.archives-ouvertes.fr/hal-02169384
Submitted on 25 Aug 2020
HAL is a multi-disciplinary open access
archive for the deposit and dissemination of
sci-entific research documents, whether they are
pub-lished or not. The documents may come from
teaching and research institutions in France or
abroad, or from public or private research centers.
L’archive ouverte pluridisciplinaire HAL, est
destinée au dépôt et à la diffusion de documents
scientifiques de niveau recherche, publiés ou non,
émanant des établissements d’enseignement et de
recherche français ou étrangers, des laboratoires
publics ou privés.
To cite this version:
Emanuele Organelli, Marie Barbieux, Hervé Claustre, Catherine Schmechtig, Antoine Poteau, et
al.. Two databases derived from BGC-Argo float measurements for marine biogeochemical and
bio-optical applications. Earth System Science Data, Copernicus Publications, 2017, 9 (2), pp.861-880.
�10.5194/essd-9-861-2017�. �hal-02169384�
measurements for marine biogeochemical and
bio-optical applications
Emanuele Organelli1,2, Marie Barbieux1, Hervé Claustre1, Catherine Schmechtig3, Antoine Poteau1, Annick Bricaud1, Emmanuel Boss4, Nathan Briggs1, Giorgio Dall’Olmo2,5, Fabrizio D’Ortenzio1, Edouard Leymarie1, Antoine Mangin6, Grigor Obolensky7, Christophe Penkerc’h1, Louis Prieur1,
Collin Roesler8, Romain Serra6, Julia Uitz1, and Xiaogang Xing9
1Sorbonne Universités, UPMC Univ Paris 06, CNRS, UMR 7093, Laboratoire d’Océanographie de Villefranche (LOV), 181 Chemin du Lazaret, 06230 Villefranche-sur-mer, France
2Plymouth Marine Laboratory, PL1 3DH Plymouth, UK
3Sorbonne Universités, UPMC Université Paris 06, CNRS, UMS 3455, OSU Ecce-Terra, Paris, France 4School of Marine Sciences, University of Maine, Orono, Maine, USA
5National Centre for Earth Observation, Plymouth Marine Laboratory, PL1 3DH Plymouth, UK 6ACRI-ST, 260 route du Pin Montard, 06904 Sophia-Antipolis, France
7ERIC Euro-Argo, 29280 Plouzané, France
8Department of Earth and Oceanographic Science, Bowdoin College, Brunswick, Maine, USA 9State Key Laboratory of Satellite Ocean Environment Dynamics, Second Institute of Oceanography,
State Oceanic Administration, Hangzhou, 310012, China Correspondence to:Emanuele Organelli ([email protected])
Received: 18 June 2017 – Discussion started: 13 July 2017
Revised: 5 October 2017 – Accepted: 10 October 2017 – Published: 22 November 2017
Abstract. Since 2012, an array of 105 Biogeochemical-Argo (BGC-Argo) floats has been deployed across the world’s oceans to assist in filling observational gaps that are required for characterizing open-ocean environ-ments. Profiles of biogeochemical (chlorophyll and dissolved organic matter) and optical (single-wavelength particulate optical backscattering, downward irradiance at three wavelengths, and photosynthetically available radiation) variables are collected in the upper 1000 m every 1 to 10 days. The database of 9837 vertical profiles collected up to January 2016 is presented and its spatial and temporal coverage is discussed. Each variable is quality controlled with specifically developed procedures and its time series is quality-assessed to identify issues related to biofouling and/or instrument drift. A second database of 5748 profile-derived products within the first optical depth (i.e., the layer of interest for satellite remote sensing) is also presented and its spatiotemporal distri-bution discussed. This database, devoted to field and remote ocean color applications, includes diffuse attenuation coefficients for downward irradiance at three narrow wavebands and one broad waveband (photosynthetically available radiation), calibrated chlorophyll and fluorescent dissolved organic matter concentrations, and single-wavelength particulate optical backscattering. To demonstrate the applicability of these databases, data within the first optical depth are compared with previously established bio-optical models and used to validate remotely derived bio-optical products. The quality-controlled databases are publicly available from the SEANOE (SEA scieNtific Open data Edition) publisher at https://doi.org/10.17882/49388 and https://doi.org/10.17882/47142 for vertical profiles and products within the first optical depth, respectively.
the implementation of autonomous platforms, such as the Biogeochemical-Argo profiling floats (hereafter BGC-Argo floats), as one solution to fill this observational gap (Johnson et al., 2009; Claustre et al., 2010a). Unlike sampling from vessels, BGC-Argo floats operate with high temporal and spatial coverage, including remote areas and periods when ship-based sampling is difficult. BGC-Argo can therefore help the scientific community to accumulate observations on biogeochemical properties from the surface to the interior of the ocean in a new and systematic way (Claustre et al., 2010a; Biogeochemical-Argo Planning Group, 2016; Johnson and Claustre, 2016). This, together with several other recent ef-forts to compile global biologically or biogeochemically rel-evant datasets (Peloquin et al., 2013; Sauzède et al., 2015; Bakker et al., 2016; Mouw et al., 2016; Valente et al., 2016), may provide new insights on marine ecological and biogeo-chemical processes and help better understand if oceans and their properties have changed and/or are changing over the decades (Organelli et al., 2017).
In 2012, an array of BGC-Argo floats started to be de-ployed in several oceanic areas encompassing a wide range of biogeochemical and trophic conditions, from subpolar to tropical and from eutrophic systems to oligotrophic mid-ocean gyres (Organelli et al., 2016a, 2017). This array of floats was devoted to the acquisition of profiles of key biogeochemical quantities via their optical properties (i.e., chlorophyll a and colored dissolved organic matter, CDOM) and of hydrological variables (i.e., temperature and salinity). In addition, the array provided measurements of the under-water light field (i.e., irradiance) and of the inherent opti-cal properties (i.e., particulate optiopti-cal beam attenuation and backscattering coefficients) of the oceans. All these mea-surements, and derived quantities, are useful for both bio-geochemical and bio-optical studies, to address the variabil-ity in biological processes (e.g., phytoplankton phenology and primary production; Lacour et al., 2015) and linkages with physical drivers (Boss et al., 2008; Boss and Behren-feld, 2010; Lacour et al., 2017; Mignot et al., 2017; Stanev et al., 2017), to estimate particulate organic carbon concen-trations and export (e.g., Bishop et al., 2002; Dall’Olmo and Mork, 2014; Poteau et al., 2017), and to support satel-lite missions through validation of bio-optical products re-trieved from ocean color remote sensing (e.g., chlorophyll concentration; Claustre et al., 2010b; IOCCG, 2011, 2015; Gerbi et al., 2016; Haëntjens et al., 2017) or by identification
phyll a (Chl, mg m−3) and fluorescent dissolved organic matter (FDOM, ppb of quinine sulfate) concentrations, the particulate optical backscattering coefficient at 700 nm (bbp(700), m−1), downward irradiance Ed(λ) at three wave-lengths (380, 412, and 490 nm, µW cm−2nm−1), and the spectrally integrated photosynthetically available radiation (PAR, µmol quanta m−2s−1). Temperature (T ,◦C) and salin-ity (S, PSU) provide the hydrographic context for the op-tical observations. The geographic and temporal distribu-tion of each parameter is described and discussed. A second database is specifically devoted to field and remote ocean color applications (Organelli et al., 2016b). It is focused on observations and derived products within the first opti-cal depth Zpd (also known as the penetration depth, i.e., the layer of interest for satellite remote sensing; Gordon and Mc-Cluney, 1975; units of m) and includes the “Biogeochemical and OPtical Argo Database – surface” (BOPAD-surf) Chl, FDOM, and bbp(700) quantities derived from the quality-controlled vertical profiles in addition to the diffuse atten-uation coefficients for downward irradiance (Kd(λ), m−1) and PAR (Kd(PAR), m−1). Data presented in BOPAD-surf are compared with existing bio-optical models and used in conjunction with products derived from satellite platforms in order to show applicability for validating ocean color bio-optical products. Finally, sources of uncertainties are pre-sented, and errors discussed, for variables in BOPAD-prof and profile-derived products within BOPAD-surf.
2 Material and methods
2.1 Biogeochemical-Argo floats: instruments, sampling strategy, and data
The PROVOR CTS4 profiling float used in this study is one of the latest models of autonomous platforms devel-oped by NKE Marine Electronics Inc. (France). Designed in the context of the Remotely-Sensed Biogeochemical Cy-cles in the Ocean (remOcean) and Novel Argo Ocean Ob-serving System (NAOS) projects, this profiling float has also been adopted by several international collaborators and re-search programs. A full technical description of the platform and instrument arrangements can be found in Leymarie et al. (2013) and Organelli et al. (2016a).
All PROVOR CTS4 profiling floats were programmed to acquire 0–1000 m vertical profiles every 1 to 10 days while
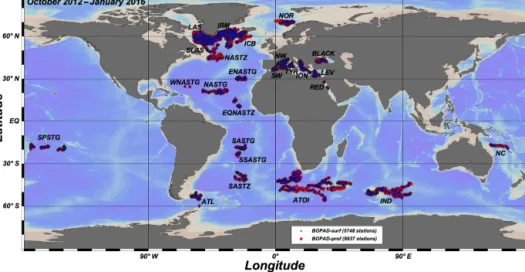
variables over a broad range of oceanic environments and trophic conditions between October 2012 and January 2016. A WET Labs ECO (Environmental Characterization Optics) sensor installed on each BGC-Argo float provided 0–1000 m vertical profiles of chlorophyll (fluorometer with excitation and emission of 470 and 695 nm) and dissolved organic mat-ter (fluoromemat-ter with excitation and emission of 370 and 460 nm) fluorescence and of the volume scattering coeffi-cient (β(θ , λ)) measured at an angle of 124◦ and a wave-length λ of 700 nm (Sullivan et al., 2013; Schmechtig et al., 2016). The multispectral ocean color radiometer OCR-504 (Satlantic Inc.) provided vertical profiles of PAR and down-ward irradiance Ed(λ) at three wavelengths (380, 412, and 490 nm) in the upper 250 m. Electronic counts of each mea-sured variable were converted into geophysical quantities us-ing the calibration factors and standard practices provided by the manufacturers (Satlantic, 2013; WET Labs, 2016). Ac-cording to the standard procedures for Argo data manage-ment (Wong et al., 2015), each profile was quality-controlled by applying methods specifically developed for each param-eter (see Sect. 2.2). Because sensor performance might de-grade over the float lifetime, each float was evaluated for possible corruption by biofouling or instrument drift (see Sect. 2.3). A total of 9837 BGC-Argo stations, each one corresponding to an upward profile, composed the database BOPAD-prof presented in this study (Fig. 1). To discuss the geographic and temporal representativeness of the database, the 9837 quality-controlled stations were grouped into 25 ge-ographic areas. BGC-Argo float names, number of profiles, lifetime, and additional details are presented in Appendix A.
2.2 Quality control of vertical profiles
Vertical profiles of Chl concentration were quality-controlled following procedures and recommendations in Schmechtig et al. (2014). Profiles were (1) adjusted for nonzero deep values and (2) corrected by removing negative spikes lower than twice the 10th quantiles of the residual signal calculated as the difference between the profile values and a median filter (five-point window). No interpolation of missing data was performed. Positive spikes were retained; (3) measured values outside the specific range reported in the manufac-turer’s technical specifications were removed (WET Labs, 2016). No interpolation of missing data was performed and (4) profiles were corrected for non-photochemical
quench-tively correlated below the depth at which Chl was supposed to be zero (for equations and quantitative metrics see Xing et al., 2017). The magnitude of this correction within the mixed layer varied between 3 and 50 % (for details see Table 2 in Xing et al., 2017, for the same database). Finally, according to the recommendations by Roesler et al. (2017) on the over-estimation by standard WET Labs fluorometers, remaining Chl values were divided by a factor of 2 to correct for the global bias in factory calibration.
The FDOM vertical profiles were quality-controlled ac-cording to the following procedures: (1) measured values outside the specific range reported in the manufacturer’s technical specifications were removed (WET Labs, 2016). No interpolation of missing data was performed; (2) negative and positive spikes outside the 25th and 75th quantiles of the raw profile were removed, and subsequently any measure-ment with an absolute residual value > 4 calculated as the difference between the profile and a mean filter was removed. Finally, according to the assumption that deep CDOM con-centrations are conservative in a given water body (Nelson et al., 2010), and assuming that the BGC-Argo floats included in this database spent their lifetime mainly within the same deep water mass, an offset was applied to each FDOM pro-file to align the median value between 950 and 1000 m with the first profile and correct for possible sensor drift.
Following procedures described in Schmechtig et al. (2016), vertical profiles of the angular scattering coef-ficient β(124◦, 700) were (1) converted into the particulate angular scattering coefficient by removing the contribution of pure seawater, which depends on water temperature and salinity (Zhang et al., 2009); (2) converted to the particulate optical backscattering coefficient at 700 nm (bbp(700)) using a χ factor equal to 1.076 (Sullivan et al., 2013); and (3) veri-fied for measured values outside the specific range reported in the manufacturer’s technical specifications (WET Labs, 2016). No interpolation of removed data was performed; (4) the profiles were corrected by removing negative spikes lower than twice the 10th quantiles of the residual signal calculated as the difference between the profile and a median filter (Briggs et al., 2011). No interpolation of missing data was performed. Positive spikes were retained.
Vertical profiles of PAR and Ed(λ) were quality controlled following the procedures detailed in Organelli et al. (2016a). This protocol accepts measurements acquired both under clear and cloudy sky conditions as good as soon as these
re-Figure 1.Red diamonds indicate the 9837 stations collected by 105 Biogeochemical-Argo floats in the period of October 2012–January 2016 that compose the database of vertical profiles (BOPAD-prof). Blue dots indicate the 5748 stations used to assemble the database within the first optical depth and devoted to bio-optical applications (BOPAD-surf). Abbreviations for the 25 geographic regions used to group the stations are also displayed (see Appendix A for full description). The map was drawn using the Ocean Data View software (R. Schlitzer, Ocean Data View, http://odv.awi.de).
main stable during the cast (Organelli et al., 2016a). A first step of the quality control consisted of identifying and dis-carding each profile acquired under very unstable sky and sea conditions (see quantitative metrics in Organelli et al., 2016a). The remaining profiles were quality controlled to identify and remove (1) nonzero dark measurements at depth, (2) sporadic atmospheric clouds, and (3) wave focusing (Zan-eveld et al., 2001) in the upper part of the profile. Because Ed(λ) and PAR measurements are collected up to a few cen-timeters from the sea surface, quality-controlled vertical pro-files were completed by values just below it (Ed(0−)). The Ed(0−) values were calculated by extrapolation within the first optical depth (Zpd) using a second-degree polynomial fit (Organelli et al., 2016a), with Zpd calculated as Zeu/4.6 (Morel, 1988). The euphotic depth, Zeu, is the depth at which PAR is reduced to 1 % of its value just below the surface and was calculated from measured PAR profiles. To achieve Ed(0−) calculations, initial values of Zeuand Zpdwere first estimated from the shallowest PAR measurement and sub-sequently from that corresponding to 0−. For radiometric data prior to the application of the above-mentioned quality-control procedures, the reader is referred to the archive at https://doi.org/10.17882/42182 (Argo, 2000).
2.3 Testing for biofouling and instrument drift
A set of four tests was specifically developed to identify po-tential biofouling and instrument drift. To achieve a reliable evaluation for each of the 105 BGC-Argo floats, each vari-able was examined both individually and in conjunction with the others, which is greatly aided by redundancy among de-rived quantities. A combination of raw profiles and
quality-controlled products was needed for the analysis. Ancillary data such as measurements acquired in drift mode at 1000 m (i.e., between two following ascent profiles) were also in-cluded in the analysis and they can be publicly accessed at http://www.oao.obs-vlfr.fr/maps/en/. Test 1 was conducted on raw time series of salinity, Chl, FDOM, bbp(700), and Ed(λ), i.e, before the application of the quality-control pro-cedures described in Sect. 2.2. Test 1 aimed to identify sharp gradients in measured variables over the entire profile (i.e., sudden decrease or increase of Chl and FDOM concentra-tions or increase in bbp(700) values) not attributable to any biological or hydrological cause (e.g., particle aggregates or nepheloid layer of particles). Tests 2 and 3 were con-ducted on raw measurements collected by each profiler when in drift mode. Test 2 analyzed time series of the sensors’ dark measurements for Chl and Ed(λ) at the 1000 m park-ing depth. Test 3 consisted of the analysis of the relation-ship between raw FDOM and salinity at the 1000 m park-ing depth over time. Assumpark-ing that deep CDOM concentra-tions are conservative in the same water body (Nelson et al., 2010), variations in deep FDOM values for a given salinity are likely due to changes in sensor performances (Fig. 2). Test 4 was based on the comparison between irradiance val-ues just above the sea surface (Ed(0+)) and those modeled by Gregg and Carder (1990) for clear cloudless sky, as described by Organelli et al. (2016a). The performance of this test, which assesses the accuracy of measured irradiance values, strongly depends on the value extrapolated to the sea surface (i.e., Ed(0−)). Ed(0+) values at 380, 412, and 490 nm were obtained by dividing Ed(0−) derived from quality-controlled profiles as described in Sect. 2.2 by the transmission across the sea–air interface factor (Austin, 1974). When the results
Figure 2.Salinity (PSU) vs. FDOM (ppb of quinine sulfate) data collected during drift at the 1000 m parking depth for two Biogeochemical-Argo floats: (a) float WMO 6901768 (eastern Mediterranean Sea) showing no FDOM changes for a similar salinity (7 months of sampling) and (b) float WMO 6901474 (North Atlantic subtropical gyre) showing a decrease in FDOM for a similar salinity (more than 24 months of sampling). In plot (b), FDOM values around 2.5 ppb of quinine sulfate represent measurements collected during the first 2 years of the float lifetime and which have not been discarded. Colors indicate density of measurements for a given salinity vs. the FDOM value (red > blue).
of the tests above indicated possible measurement issues (i.e., 1710 profiles spanned across 70 floats), each preprocessing variable time series was interrupted and only previously col-lected profiles were retained (i.e., 9837 stations in BOPAD-prof).
2.4 Bio-optical products within the first optical depth
BOPAD-surf was compiled using 5748 stations with quality-controlled Zeuand Zpdvalues (Fig. 1). The procedure of Or-ganelli et al. (2016a) reduced the number of PAR profiles that can be exploited for deriving optical quantities within the first optical depth (see Sect. 2.2 for computation) by about 40 % (e.g., because of atmospheric clouds) with re-spect to BOPAD-prof. To compute vertical diffuse attenua-tion coefficients for downward irradiance (Kd(λ)) and PAR (Kd(PAR)) within Zpd, each radiometric profile was binned in 1 m intervals. Kd(λ) and Kd(PAR) values were then de-rived from a linear fit, after removal of outliers, between the natural logarithm of the radiometric quantity and depth (in units of pressure) following Mueller et al. (2003). Kd(λ) and Kd(PAR) values obtained from linear fits based on less than three points or with a determination coefficient (r2) lower than 0.90 were discarded (Organelli et al., 2017). Val-ues of Chl, FDOM, and bbp(700) were also derived, within the first optical depth, from quality-controlled vertical pro-files. Before computation, FDOM quality-controlled profiles were smoothed by applying first a median filter (five-point window) and then an average filter (seven-point window). A median filter (five-point window) was applied to quality-controlled bbp(700) profiles to identify and subsequently re-move positive spikes. Finally, Chl, FDOM, and bbp(700) pro-files were binned in 1 m intervals, and the average within Zpd was computed.
2.5 Comparison with satellite data
To demonstrate the applicability of these BGC-Argo databases, satellite-derived diffuse attenuation coefficients of downward irradiance at 490 nm (Kd(490)sat) obtained by the GlobColour project (ACRI-ST, 2017) were downloaded from the web portal http://seasiderendezvous.fr/matchup.php and compared to the in situ BGC-Argo counterparts. Kd(490)sat values were obtained, for the period October 2012 to Jan-uary 2016, from daily Level 3 Chl merged products using the empirical algorithm by Morel et al. (2007a). Chl prod-ucts were merged using MODIS-Aqua and VIIRS Level 3 products (NASA reprocessing R2014.0); see fully detailed merging procedures in ACRI-ST (2017). As statistics of the match-up analysis, the RMSE (m−1) and the median percent-age difference (MPD) were calculated according to Organelli et al. (2016c).
3 Quality-controlled vertical profiles
In this section, specific examples of quality control are pre-sented for each examined variable to provide context for the database. In the case of Chl profiles, three examples extracted from floats operating in different trophic and optical envi-ronments are presented (North Atlantic subpolar gyre, Black Sea, and South Atlantic subtropical gyre; Fig. 3). It is re-called here that all quality-controlled Chl values are divided by 2 as recommended by Roesler et al. (2017). The raw North Atlantic profile (Fig. 3a) exhibits strong non-photochemical quenching at the surface and positive spikes at depth. Af-ter the quality control, NPQ is corrected and the positive spikes that are likely related to biological information are re-tained (Fig. 3a). The Black Sea vertical chlorophyll profile (Fig. 3b) is mainly characterized by a monotonic Chl increase to depth, where the concentration is expected to be null. As Proctor and Roesler (2010) and Xing et al. (2017) stated, the
Figure 3. Raw and quality-controlled vertical profiles of chloro-phyll a concentration (Chl) for the following areas: (a) the North Atlantic subpolar gyre (float WMO 6901516), (b) the Black Sea (float WMO 7900591), and (c) the South Atlantic subtropical gyre (float WMO 6901439).
observed Chl increase at depth is due to very high CDOM (which is a consequence of the anoxic conditions prevailing at depth in the Black Sea) and non-algal matter concentra-tions that can affect the chlorophyll fluorescence signal. Af-ter correcting the profile according to Xing et al. (2017), Chl concentrations below 100 m are zero. The profile from the South Atlantic subtropical gyre mostly exhibits a nonzero dark offset, which is removed in quality control (Fig. 3c).
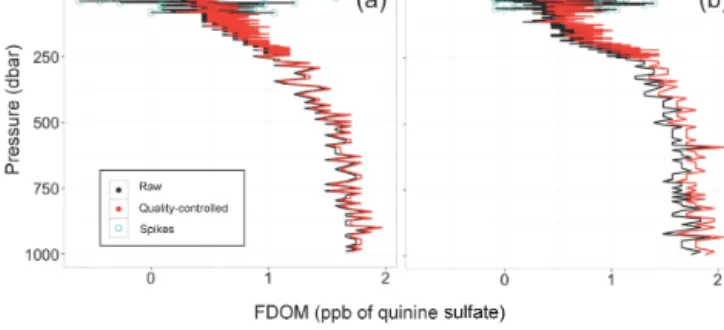
Raw FDOM vertical profiles are generally noisy and spiky, especially in the upper water column (Fig. 4). After qual-ity control, large spikes are identified and removed, and the profile is aligned to match the 950–1000 m median value of the first profile acquired by the float (Fig. 4). Depending on the application, further processing of FDOM profiles such as smoothing and filtering is recommended before use (see, for example, Sect. 2.4).
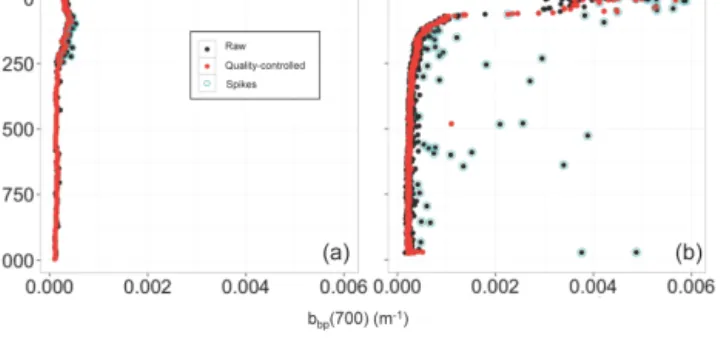
In the case of bbp(700) vertical profiles, the examples in Fig. 5 represent quality-controlled profiles with and with-out positive spikes (see Sect. 2.4). Although positive spikes likely indicate the occurrence of large aggregates and are es-sential to monitoring carbon fluxes towards the deep ocean (Briggs et al., 2011), they can introduce some noise when export of particulate organic carbon due to small particles (Dall’Olmo and Mork, 2014), the physiological status of the algal community (Barbieux et al., 2017b), or the bio-optical behavior of world’s oceans (Organelli et al., 2017) is an-alyzed. Both versions of bbp(700) profiles are archived in BOPAD-prof.
All the quality-controlled profiles of Ed(λ) and PAR in-cluded in the database presented correspond to Type 1 (i.e., best quality) in Organelli et al. (2016a). The exam-ples in Fig. 6 represent Ed(412) profiles collected in east-ern Mediterranean Sea waters under different sky conditions. The profile in Fig. 6a is acquired under nearly clear sky conditions. In this case, the quality-control procedure only
Figure 4.(a, b) Raw and quality-controlled vertical profiles of flu-orescent dissolved organic matter (FDOM, ppb of quinine sulfate) collected by the profiling float WMO 6901440 in the South Atlantic subtropical gyre. Open cyan circles indicate positive spikes for the raw profile. Both profiles were acquired within 1 week from the deployment.
identifies and removes dark values at depth (not shown) and those corresponding to wave focusing (Zaneveld et al., 2001) at the surface. The profile in Fig. 6b is instead character-ized by nonzero dark values in deep waters (not shown) and sporadic atmospheric clouds, with the major cloud per-turbing data acquisition for at least 2 min. The ensemble of tests of the applied quality-control procedure (Organelli et al., 2016a) detects the various perturbations (Fig. 6b). Addi-tional examples showing performances of applied procedure for Ed(380), Ed(412), Ed(490), and PAR can be found in Or-ganelli et al. (2016a).
4 BOPAD-prof: spatiotemporal distribution of the biogeochemical and optical Argo database of vertical profiles
Deployment of BGC-Argo floats has been mainly focused, within limitations of project-driven resources, on some of the important carbon-export regions of the Atlantic Ocean (Alkire et al., 2012), on areas with dynamic trophic regimes (e.g., Mediterranean Sea; D’Ortenzio and Ribera d’Alcalà, 2009), and on oligotrophic mid-ocean gyres, in all cases in regions with depths greater than 1000 m (except on a very few occasions). As a result, the 9837 BGC-Argo stations of vertical profiles within BOPAD-prof cover a wide range of trophic conditions and represent the first step to set up a pub-licly available and interoperable database for biogeochemical and bio-optical studies. Hereafter, we present the spatial and temporal coverage of quality-controlled vertical profiles for each biogeochemical and bio-optical variable between the world’s hemispheres and among regions. The spatiotemporal distribution of temperature profiles, which are representative of the entire raw database, is also shown.
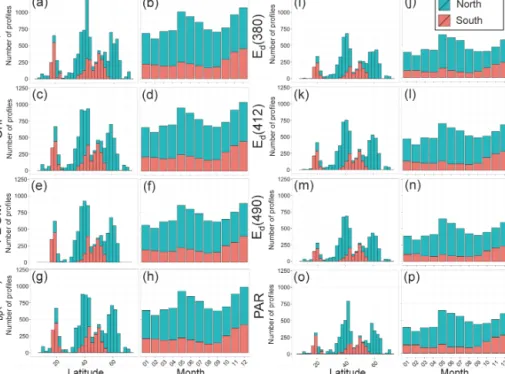
The latitudinal and monthly distributions of the quality-controlled profiles show similar patterns among the eight variables (Fig. 7), which indicates that the quality-control
Figure 5. (a, b) Raw (i.e., before positive spike removal) and quality-controlled (i.e., after application of a median filter) vertical profiles of particulate optical backscattering at 700 nm (bbp(700))
collected in the South Atlantic subtropical (float WMO 6901439) and North Atlantic subpolar (float WMO 6901516) gyres, respec-tively. Open cyan circles indicate positive spikes (Briggs et al., 2011).
procedures do not bias the sampling spatially or temporally. However, the total number of profiles for a given latitude and month of the year is different among variables. It is generally the highest for Chl (Fig. 7c, d) and bbp(700) (Fig. 7g, h). Be-cause of the strict quality control by Organelli et al. (2016a) that removes radiometric profiles acquired under very unsta-ble meteorological conditions, the total number of Ed(λ) and PAR profiles is generally the lowest (Fig. 7i–p).
In the Northern Hemisphere, the database covers a broader latitudinal range than in the Southern Hemisphere. Data range from the Equator to the Arctic Ocean, and late spring to midsummer are the most represented periods. The number of profiles is substantially lower between January and April. This occurs especially for radiometric quantities (Fig. 7) as a consequence of the decreasing stability of the water column associated with deteriorated sky and sea conditions (D’Ortenzio et al., 2005; Lacour et al., 2015). This high con-tribution of the Northern Hemisphere to the database is due to the first projects piloting the deployment of BGC-Argo floats that were mainly focused on the North Atlantic subpo-lar gyre (i.e., 48–65◦N; remOcean project) and the Mediter-ranean Sea (i.e., 31–44◦N; NAOS project). Latitudes higher than 67◦N are included thanks to a 3-year operating float collecting all variables except FDOM (Fig. 7e). Latitudes between 0 and 30◦N (i.e., subtropical gyres and surround-ing zones) are also represented owsurround-ing to measurements ac-quired by 10 BGC-Argo floats (Fig. 7). Note, however, that the number of FDOM profiles at these latitudes is lower than for the other variables as a consequence of sensor failure on some floats and absence in those floats deployed in the frame-work of the UK Bio-Argo and E-AIMS projects (in which the FDOM sensor was replaced by a sensor measuring par-ticulate backscattering coefficient at 532 nm, bbp(532)). The Northern Hemisphere is also represented by data collected in two marginal seas (Fig. 1): the Black and Red seas. Simi-lar to subtropical gyres and surrounding areas, the number of
Figure 6.Raw and quality-controlled vertical profiles of downward irradiance at 412 nm (Ed(412)) collected by the same profiling float (WMO 6901528) in the eastern Mediterranean Sea under (a) nearly clear and (b) cloudy skies.
FDOM profiles in the Black Sea is lower than for other vari-ables because half of the floats deployed in this area mea-sured bbp(532) instead of FDOM (see Sect. 7 for bbp(532) data availability).
The Southern Hemisphere is primarily represented by data collected at latitudes between 38 and 56◦S (Fig. 7) in the Atlantic and Indian sectors of the Southern Ocean (Fig. 1). In contrast to the Northern Hemisphere, no floats have been deployed or reached latitudes higher than 60◦S (Fig. 7). Measurements of each variable are also acquired by seven floats in southern subtropical gyres (around 16–25◦S) both in the Atlantic and Pacific oceans and by two floats in the re-gion close to New Caledonia in the South Pacific (Fig. 1). The temporal coverage of data collected in the Southern Hemisphere remains uniform from January to September for each variable, but then increases from October to December (Fig. 7). This reflects a switch to adaptive sampling to bet-ter resolve the phytoplankton bloom. Similar to the Northern Hemisphere, the number of radiometric profiles tends, how-ever, to slightly decrease during the autumn and the austral summer (from June to August) as a consequence of the wors-ening meteorological conditions and deepwors-ening mixed layer depths (Dong et al., 2008).
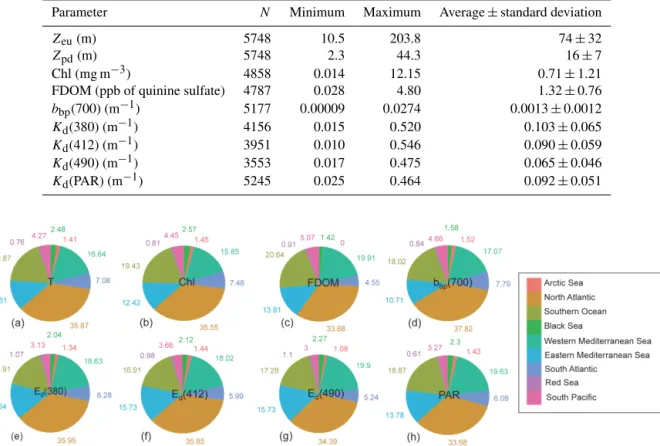
The 25 selected regions (grouped into nine major areas) contribute, in terms of number of profiles, in different pro-portions to the database (Fig. 8). This is a consequence of the different number of floats deployed in each area together with a modulated profiling frequency (from 1 to every 10 days). The North Atlantic Ocean dominates BOPAD-prof, as a con-sequence of the intensive sampling characterizing the subpo-lar gyre area in multiple programs. Vertical profiles acquired in the Southern Ocean and the western Mediterranean Sea each represent on average 18 % of the database. The eastern Mediterranean Sea is about 14 %, while the South Atlantic subtropical gyre and surrounding areas contribute 6.3 % on average. The South Pacific Ocean represents only 3 to 5 % of the vertical profiles within BOPAD-prof, while polar and
Figure 7.Latitudinal and monthly distributions of the 9837 vertical profiles, presented as stacked histograms, for (a–b) temperature (T ), (c– d) chlorophyll a concentration (Chl), (e–f) fluorescent dissolved organic matter (FDOM), (g–h) particulate optical backscattering coefficient at 700 nm (bbp(700)), (i–j) downward irradiance at 380 nm (Ed(380)), (k–l) downward irradiance at 412 nm (Ed(412)), (m–n) downward
irradiance at 490 nm (Ed(490)), and (o–p) photosynthetically available radiation (PAR). Vertical profile distributions are displayed for both Northern and Southern hemispheres.
marginal seas individually represent a proportion < 3 % of each collected variable. Large areas such as the North Pacific and Indian oceans equal 0 % as no deployments occurred in those regions.
5 BOPAD-surf: properties of the bio-optical database within the first optical depth and joint use with remote sensing of ocean color
Because of the unique in situ spatial and temporal cov-erage, the international community of optical oceanog-raphers (Claustre et al., 2010b; IOCCG, 2011, 2015; Biogeochemical-Argo Planning Group, 2016) has recently recognized measurements collected by BGC-Argo floats as a fruitful resource of data for bio-optical applications, such as the identification of regions with optical properties de-parting from mean statistical relationships (Organelli et al., 2017) as well as the validation of ocean color reflectances (Gerbi et al., 2016) and bio-optical products (IOCCG, 2015; Haëntjens et al., 2017). In this context, BOPAD-surf has been compiled with 5748 stations of biogeochemical (i.e., Chl and FDOM) and bio-optical (i.e., Kd(λ), Kd(PAR), and bbp(700)) variables within the first optical depth (i.e., the layer of interest for ocean color) as derived from previously quality-controlled vertical profiles. The characteristics of this database are described hereafter.
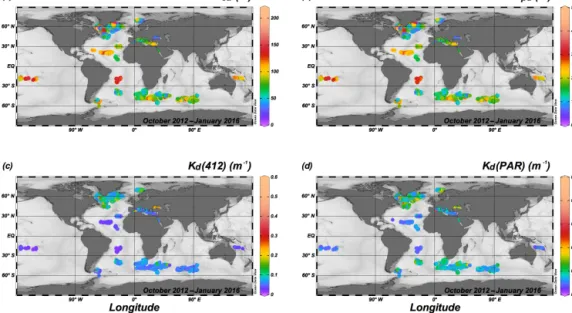
All the 5748 BGC-Argo stations correspond to quality-controlled measurements of euphotic and first optical depths and represent about 60 % of the database of quality-controlled vertical profiles. Ranges and averages (and asso-ciated standard deviations) of Zeuand Zpd and of the other variables are reported in Table 1. In agreement with previ-ous observations (Morel and Maritorena, 2001; Lee et al., 2007; Morel et al., 2007a, b; Soppa et al., 2013; Organelli et al., 2014), values of Zeu and Zpd vary mostly in the ranges of 10.5–180.2 and 2.3–39.2 m, respectively, with the deepest values characterizing the Atlantic and South Pacific ocean gyres (Fig. 9a, b). The shallowest Zeuand Zpd layers are in-stead characteristic of the North Atlantic subpolar gyre in spring, the western Mediterranean Sea, and the Black Sea (Fig. 9a, b). The observed ranges of Chl, FDOM, bbp(700), Kd(λ), and Kd(PAR) values derived from BGC-Argo mea-surements (Table 1) are also in good agreement with previ-ous observations (Morel and Maritorena, 2001; Morel et al., 2007a, b; Cetini´c et al., 2012; Dall’Olmo et al., 2012; Pelo-quin et al., 2013; Sauzède et al., 2015; Valente et al., 2016). As examples of their spatial distribution across the explored regions, Kd(412) and Kd(PAR) are shown in Fig. 9c and d, respectively. The reader is referred to the work by Organelli et al. (2017) for regional variability in Kd(380) and Kd(490) coefficients.
Kd(412) (m−1) 3951 0.010 0.546 0.090 ± 0.059
Kd(490) (m−1) 3553 0.017 0.475 0.065 ± 0.046
Kd(PAR) (m−1) 5245 0.025 0.464 0.092 ± 0.051
Figure 8.Relative contributions (%) of the 9837 vertical profiles among nine regions and subregions sampled by Biogeochemical-Argo floats: (a) temperature (T ), (b) chlorophyll a concentration (Chl), (c) fluorescent dissolved organic matter (FDOM), (d) particulate backscat-tering coefficient at 700 nm (bbp(700)), (e) downward irradiance at 380 nm (Ed(380)), (f) downward irradiance at 412 nm (Ed(412)), (g) downward irradiance at 490 nm (Ed(490)), and (h) photosynthetically available radiation (PAR). See Appendix A for basins included
within each region and/or subregion.
As a consequence of the variable-specific quality-control procedures, each variable within BOPAD-surf is represented with different proportions in the 25 regions (Table 2). Of the 5748 stations with quality-controlled Zeu, 83–90 % contain Chl, FDOM, and bbp(700) measurements; 62–72 % contain Kd(λ) values within Zpd; and > 90 % contain Kd(PAR). The Labrador Sea region contains the highest fraction of profiles of each variable (13.81–17.08 %), while the Iceland Basin and the Irminger Sea contribute on average 7.6–7.8 % of the profiles in the database (Table 2). In the Mediterranean Sea, the northwestern, southwestern, and Ionian basins each contribute between 5.5 and 9.7 % of the profiles, while the Levantine and Tyrrhenian seas each contribute about 4 % on average (Table 2). In the Southern Hemisphere, the eastern Atlantic and the Indian sectors of the Southern Ocean each contribute about 6–10 % of the entire database, while the rel-ative contribution of the western part of the Atlantic sector is < 4.45 % (Table 2). Subtropical gyres of both hemispheres contribute from 1.47 to 4.43 % according to the variable (Ta-ble 2). Marginal seas (i.e., Black and Red seas) and transition
zones among various trophic regimes represent less than 3 % of the whole database within the first optical depth (Table 2). The North Pacific and Indian oceans equal 0 %.
The goal of BOPAD-surf supporting in situ and remote bio-optical applications is demonstrated by two examples of possible use. As a first exercise, previously established bio-optical relationships (Morel et al., 2007a) are evaluated against the BGC-Argo database. It is important to identify the regions with bio-optical behaviors deviating from the average trend because a bio-optical anomaly could likely lead to uncertainties in retrieving bio-optical and biogeo-chemical quantities from satellite ocean color observations (Organelli et al., 2017). The relationship of Kd(PAR) as a function of Kd(490) for the BGC-Argo database is in good agreement with those by Morel et al. (2007a). Slight devia-tions appear, however, at the lowest Kd(PAR) and Kd(490) values and mainly correspond to samples collected in the subtropical gyres and eastern Mediterranean Sea (Fig. 10). In a second exercise, Kd(490) values obtained from the merged GlobColour satellite products (ACRI-ST, 2017) are
Eastern Mediter- Ionian Sea (ION) 7.60 9.34 5.52 9.24 8.00 8.53 8.27 ranean Sea Levantine Sea (LEV) 2.96 5.39 5.62 4.21 3.32 3.80 4.67 North Atlantic Labrador Sea (LAS) 15.62 13.81 15.14 15.18 17.08 17.00 14.41 subpolar gyre Irminger Sea (IRM) 7.64 8.36 7.78 7.87 8.83 7.15 7.42 Iceland Basin (ICB) 7.00 7.19 7.48 7.56 8.86 8.19 7.15 South Labrador Sea
(SLAS)
0.58 0.00 0.52 0.51 0.71 0.56 0.51 Transition zone (NASTZ) 0.95 0.96 0.89 0.82 0.81 0.90 0.84 North Atlantic Subtropical gyre (NASTG) 2.26 2.32 2.86 2.26 1.97 2.56 2.61 subtropical gyre Eastern subtropical gyre
(ENASTG)
1.07 0.00 0.00 1.32 1.01 1.27 1.35 Western subtropical gyre
(WNASTG)
0.08 0.00 0.10 0.05 0.00 0.03 0.08 Transition zone
(EQ-NASTZ)
1.01 0.00 1.00 0.12 0.28 0.45 0.82
Red Sea Red Sea (RED) 0.93 1.04 1.04 0.99 0.66 0.65 0.78 South Atlantic Subtropical gyre (SASTG) 1.63 4.43 4.10 3.73 2.86 3.26 3.74 Ocean South subtropical gyre
(SSASTG)
0.33 0.00 0.95 0.77 0.58 0.84 0.90 Transition zone (SASTZ) 1.81 0.00 1.70 0.99 1.47 1.60 1.51 South Pacific Subtropical gyre (SPSTG) 1.56 2.74 2.53 1.56 1.47 1.77 2.21 Ocean New Caledonia (NC) 0.97 1.19 1.12 0.87 0.68 0.90 0.93 Southern Ocean Atlantic sector (ATL) 3.54 3.91 0.64 4.45 2.91 3.74 3.68
Atlantic to Indian sector (ATOI)
10.09 10.28 9.54 7.84 10.07 8.13 8.77 Indian sector (IND) 7.93 6.25 7.51 6.09 6.73 7.60 7.11
compared to Kd(490) coefficients obtained from BGC-Argo floats (Fig. 11). While the two products agree approxi-mately at moderate values (Kd(490) ∼ 0.1 m−1), estimates from BGC-Argo floats are considerably lower on average, especially at high and very low water clarity. This result strongly warrants further investigation. Thanks to the un-precedented spatial and temporal distribution provided by these autonomous platforms, as well as to the understand-ing of the associated uncertainty, ocean color algorithm and product validation can routinely be performed in several re-gions so that errors and possible causes of failure (e.g., in-fluence of Raman scattering; Westberry et al., 2013) could be assessed and/or solved and algorithms for improving the quality of retrievals may be refined.
BOPAD-surf does not, however, represent the only effort in compiling an extensive database tailored for in situ and re-mote bio-optical applications. BOPAD-surf and the compi-lation published by Valente et al. (2016; hereafter VL2016) may be good partners, and thus be beneficial to the largest community of oceanographers as soon as complementari-ties and differences are highlighted. Though BOPAD-surf’s temporal coverage is shorter than for VL2016, it extends bio-optical measurements through 2013–2015. It includes re-gions such as the North Atlantic subpolar gyre, the Southern Ocean, and the Red Sea that are not archived in VL2016. Conversely, VL2016 offers data from the North Pacific and Indian oceans where no PROVOR CTS4 profiling floats have been deployed (Fig. 1). BOPAD-surf complements VL2016 by also providing a balanced acquisition of variables during
Figure 9.Distribution of (a) euphotic depth (Zeu), (b) first optical depth (Zpd), (c) average value of the diffuse attenuation coefficient for
downward irradiance at 412 nm within the first optical depth (Kd(412)), and (d) average value of the diffuse attenuation coefficient for the
photosynthetically available radiation within the first optical depth (Kd(PAR)).
Figure 10.Log–log plot of the diffuse attenuation coefficient for PAR (Kd(PAR)) as a function of the diffuse attenuation
coeffi-cient for downward irradiance at 490 nm averaged within the first optical depth (Kd(490)). The dashed line is the fit to all data
and corresponds to Kd(PAR) = 0.062 (±0.002) + 0.869 (±0.011)
Kd(490) − 0.001 (±4 × 10⁻⁵) Kd(490)−1, with n = 3402.
Dot-ted and solid lines represent relationships established by Morel et al. (2007a; Eqs. 9 and 90, respectively) limited to the range of Kd(490) found in that study. Biogeochemical-Argo data are
grouped into seven major areas: Norwegian Sea, North Atlantic subpolar gyre and surrounding areas (NASPG); western Mediter-ranean Sea (WMED); eastern MediterMediter-ranean Sea (EMED); Black Sea (BLACK); Red Sea (RED); subtropical gyres and surrounding areas (STG); and Southern Ocean (SO).
wintertime and harsh periods. Considering variables and dif-ferences in acquisition and processing, only the diffuse at-tenuation coefficients for downward irradiance at 412 and 490 nm (i.e., Kd(412) and Kd(490)) are directly compara-ble between the two databases. VL2016 offers a 25-band
Figure 11.Comparison (n = 658) between the diffuse attenuation coefficient for downward irradiance at 490 nm as derived from satel-lite measurements (Kd(490)sat) as a function of Kd(490) derived
from Biogeochemical-Argo float measurements within the first op-tical depth (Kd(490)in situ). The solid line represents the 1 : 1 line.
Biogeochemical-Argo data are grouped in seven major areas: Nor-wegian Sea, North Atlantic subpolar gyre and surrounding areas (NASPG); western Mediterranean Sea (WMED); eastern Mediter-ranean Sea (EMED); Black Sea (BLACK); Red Sea (RED); sub-tropical gyres and surrounding areas (STG); and Southern Ocean (SO). The RMSE and the median percentage difference (MPD) for all data are shown.
resolution of these coefficients in the visible range, while BOPAD-surf extends such a measurement to a single wave-length in the UV region (i.e., Kd(380)) and includes atten-uation coefficients for one broad waveband (i.e., Kd(PAR)). Similarly, BOPAD-surf provides measurements of the partic-ulate optical backscattering at 700 nm, a band not included in VL2016 (27 bands between 405 and 683 nm). The main
Figure 12.Ratios between sensor sensitivity thresholds and quality-controlled values of (a) chlorophyll a concentration (Chl), (b) fluo-rescent dissolved organic matter (FDOM), and (c) particulate backscattering coefficients at 700 nm (bbp(700)). Sensor sensitivity limits are
0.007 mg m−3, 0.28 ppb of quinine sulfate, and 2.2 × 10⁻⁶m−1for Chl, FDOM, and bbp(700), respectively. Measurements used as examples
correspond to quality-controlled profiles shown in Figs. 3a, 4b, and 5b.
differences between the two databases appear for the vari-ables relating to Chl and colored dissolved or detrital mate-rial. Because of calibration challenges for deriving accurate Chl concentrations from in vivo fluorescence measurements (see Sect. 6), VL2016 is only compiled with Chl concentra-tions obtained from high-performance liquid chromatogra-phy (HPLC) and/or spectrophotometric or fluorometric mea-surements on algal pigment extracts. FDOM is a different parameter from adg(λ) in Valente et al. (2016). While adg(λ) relies on the light absorption properties of the whole pool of colored dissolved and/or particulate organic material, FDOM only measures the fluorescence emitted by a fraction of this matter. Depending on the excitation and emission wave-lengths of the sensor, FDOM can be a proxy of concentra-tions of freshly produced material or more aged humic sub-stances (Nelson and Gauglitz, 2016). However, in some re-gions, FDOM can be significantly correlated to adg(λ) and thus be retrievable from ocean color remote sensing (e.g., Matsuoka et al., 2017). FDOM data included in BOPAD-surf also represent a useful resource to improve the under-standing of the optical behavior of the oceans (Organelli et al., 2017). Finally, no measurements of remote sensing re-flectance are archived within BOPAD-surf, but successors of the PROVOR CTS4 profiling floats used in BOPAD-surf are planned to be deployed in order to collect multispectral downward irradiance and upwelling radiance measurements.
6 Data uncertainty
Through this section, characterization of the uncertainty associated with each quality-controlled variable within BOPAD-prof, and for derived products contained in BOPAD-surf, is provided. No error propagation and budgets are presented here.
When using fluorescence measurements as a proxy of Chl concentration, the uncertainty may propagate from conver-sion of electronic counts in geophysical quantities, through the application of quality-control procedures for the influ-ence of the NPQ and/or other environmental variables (e.g., non-algal matter), to calibration corrections. The sensor sen-sitivity of 0.007 mg m−3(i.e., one digital count) is critical at the surface of most oligotrophic environments or for deep low Chl values, where it may be twice as high as the sig-nal (Fig. 12a). Correction for the NPQ may also introduce uncertainties depending on the procedure and assumptions on which the method relies. However, a comparison between the method by Xing et al. (2012) used here and based on the calculation of the mixed layer depth, and an alternative correction developed by Sackmann et al. (2008) based on the use of particulate optical backscattering, showed similar performances for BGC-Argo Chl measurements (X. Xing, unpublished data). As discussed by Xing et al. (2017), the correction of Chl profiles for non-algal matter disturbance by using alternative procedures with respect to the one ap-plied here may also introduce errors, which vary regionally and are the highest in the Black Sea area (∼ 0.1 mg m−3), while the lowest are observed in the subpolar North Atlantic Ocean and Mediterranean Sea (∼ 0.007 and 0.004 mg m−3, respectively). A main challenge in quality-assessing fluores-cence Chl measurements relies on the assumption of what is measured and what is actually phytoplankton biomass (Roesler et al., 2017). The fluorescence-to-chlorophyll ra-tio depends on changes in nutrient availability, growth phase, photophysiology, and taxonomic composition of algal com-munities (Cullen, 1982). This implies that calibration fac-tors may change regionally and seasonally. Indeed, stan-dard fluorometer corrections rely on the comparison with contemporaneous HPLC-determined chlorophyll concentra-tions, which are the most accurate estimates for
phytoplank-Argo Chl measurements, and no radiometry-based correc-tions have been used to avoid redundancy among variables and derived quantities (i.e., Kd(490)). Only the correction for the instrument-induced bias recommended by Roesler et al. (2017) has been applied, though it might be insufficient and thus under-correct Chl values measured at high latitudes and especially in the Southern Ocean (Roesler et al., 2017). Chl profiles prior to the application of any quality-control procedures used here, including NPQ and the recommended calibration factor by Roesler et al. (2017), are also archived in BOPAD-prof so that alternative chains of protocols can be applied at the user’s discretion.
FDOM measurements within BOPAD-prof appeared very noisy even after quality control and spike detection (see Sect. 3). However, using the profile in Fig. 4b as a specific example, the impact of the sensor sensitivity (0.28 ppb of qui-nine sulfate, ∼ one digital count) on the measured values may be critical for surface measurements (Fig. 12b). Low FDOM values at the surface may be a result of the attenuation by other optically significant substances of the light fluoresced by the dissolved material (Downing et al., 2012) and/or be quenched as an effect of increasing temperature (Baker et al., 2005). No specific methods for BGC-Argo floats mea-surements are currently available to correct for the thermal fluorescence quenching properties, and it has been preferred to avoid implementation of published procedures (Wratas et al., 2011; Downing et al., 2012; Ryder et al., 2012) as they can be applied at the user’s discretion.
Uncertainties related to the particulate optical backscat-tering, as acquired by WET Labs ECO sensors or instru-ments with similar or same technical and geometrical char-acteristics, have been discussed by already published stud-ies (Dall’Olmo et al., 2009; Briggs et al., 2011; Sullivan et al., 2013; Poteau et al., 2017). Experimental errors may arise from multiple sources such as conversion and calibra-tion coefficients (e.g., scaling factor and dark counts), instru-ment age, and sensor responsiveness to environinstru-mental fac-tors such as temperature and light (Sullivan et al., 2013). The impact of the sensor sensitivity (2.2 × 10⁻⁶m−1) on the measured values is low (Fig. 12c). The combined uncer-tainty is generally less than 10 % (Sullivan et al., 2013), but it may increase up to about 30 % in most oligotrophic envi-ronments (Dall’Olmo et al., 2009). In particular, the recent analysis by Poteau et al. (2017), which includes the same BGC-Argo floats used in this study, suggests that more
con-The shading of the float’s antenna and conductivity– temperature–depth (CTD) sensor head is negligible for the Ed(λ) sensor, except over a few degrees of the sun’s azimuth (direct shading; E. Leymarie, unpublished data). The study by Briggs et al. (2017) on radiometers imple-mented on the PROVOR CTS4 BGC-Argo floats also evidences the dependency of sensor dark counts on ambient temperature. The uncertainty in factory dark measure-ments is the lowest near 20◦C (< 0.01 µW cm−2nm−1 for Ed(λ); <1.4 µmol quanta m−2s−1 for PAR), for both Ed(λ) and PAR. The highest errors occur when the radiometer operates near 0◦C, as the uncertainty grows up to about 0.06 µW cm−2nm−1 for Ed(490) and 2.6 µmol quanta m−2s−1 for PAR. Similarly, higher uncer-tainties are also observed when radiometric measurements are acquired around 30◦C (∼ 0.03 µW cm−2nm−1 for Ed(412) and Ed(490); Briggs et al., 2017) rather than near 20◦C. It is important to note, however, that dark offsets generally affect profiles at depth as the irradiance drops to 0, whilst their impact is less than 1 % for the highest values at the top of the ocean (Organelli et al., 2016a).
In BOPAD-surf, the standard error is associated with each value of diffuse attenuation coefficient for downward irra-diance and PAR (Kd(λ) and Kd(PAR)) as derived from the linear fit on log quantities within the first optical depth Zpd (see Sect. 2.4). Errors can have an impact of up to 33 % on the measured coefficients, although the median value for the entire database is less than 5 % regardless of the waveband, with the minimum found for Kd(380) (i.e., 3.4 %). Because Chl, FDOM, and bbp(700) represent the mean value of the profile within Zpd, the standard deviations are archived in BOPAD-surf. The median value of the coefficient of vari-ation (CV%; calculated as 100 (SD-to-mean ratio)), for the entire database, is low for all three variables and around 5 % in the case of FDOM and bbp(700). The variability in Chl concentration is close to 0 % as a consequence of the appli-cation of the method by Xing et al. (2012), which corrects the NPQ by extrapolating the Chl value at the bottom of the mixed layer to the surface. More importantly, such a low vari-ability in the observed variables suggests that they were ho-mogenously distributed within the first optical depth as de-rived from PAR measurements and that Zpd was similar or shallower than the mixed layer depth.
vertical profiles of Chl before quality control and bbp(700) with removal of positive spikes (see Sect. 2.4) are also included. BOPAD-surf includes standard errors of Kd(λ) and Kd(PAR) as derived from a linear fit (see Sect. 2.4) and standard deviations of averaged Chl, FDOM, and bbp(700) values within the first optical depth. BGC-Argo raw data used in this study are publicly available online (Argo, 2000) and distributed as netCDF files. Vertical profiles of bbp(532) collected in the frame of the UK Bio-Argo (nine floats) and E-AIMS (five floats) projects can be downloaded at https://doi.org/10.17882/42182 (Argo, 2000). Files included in BOPAD-prof and BOPAD-surf can be read in table format by using standard functions of most common programming languages.
8 Conclusions and recommendations for use
The first measurements of biogeochemical and bio-optical variables collected by the PROVOR CTS4 generation of au-tonomous BGC-Argo floats have been quality-controlled and synthesized into a single database of nearly 10 000 vertical profiles (BOPAD-prof), collected in just 3 years despite me-teorological conditions in several oceanic areas with depths greater than 1000 m. Profile-derived bio-optical variables within the first optical depth have also been condensed into a database dedicated to support field and remote bio-optical applications (BOPAD-surf). Spatial and temporal coverages have been presented. Possible uncertainties for each variable have been provided.
The two databases presented here can be directly exploited for several applications, from biogeochemistry and primary production estimation and modeling, to the analysis of the physical forcing on biology together with the assessment of any seasonal and sub-seasonal dependence, and to the eval-uation of the ocean’s bio-optical variability. For specific ex-amples based on same PROVOR CTS4 profiling floats in-cluded in this study, the reader is referred to the works by
BOPAD-surf and BOPAD-prof. The new and systematic way BGC-Argo floats collect data, and their potential in dramat-ically increasing oceanic observations in a restricted time, also supplement and complement published carbon cycle and optically relevant pan-oceanic data compilations (Peloquin et al., 2013; Sauzède et al., 2015; Bakker et al., 2016; Mouw et al., 2016; Valente et al., 2016).
BOPAD-surf has also proved to directly support ocean color algorithm and product validation. Online platforms (i.e., http://seasiderendezvous.eu) are already available to support nearly real-time ocean color applications and interac-tive management of BGC-Argo profiles. We remind readers that, according to the specific use intended for these data, fur-ther processing may be needed. Additional corrections, e.g., dark counts and temperature dependence for radiometric or FDOM measurements, might be required at the user’s dis-cretion. Additional or regional adjustments on the calibra-tion factor for chlorophyll fluorescence might also be needed (Roesler et al., 2017). The quality-control procedures applied here remove only major, known sensor issues.
Finally, these two databases are a first step to provide users with the unprecedented quantity of autonomous in situ measurements processed with common internationally ac-cepted procedures. However, due to the characteristics of the Biogeochemical-Argo network (Johnson and Claustre, 2016; Biogeochemical Argo Group, 2016) and its youth-fulness, both databases are likely to evolve as new regions are explored, improved vertical and temporal frequency is achieved, and more advanced quality-control procedures are developed. Therefore, it is expected that BOPAD-prof and BOPAD-surf could be amended and/or enriched in the future with new quality-controlled profiles and products, or they might be merged with other already-operating configurations of autonomous profiling floats and sensors (e.g., Johnson et al., 2017). The way the two databases have been built makes them potentially fully interoperable with future compilations.
profile profile (days) Arctic Sea Norwegian Sea NOR 6902547 Mork K. A. E-AIMS 24/01/14 14/12/15 690 139 4.96 Black Sea Black Sea BLACK 7900591 Slabakova V. E-AIMS 20/12/13 23/09/15 643 98 6.56 7900592 Slabakova V. E-AIMS 24/12/13 25/10/14 306 29 10.55 6900807 Balan S. GeoEcoMar 11/12/14 02/01/16 388 74 5.24 6901866 Poulain P.-M. Argo Italy 06/06/15 02/01/16 576 43 13.40 Mediterranean Western Northwestern NW 6901032 D’Ortenzio F. NAOS 26/11/12 25/01/13 61 20 3.05 Sea Mediterranean 6902700 D’Ortenzio F. NAOS 08/11/15 04/01/16 58 36 1.61 Sea 6901512 D’Ortenzio F. NAOS 11/04/13 04/05/14 389 143 2.72 6901511 D’Ortenzio F. NAOS 20/02/13 17/06/13 118 102 1.16 6901653 Conan P. Bio-Argo France 09/07/14 05/03/15 240 67 3.58 6901496 Claustre H. NAOS 18/07/13 13/03/14 239 81 2.95 6901776 Claustre H. NAOS 17/03/14 27/09/14 195 59 3.31 6901649 Coppola L. Bio-Argo France 17/07/14 27/05/15 315 84 3.75 6901648 Conan P. Bio-Argo France 09/07/14 04/01/16 545 137 3.98 Southwestern SW 6901513 D’Ortenzio F. NAOS 11/05/13 23/03/15 682 161 4.24 6901511 D’Ortenzio F. NAOS 22/06/13 10/09/14 446 117 3.81 6901653 Conan P. Bio-Argo France 07/03/15 01/01/16 301 67 4.49 6901649 Coppola L. Bio-Argo France 01/06/15 05/01/16 219 47 4.66 6901600 D’Ortenzio F. NAOS 24/08/14 19/11/15 453 79 5.73 6901861 Poulain P.-M Argo Italy 28/05/14 27/02/15 276 64 4.31 Tyrrhenian Sea TYR 6901483 D’Ortenzio F. NAOS 25/07/13 27/03/14 246 57 4.32 6901490 D’Ortenzio F. NAOS 18/06/13 07/07/13 20 7 2.86 6901491 D’Ortenzio F. NAOS 18/06/13 30/05/15 712 167 4.26 6901767 D’Ortenzio F. NAOS 02/06/15 04/01/16 217 47 4.62 6901769 D’Ortenzio F. NAOS 02/06/15 04/01/16 217 47 4.62 6901864 Poulain P.-M Argo Italy 02/06/15 02/01/16 215 47 4.57 Eastern Ionian Sea ION 6901510 D’Ortenzio F. NAOS 28/05/13 26/05/15 729 175 4.17 Mediterranean 6901529 D’Ortenzio F. NAOS 28/05/13 10/02/15 624 135 4.62 Sea 6901605 D’Ortenzio F. NAOS 13/02/14 22/05/14 99 35 2.83 6901768 D’Ortenzio F. NAOS 20/05/15 05/01/16 231 55 4.20 6901771 D’Ortenzio F. NAOS 01/06/15 04/01/16 218 48 4.54 6901862 Poulain P.-M Argo Italy 29/03/15 02/01/16 280 112 2.50 6901863 Poulain P.-M Argo Italy 29/05/15 02/01/16 219 51 4.29 6901865 Poulain P.-M Argo Italy 21/02/14 24/03/15 397 118 3.36 Levantine Sea LEV 6901528 D’Ortenzio F. NAOS 18/05/13 23/05/15 736 184 4.00 6901655 D’Ortenzio F. NAOS 04/08/14 21/05/15 291 79 3.68 6901764 D’Ortenzio F. NAOS 26/05/15 02/01/16 222 46 4.83 6901765 D’Ortenzio F. NAOS 25/05/15 01/01/16 222 48 4.63 6901766 D’Ortenzio F. NAOS 26/05/15 03/01/16 223 55 4.05 6901770 D’Ortenzio F. NAOS 23/05/15 02/01/16 225 49 4.59 6901773 D’Ortenzio F. NAOS 25/05/15 05/01/16 226 50 4.52 North Atlantic Subpolar gyre Labrador Sea LAS 6901521 Claustre H. remOcean 17/05/13 06/04/14 325 66 4.92 Ocean 6901522 Claustre H. remOcean 17/05/13 18/05/13 2 2 1.00 6901524 Claustre H. remOcean 19/05/13 27/12/15 953 167 5.71 6901526 Claustre H. remOcean 19/05/13 06/06/13 19 19 1.00 6901517 Claustre H. remOcean 26/01/14 25/02/14 31 6 5.17 6901480 Claustre H. remOcean 13/05/14 27/12/15 594 148 4.01 6901481 Claustre H. remOcean 16/11/13 06/03/14 111 15 7.40 6901482 Claustre H. remOcean 26/12/14 30/01/15 36 4 9.00 6901523 Claustre H. remOcean 17/05/13 17/03/14 305 62 4.92 6901523 Claustre H. remOcean 04/06/15 22/06/15 23 7 3.29 6901527 Claustre H. remOcean 19/05/13 27/12/15 953 213 4.47 6901489 Claustre H. remOcean 02/04/14 26/02/15 331 57 5.81 6901525 Claustre H. remOcean 19/05/13 14/05/14 361 153 2.36 6901484 Claustre H. remOcean 05/01/14 06/03/14 61 10 6.10 6901485 Claustre H. remOcean 13/08/14 30/01/15 171 23 7.43 6901486 Claustre H. remOcean 26/02/14 05/01/16 679 175 3.88 Irminger Sea IRM 6901517 Claustre H. remOcean 28/10/13 16/01/14 81 9 9.00 6901480 Claustre H. remOcean 24/06/13 11/05/14 322 117 2.75 6901481 Claustre H. remOcean 19/06/13 06/11/13 141 31 4.55 6901482 Claustre H. remOcean 19/06/13 26/12/14 556 96 5.79 6901523 Claustre H. remOcean 22/03/14 01/06/15 437 85 5.14 6901519 Claustre H. remOcean 17/12/14 08/04/15 113 21 5.38 6901489 Claustre H. remOcean 26/06/13 28/03/14 276 47 5.87 6901484 Claustre H. remOcean 19/06/13 26/12/13 191 24 7.96 6901485 Claustre H. remOcean 23/06/13 08/08/14 412 73 5.64 6901486 Claustre H. remOcean 23/06/13 21/02/14 244 39 6.26 6901646 Claustre H. remOcean 18/06/14 06/02/15 234 62 3.77
Sea 6901181 Dall’Olmo G. UK Bio-Argo 15/11/15 05/01/16 52 35 1.49 Transition zone NASTZ 6901525 Claustre H. remOcean 16/05/14 04/01/16 599 139 4.31 Subtropical Subtropical NASTG 6901474 Claustre H. remOcean 27/10/12 18/10/14 722 70 10.31 gyre gyre 6901475 Claustre H. remOcean 27/10/12 24/01/13 90 85 1.06 6901472 Claustre H. remOcean 26/10/12 02/01/16 1164 120 9.70 6901473 Claustre H. remOcean 25/10/12 20/02/15 849 88 9.65 Eastern sub- ENASTG 6901151 Dall’Olmo G. E-AIMS 17/11/13 03/01/15 413 35 11.80 tropical gyre 6901152 Dall’Olmo G. E-AIMS 23/10/13 21/04/15 546 110 4.96 Western sub- WNASTG 6901182 Dall’Olmo G. UK Bio-Argo 01/01/16 05/01/16 5 5 1.00 tropical gyre 6901183 Dall’Olmo G. UK Bio-Argo 30/12/15 05/01/16 7 7 1.00 Transition zone EQNASTZ 6901174 Dall’Olmo G. UK Bio-Argo 16/10/14 05/01/16 447 94 4.76 6901175 Dall’Olmo G. UK Bio-Argo 17/10/14 05/01/16 446 93 4.80 Red Sea Red Sea RED 6901577 Claustre H. remOcean 03/10/15 03/01/16 93 31 3.00 6901573 Claustre H. remOcean 02/10/15 06/01/16 97 44 2.20 South Atlantic Subtropical SASTG 6901437 Claustre H. remOcean 11/11/12 28/10/15 1082 103 10.50 Ocean gyre 6901439 Claustre H. remOcean 10/11/12 03/08/13 267 265 1.01 6901440 Claustre H. remOcean 10/11/12 15/11/12 6 6 1.00 South
subtropi-cal gyre
SSASTG 3901496 Dall’Olmo G. UK Bio-Argo 23/10/14 01/01/16 436 108 4.04
Transition zone SASTZ 3901497 Dall’Olmo G. UK Bio-Argo 29/10/14 05/01/16 434 107 4.06 3901498 Dall’Olmo G. UK Bio-Argo 29/10/14 05/01/16 434 107 4.06 South Pacific Subtropical SPSTG 6901659 Claustre H. remOcean 16/10/15 04/01/16 81 81 1.00 Ocean gyre 6901660 Petrenko A. Bio-Argo France 31/03/15 03/01/16 279 63 4.43 6901687 Claustre H. remOcean 05/04/15 02/01/16 273 137 1.99 New Caledonia NC 6901656 Petrenko A. Bio-Argo France 05/03/15 03/01/16 305 68 4.49 6901658 Petrenko A. Bio-Argo France 23/03/15 03/01/16 287 71 4.04 Southern Atlantic sector ATL 6901650 Sallée J.-B. Bio-Argo France 09/05/15 26/06/15 49 49 1.00 Ocean 6901654 Claustre H. remOcean 09/05/15 05/01/16 241 241 1.00 6901651 Claustre H. remOcean 21/10/14 22/10/14 2 2 1.00 Atlantic to ATOI 6901582 Claustre H. remOcean 11/12/14 05/01/16 391 89 4.39 Indian sector 6901583 Claustre H. remOcean 07/05/15 05/01/16 244 56 4.36 6901576 Claustre H. remOcean 11/12/14 04/01/16 390 102 3.82 6901575 Claustre H. remOcean 07/05/15 05/01/16 244 53 4.60 6901584 Claustre H. remOcean 13/05/15 05/01/16 238 68 3.50 6901585 Claustre H. remOcean 13/12/14 04/01/16 388 85 4.56 6901492 Speich S. Bio-Argo France 04/12/13 05/01/16 763 177 4.31 6901493 Speich S. Bio-Argo France 05/12/13 04/01/16 762 167 4.56 6901578 Claustre H. remOcean 13/05/15 03/01/16 236 73 3.23 6901688 Claustre H. remOcean 13/12/14 16/08/15 247 40 6.18 Indian sector IND 6901004 Claustre H. remOcean 26/01/15 05/01/16 345 84 4.11 6901580 Claustre H. remOcean 26/01/15 04/01/16 344 102 3.37 6901574 Claustre H. remOcean 23/01/15 05/01/16 348 131 2.66 6901581 Claustre H. remOcean 24/01/15 05/01/16 347 161 2.16 6901579 Claustre H. remOcean 23/01/15 05/01/16 348 129 2.70 6901689 Claustre H. remOcean 24/01/15 25/04/15 92 46 2.00
agreement no. 2014-633211), E-AIMS (funded by the European Commission’s FP7 project, grant agreement no. 312642), UK Bio-Argo (funded by the Natural Environment Research Council, grant agreement no. NE/L012855/1), REOPTIMIZE (funded by the European Union’s Horizon 2020 research and innovation program, Marie Skłodowska-Curie grant agreement no. 706781), Argo-Italy (funded by the Italian Ministry of Education, Univer-sity and Research, MIUR), and the French Bio-Argo program (Bio-Argo France; funded by CNES-TOSCA, LEFE Cyber, and GMMC). We thank the principal investigators of several BGC-Argo float missions and projects: Sorin Balan (GeoEco-Mar, Romania), Pascal Conan (Observatoire Océanologique de Banyuls sur mer, France; Bio-Argo France), Laurent Coppola (Laboratoire d’Océanographie de Villefranche, France; Bio-Argo France), Claire Lo Monaco (Laboratoire d’Océanographie et du Climat, France; OISO program), Kjell Arne Mork (Institute of Marine Research, Norway; E-AIMS), Anne Petrenko (Mediter-ranean Institute of Oceanography, France; Bio-Argo France), Pierre-Marie Poulain (National Institute of Oceanography and Experimental Geophysics, Italy; Argo-Italy), Jean-Baptiste Sallée (Laboratoire d’Océanographie et du Climat, France; Bio-Argo France), Violeta Slabakova (Bulgarian Academy of Sciences, Bulgaria; E-AIMS), Sabrina Speich (Laboratoire de Météorologie Dynamique, France; Bio-Argo France), Emil Stanev (University of Oldenburg, Germany; E-AIMS), and Virginie Thierry (Ifremer, France; Bio-Argo France). We also thank the Coriolis program for providing standard Argo floats to be equipped with additional bio-optical and biogeochemical sensors. Sandy Thomalla (CSIR, South Africa) and the anonymous reviewer are acknowledged for constructive comments and suggestions on a previous version of the paper.
Edited by: David Carlson
Reviewed by: Sandy Thomalla and one anonymous referee
References
ACRI-ST GlobColour Team: GlobColour Product User Guide (Ver-sion 4.1), Ref: GC-UM-ACR-PUG-01, 107 pp., available at: http: //www.globcolour.info (last access: 19 November 2017), 2017. Alkire, M. B., D’Asaro, E., Lee, C., Perry, M. J., Gray, A., Cetini´c,
I., Briggs, N., Rehm, E., Kallin, E., Kaiser, J., and González-Posada, A.: Estimates of net community production and export using high-resolution, Lagrangian measurements of O2, NO−3,
and POC through the evolution of a spring diatom bloom in the North Atlantic, Deep-Sea Res. Pt. I, 64, 157–174, 2012.
M., Olsen, A., Smith, K., Cosca, C., Harasawa, S., Jones, S. D., Nakaoka, S.-I., Nojiri, Y., Schuster, U., Steinhoff, T., Sweeney, C., Takahashi, T., Tilbrook, B., Wada, C., Wanninkhof, R., Alin, S. R., Balestrini, C. F., Barbero, L., Bates, N. R., Bianchi, A. A., Bonou, F., Boutin, J., Bozec, Y., Burger, E. F., Cai, W.-J., Castle, R. D., Chen, L., Chierici, M., Currie, K., Evans, W., Feather-stone, C., Feely, R. A., Fransson, A., Goyet, C., Greenwood, N., Gregor, L., Hankin, S., Hardman-Mountford, N. J., Harlay, J., Hauck, J., Hoppema, M., Humphreys, M. P., Hunt, C. W., Huss, B., Ibánhez, J. S. P., Johannessen, T., Keeling, R., Kitidis, V., Körtzinger, A., Kozyr, A., Krasakopoulou, E., Kuwata, A., Land-schützer, P., Lauvset, S. K., Lefèvre, N., Lo Monaco, C., Manke, A., Mathis, J. T., Merlivat, L., Millero, F. J., Monteiro, P. M. S., Munro, D. R., Murata, A., Newberger, T., Omar, A. M., Ono, T., Paterson, K., Pearce, D., Pierrot, D., Robbins, L. L., Saito, S., Salisbury, J., Schlitzer, R., Schneider, B., Schweitzer, R., Sieger, R., Skjelvan, I., Sullivan, K. F., Sutherland, S. C., Sutton, A. J., Tadokoro, K., Telszewski, M., Tuma, M., van Heuven, S. M. A. C., Vandemark, D., Ward, B., Watson, A. J., and Xu, S.: A multi-decade record of high-quality f CO2data in version 3 of the
Sur-face Ocean CO2Atlas (SOCAT), Earth Syst. Sci. Data, 8, 383–
413, https://doi.org/10.5194/essd-8-383-2016, 2016.
Barbieux, M., Organelli, E., Claustre, H., Schmechtig, C., Poteau, A., Boss, E., Bricaud, A., Briggs, N., Dall’Olmo, G., D’Ortenzio, F., Prieur, L., Roesler, C., Uitz, J., and Xing, X.: A global database of vertical profiles derived from Biogeochemical Argo float measurements for biogeochemical and bio-optical applica-tions, SEANOE, https://doi.org/10.17882/49388, 2017a. Barbieux, M., Uitz, J., Bricaud A., Organelli, E., Poteau, A.,
Schmechtig, C., Gentili, B., Penkerc’h, C., Leymarie, E., D’Ortenzio, F., and Claustre, H.: Assessing the variability in the relationship between the particulate backscattering co-efficient and the chlorophyll a concentration from a global Biogeochemical-Argo database, J. Geophys. Res.-Oceans, in re-vision, 2017b.
Biogeochemical-Argo Planning Group: The scientific ratio-nale, design and implementation plan for a Biogeochemical-Argo float array, edited by: Johnson, K. and Claustre, H., https://doi.org/10.13155/46601, 2016.
Bishop, J. K. B., Davis, R. E., and Sherman, J. T.: Robotic observa-tions of dust storm enhancement of carbon biomass in the North Pacific, Science, 298, 817–821, 2002.
Boss, E. and Behrenfeld, M.: In situ evaluation of the initiation of the North Atlantic phytoplankton bloom, Geophys. Res. Lett., 37, L18603, https://doi.org/10.1029/2010GL044174, 2010. Boss, E., Swift, D., Taylor, L., Brickley, P., Zaneveld, R., Riser, S.,
Perry, M. J., and Strutton, P. G.: Observations of pigment and particle distributions in the western North Atlantic from an