Biochemical Pharmacology xxx (xxxx) xxx
Available online 27 February 2021
0006-2952/© 2021 Elsevier Inc. All rights reserved.
Brain functional MRI responses to blue light stimulation in Leber’s
hereditary optic neuropathy
Stefania Evangelisti
a,1, Chiara La Morgia
b,c,1, Claudia Testa
d,*, David N. Manners
a,
Leonardo Brizi
d,e, Claudio Bianchini
a, Michele Carbonelli
c, Piero Barboni
f, Alfredo A. Sadun
g,
Caterina Tonon
a,h, Valerio Carelli
b,c,2, Gilles Vandewalle
i,2, Raffaele Lodi
a,h,2aUnit`a di RM Funzionale, Dipartimento di Scienze Biomediche e Neuromotorie, Universit`a di Bologna, Bologna, Italy bDipartimento di Scienze Biomediche e Neuromotorie, Universit`a di Bologna, Bologna, Italy
cIRCCS Istituto delle Scienze Neurologiche di Bologna, UOC Clinica Neurologica, Bologna, Italy dDipartimento di Fisica ed Astronomia, Universit`a di Bologna, Bologna, Italy
eCentro Fermi – Museo Storico della Fisica e Centro Studi e Ricerche «Enrico Fermi», Roma, Italy fStudio Oculistico d’Azeglio, Bologna, Italy
gDoheny Eye Institute, Department of Ophthalmology, David Geffen School of Medicine at University of California, Los Angeles, Los Angeles, CA, United States hIRCCS Istituto delle Scienze Neurologiche di Bologna, Programma Neuroimmagini Funzionali e Molecolari, Bologna, Italy
iSleep and Chronobiology Lab, GIGA-Cyclotron Research Centre/In vivo Imaging, University of Li`ege, Belgium
A R T I C L E I N F O Keywords: LHON Light stimulation Melanopsin fMRI A B S T R A C T
Melanopsin retinal ganglion cells (mRGCs) are intrinsically photosensitive photoreceptors contributing both to image and non-image-forming (NIF) functions of the eye. They convey light signal to the brain to modulate circadian entrainment, sleep, alertness, cognition, brightness perception and coarse vision. Given that rods and cones also contribute to all these impacts of light, isolating mRGC visual and NIF roles in humans is challenging so that mRGC functions remains to be fully characterized. Here, we evaluated light-driven visual and cognitive brain responses in Leber’s Hereditary Optic Neuropathy (LHON), an inherited optic neuropathy that is charac-terized by a selective relative sparing of the melanopsin-expressing retinal ganglion cells (mRGCs). Twelve pa-tients and twelve matched healthy controls (HC) were enrolled in a functional brain magnetic resonance imaging (fMRI) protocol including visual and visual-cognitive paradigms under blue (480 nm) and red (620 nm) light exposures. Primary visual cortex activation was detected in LHON patients; in particular higher occipital acti-vation was found in response to sustained blue vs. red stimulation in LHON vs. HC. Similarly, brain responses to the executive task were larger under blue vs. red light in LHON over lateral prefrontal cortex. These findings are in line with the relative mRGC sparing demonstrated in LHON and support the mRGC contribution to both non- visual and visual brain functions, with potential implication for visual rehabilitation in hereditary optic neu-ropathy patients.
1. Introduction
Leber’s hereditary optic neuropathy (LHON, estimated prevalence: 1:45,000) [1] is a maternally inherited blinding disorder due to mito-chondrial dysfunction [2]. This is usually due to one of three mito-chondrial DNA (mtDNA) point mutations (m.11778G > A/MT-ND4, m.14484 T > C/MT-ND6, m.3460G > A/MT-ND1) that affect genes encoding complex I subunits (ND) of the respiratory chain [2]. In LHON
patients, optic nerve atrophy occurs consequent to degeneration of retinal ganglion cells (RGCs) in the inner retina, whereas outer retina rods and cones are preserved. Structural MR showed microstructural alterations along the visual pathway [3–4] and grey matter loss in the visual cortex [5]. Functional MR studies are so far limited to a resting state network evaluation [6] and to a single case report in a case of Charles Bonnet syndrome in a LHON patient [7], and no extensive functional characterization of brain responses to visual stimulation has * Corresponding author.
E-mail address: [email protected] (C. Testa). 1 Contributed equally.
2 Contributed equally.
Contents lists available at ScienceDirect
Biochemical Pharmacology
journal homepage: www.elsevier.com/locate/biochempharmhttps://doi.org/10.1016/j.bcp.2021.114488
been previously reported.
In LHON, notwithstanding the generalized loss of RGCs, a subtype of RGCs expressing the photopigment melanopsin (mRGCs) is relatively spared, as demonstrated by retinal post-mortem histopathology and in vivo preservation of light-induced suppression of nocturnal melatonin secretion and pupillary light reflex (PLR) [8–11], as well as by the absence of sleep and circadian disturbances [12]. In fact, as rods and cones are the main retinal photoreceptors of the image-forming system, mRGCs, which represent about 0.5 – 1% of all RGCs [8,13–16], are the third class of photoreceptors in the human eye supporting mainly the non-image-forming (NIF) functions of light. These functions include circadian rhythm photoentrainment, pupillary light reflex, melatonin suppression, as well as the regulation of alertness, sleep and cognition [17–20].
Different subtypes of mRGCs exist, with slightly different functional roles, yet overall maximally sensitive to blue light (470–480 nm) and characterized by sustained and sluggish responses to light [13,16,20–23]. More recent evidences also support an involvement of mRGCs in visual processes, such as brightness detection, light adapta-tion, coarse image formation and spatial patterns detection [17–18,22,24–31].
From the retina, the mRGCs main central projections include the hypothalamic suprachiasmatic nucleus (SCN), site of the master circa-dian clock, the hypothalamic preoptic area implicated in sleep initiation, the olivary pretectal nucleus regulating pupil size, the medial amygdala, part of the olfactory and emotional response [15,32]. Furthermore, mRGCs also project to regions typically part of the visual pathway, such as the dorsal division of thalamus LGN and the midbrain superior
colliculus [16] and a specific activation of the dorsal LGN has been demonstrated in mice [26,29–29,33–35].
Light stimulates cognitive brain activity [36,37] and functional MRI (fMRI) studies showed that, in normally sighted individuals, light in-creases brain activity over the frontal eye field and inferior frontal cortex [38] and potentially in a region encompassing the suprachiasmatic nu-cleus [39]. Likewise, the NIF system was shown to modulate attentional, executive and emotional functions, likely through mRGCs [40] with maximal efficiency with blue light at 470–480 nm [19]. However, rod and cone photoreception, contribute to mRGC light responses [19,40,41], making the isolation of mRGC specific roles challenging in humans [28]. Outer retina degeneration in totally blind patients has been used as a successful model to demonstrate mRGC contribution to NIF functions [17,42–44] and to evaluate the NIF impact of light on cognition [45,46]. Study samples were however small due to the rarity of the phenotype, making a generalization of mRGC signaling impact on cognition uncertain. In LHON, the peculiar pattern of mRGC resilience to mitochondrial dysfunction that destroys almost completely the canoni-cal RGCs with intact outer retina, provides somehow a reverse and unique model to evaluating the light-evoked brain responses primarily mediated by mRGCs.
The aim of the present study was to investigate light impact on brain functional responses in a group of LHON patients comparing them to a cohort of healthy controls (HC), further characterizing both NIF and image-forming impacts of relatively preserved mRGC in the context of the severe optic nerve atrophy.
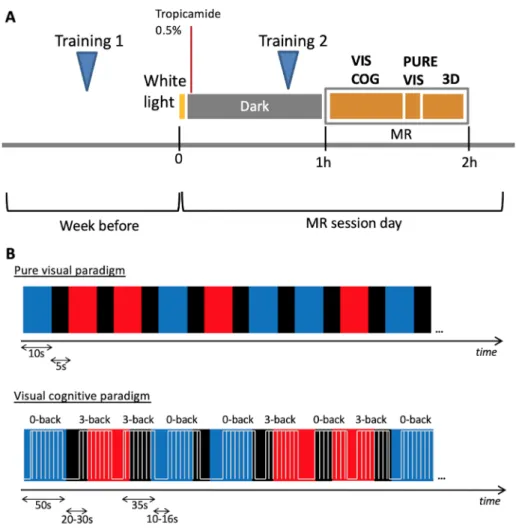
Fig. 1. Experimental protocol (A) and schematic representation of fMRI paradigms (B). An example of a sequence of light stimulation (red or blue) is provided, together with the cognitive tasks in the lower display. For representation purposes, time axes are not in scale. (VIS COG: visual cognitive paradigm, PURE VIS: pure visual paradigm, 3D: volumetric structural image).
2. Materials and methods 2.1. Subjects
Twelve patients with LHON and twelve age-matched controls participated to the study. Patients were consecutively recruited at the Neuro-ophthalmology Clinic, IRCCS Istituto di Scienze Neurologiche di Bologna, UOC Clinica Neurologica, Ospedale Bellaria, Italy. Healthy control subjects were recruited on a volunteer basis among Hospital and University co-workers. Local Ethical Committee approved the study (EC reference ID #14004), according to the Declaration of Helsinki, and all the participants gave their written informed consent.
Inclusion criterion for patients was a genetically confirmed diagnosis of LHON. Exclusion criteria for both patients and HC were contraindi-cations to MR examination, neurological or psychiatric diseases, use of drugs acting on central nervous system or on sympathetic and para-sympathetic system and excessive caffeine (>4 cups/day) or alcohol (>14 units/week) consumption; we also excluded volunteers who were shift-workers during the previous year, or had travelled through more than one time zone during the previous 2 months. Other exclusion criteria for HC were ocular hypertension, lens opacity, retinal or optic nerve diseases including macular degeneration and colour vision ab-normalities. The Morningness-eveningness questionnaire was used to assess subjects’ chronotype [47]. The Pittsburgh Sleep Quality Index Questionnaire (pathological score > 5) [48] and the Berlin question-naire [49] were used to assess the presence of sleep disturbances, and the Epworth Sleepiness Scale for excessive daytime sleepiness (ESS ≥ 11) [50]. Beck Anxiety Inventory [51] and 21-item Beck Depression Inventory scales [52] were used to evaluate anxiety and depression levels in the study cohort (pathological score ≥ 14). 2.2. Study design
2.2.1. Before fMRI sessions
During the week preceding the fMRI session, participants were asked to follow a regular sleep schedule (maintaining their habitual sleep routine, with a tolerance interval of 1 h), to be reported in sleep diaries, and they were also asked to refrain from caffeine, alcohol or other substances acting on central nervous system for 3 days before the MR session. Moreover, participants were trained to the cognitive task administered inside the MR scanner (see below; Training 1, Fig. 1-A). 2.2.2. fMRI session
For all participants, acquisitions were performed 4 h after habitual wake time. Since the seasonal variation in environmental light at the time of acquisition may affect cognitive brain activity [53], the average number of hours of light per-day at the time of MR session for each subject (data from Bologna Guglielmo Marconi Airport weather station, monthly average) was taken into account in all analyses.
On the experimental day, subjects were first exposed to white light (1000–1500 lx) for 5 min upon arrival, in order to standardize photic history across participants and level out this potential bias [40], and 1 or 2 drops of tropicamide 0.5% were administered to both eyes to induce mydriasis and cycloplegia.
The subjects were then blindfolded and stayed in a dark room for one hour before the fMRI acquisitions. During the dark adaption, subjects underwent a short second training to the cognitive task (Training 2, Fig. 1-A).
2.2.3. Light exposure
Narrow interference band-pass filters were used to produce both narrowband illuminations: blue – 480 nm (Full width at half maximum, FWHM 10 nm)- and red – 620 nm (FWHM: 10 nm). The blue wavelength was meant to correspond to melanopsin maximal sensitivity, while the red light was equally away from the peak sensitivity of the photopic visual system (i.e. 550 nm), while being close to undetected by mRGCs.
A filter wheel (AB301-T, Spectral Products, NM) was computer- controlled to switch band-pass filters and thereby change light wave-length. The light was transmitted by a metal-free purpose-built optic fibre (Fiberoptics Technology Inc, CT) from a source (DC951H illumi-nator, EKE lamp, Dolan-Jenner) to two small diffusers placed in front of the subjects’ eyes (Ground glass diffuser 220 Grit, Thorlabs). Diffusers were designed for the purpose of this study and ensured a reasonably uniform illumination over the visual field; they were placed approxi-mately 2 cm away from subjects’ eyes. Irradiance could not be measured directly in the magnet, but the light source was calibrated and photon flux estimated to be 5 × 10¹³ ph cm−2s−1 (Power meter PM100D, Thorlabs with Silicon Power head S120VC), corresponding to an irra-diance of 20.7 μW/cm2 for the blue light and 16.0 μW/cm2 for the
620 nm red light
On the lux scale, to quantify the effective illuminance for human photopigments following the International Standard CIE S026:2018 [54], for a wavelength of 480 nm and an irradiance of 20.7 μW/cm2 we
obtained the following values: photopic illuminance = 19.80 lx, mela-nopic illuminance (mRGCs) = 151.81 lx, rhodopic illuminance (rods) = 114.05 lx, cyanopic illuminance (S-cones) = 89.32 lx, chloropic illuminance (M− cones) = 50.85 lx, erythropic illuminance (L- cones) = 26.62 lx. For a wavelength of 620 nm and an irradiance of 16.0 μW/cm2 we instead obtained: photopic illuminance = 33.83 lx,
melanopic illuminance (mRGCs) = 0.09 lx, rhodopic illuminance (rods) = 0.66 lx, cyanopic illuminance (S-cones) = 0 lx; chloropic illu-minance (M-cones) = 9.34 lx, erythropic illuminance (L- cones) = 41.30 lx.
The light device produced no perceptible sounds or temperature change. The total amount of blue light received during the experiment was 4 orders of magnitude below the blue-light hazard threshold as defined by the International Commission on Non-Ionizing Radiation Protection (ICNIRP Guidelines 2013) [55].
2.2.4. fMRI paradigms
The first paradigm tested was meant to investigate the possible role of mRGCs in a pure visual setting. Participants were exposed to blue or red lights for periods of 10 s separated with 5 s of complete darkness (<0.01 lx), with a random colour alternation, for a total duration of 5 min (Fig. 1-B).
In order to investigate mRGC-driven modulation of brain responses during a working memory task, a cognitive paradigm was constructed based on previous studies [45,56] (Fig. 1-B). The paradigm included 50 s illumination periods under blue or red light exposure, separated by dark periods of 20 to 30 s (mean 25 s). While exposed to light or maintained in darkness, participants performed 35 s blocks of either 0-back and 3- back auditory task separated by rest periods lasting 10 to 16 s (mean 13 s). Both auditory tasks consisted in series of consonants. The 0-back task was a simple letter detection task during which subjects were requested to state whether or not the consonant was an “r”. The 3-back task is a working memory task requesting to state whether each conso-nant was identical to the consoconso-nant presented three stimuli earlier. It is an executive task probing maintenance and updating of information as well as attention and auditory processing [57,58].
Responses were given by pressing a button on a MR-compatible handgrip when the answer was yes. Stimuli consisted of nine Italian monosyllabic consonants (duration = 0.5 s, Stimulus Inter-val = 2 s), produced using COGENT 2000 (www.vislab.ucl.ac.uk/c ogent.php), implemented in MATLAB (MathWorks, MA), and trans-mitted to the participants using MR compatible headphones. Series of stimuli were constructed with 30% hits so that the difficulty level was similar in all blocks, were presented only once and were randomly assigned to a task block. Each auditory task block consisted of a series of 14 consonants. A total of 42 blocks were presented, 21 of 0-back and 21 of 3-back, randomly alternated. Each type of task was preceded by a short vocal instruction. The cognitive task was totally uncorrelated to the light condition, i.e. presentation of task blocks was independent
from light changes, so that both the impact of light on prefrontal cognitive brain activity and occipital visual brain activity could be investigated separately. The duration of the cognitive paradigm was about 35 min.
2.3. fMRI acquisition
fMRI acquisitions were performed with a 1.5 T system (GE Medical System Signa HDx 15), equipped with an 8-channel brain phased array coil. The static magnetic field of the apparatus was therefore lower than previous 3 T fMRI studies on the NIF impact of light [45,56,59]. Since signal and signal-to-noise ratio (SNR) decrease non-linearly as a function of magnetic field, this implies that sensitivity of the apparatus was much lower than previously. Yet, the excellent access to the rare phenotype of interest at the University of Bologna, i.e. relative increase in mRGC photoreception in LHON patient, led us to postulate that the most prominent effects, i.e. the greater relative difference in mRGC/RGC output, would be detectable with the 1.5 T apparatus. Functional MR images were acquired with a multislice T2*-weighted gradient-echo- planar sequence using pure axial slice orientation (34 slices, thickness 4 mm, in-plane resolution 1.875 × 1.875 mm, field of view FOV = 240 × 240 mm, matrix size = 98 × 98 × 34, repetition time TR = 3000 ms, echo time TE = 40 ms, flip angle = 90◦). High-resolution volumetric structural images were acquired using a T1-weighted fast spoiled gradient echo (FSPGR) sequence, (TR = 12.4 ms, TE = 5.2 ms, inversion time TI = 600 ms, flip angle = 10◦, matrix size = 256 × 256 mm, FOV = 256 × 256 mm, voxel size 1 × 1 × 1 mm). Acquisitions started with the visual cognitive paradigm, then the pure visual paradigm followed, and the structural images acquisitions. 2.4. fMRI data analysis
Analyses of fMRI data were performed with the FSL software (htt ps://fsl.fmrib.ox.ac.uk/fsl/). Image pre-processing included motion correction through rigid body registration (MCFLIRT, Motion Correction FMRIB’s Linear Image Registration Tool), high-pass filtering (cut-off 100 s for pure visual paradigm and 150 s for visual-cognitive paradigm), spatial smoothing (gaussian kernel FWHM 5 mm) and slice timing correction.
At the single subject level, changes in brain responses were estimated by using a general linear model, in which aspects of interest were modelled using boxcar or stick functions convolved with a double- gamma hemodynamic response function. In particular, for the pure vi-sual paradigm, the following explanatory variables (EV) were included
in the design matrix: blue and red (modelled with boxcar functions), blue on, blue off, red on and red off (modelled with stick functions). Movement parameters derived from realignment for motion correction were added as covariate of no interest. COPE (Contrast of Parameter Estimates) maps were generated for the following contrasts: blue, red, blue > red, blue < red, blue on, red on, blue on > red on, blue on < red on. Light offsets were included as regressors of no interest.
Regarding the visual cognitive paradigm, boxcar functions were used to model 0-back task blocks, 3-back task blocks, blue illumination pe-riods and red illumination pepe-riods. Stick functions were used for light onset and offset which were considered as covariate of no interest together with movement parameters. The following EVs were included in the design matrix: 0-back, 3-back, blue, red (modelled with boxcar functions), blue on, blue off, red on, red off (modelled with stick func-tions), and then the interactions between light and task: 0-back under blue, 0-back under red, 3-back under blue, 3-back under red. In all contrasts, executive brain responses were isolated by subtracting brain responses to the 0-back task from the brain responses to the 3back task. We assessed these brain responses irrespective of the light condition and then evaluated the impact of light on executive responses. COPE maps were generated for the following contrasts: 3-back > 0-back, blue, red, blue > red, blue < red, [(3-back blue – 0-back blue) > (3-back red – 0- back red)], [(3-back blue – 0-back blue) < (3-back red – 0-back red)].
Functional images were linearly aligned to structural images and structural images were non-linearly aligned to the MNI template. At the group level, comparisons between LHON patients and HC were carried out with non-parametric statistics obtained by permutation methods (FSL randomise, with 5000 permutations). Age, sex and the average numbers of hours of light per day at the moment of MRI acquisitions were added as covariate of no interest. Comparisons were performed within pre-defined regions of interests: primary visual cortex for the visual effects and prefrontal brain regions associated with working memory tasks for the visual-cognitive effect. Precisely, V1 was defined based on Juelich histological atlas [60] definition at 25% probability, while regions involved in working memory task were defined according to a recent meta-analysis results [61] by drawing a sphere of 10 mm radius around each coordinate reported for all active main effect and load condition. Statistical inferences were made from statistical maps that were corrected for multiple comparisons with a threshold free cluster enhancement (TFCE) method, considering significant results at p < 0.05. An analogous approach was used to investigate possible cor-relations between fMRI results and patients’ ophthalmological data. Input data for the statistical analysis of this study, including fMRI COPE images and task performances, are available at Mendeley Data (https:// doi.org/10.17632/xjj2vpbsck.1).
2.5. Demographic and behavioural data analysis
Normal distribution of all data types was checked with a Shapiro- Wilk test. Gender was compared between the two groups with Pear-son’s χ2 test, while age and the average hours of light were compared
with a t-test. The performances in the two training sessions of the n-back cognitive tasks were compared between sessions with a paired t-test, and between patients and controls with a t-test. As for the performance of the cognitive task during MR acquisitions, a two-way mixed design ANOVA was performed, with group (patients or controls) as independent factor and light conditions (blue, red, darkness) as the three-level repeated measures.
2.6. Ophthalmological evaluations
Both patients and controls performed an ophthalmological evalua-tion which included the assessment of visual acuity (ETDRS chart), measurement of intraocular pressure (IOP), evaluation of the anterior chamber by means of slit lamp and of the fundus oculi by means of direct ophthalmoscopy. Moreover, participants performed evaluation of colour Table 1
Sample demographics and questionnaire on sleep, anxiety and depression. (LHON: Leber’s hereditary optic neuropathy; HC: healthy controls; PSQUI: Pittsburgh Sleep Quality Index; ESS: Epworth Sleepiness Scale; OSA: Obstructive sleep apnea; p-value t-test unless differently specified).
LHON HC p-value
Age
(mean ± sd) years 38.2 ± 12.9 37.8 ± 13.7 0.95 Gender
(M/F) 10/2 8/4 0.35 (Pearson’s χ2) Average hours of light
(mean ± sd) 12.6 ± 2.1 12.7 ± 2.2 0.95 Extreme morning chronotype
(mean ± sd) 59.8 ± 9.3 57.4 ± 5.0 0.44 PSQI
(mean ± sd) 4.9 ± 2.3 3.7 ± 2.2 0.22 ESS
(mean ± sd) 6.8 ± 3.8 7.3 ± 1.4 0.65 Berlin questionnaires for OSA Low risk Low risk / Beck anxiey
(mean ± sd) 12.6 ± 7.7 5.4 ± 6.8 0.05 Beck depression
vision (Ishihara’s Test for Colour-Blindness-Kanehara Shupman Co., Tokyo, Japan), computerized visual field (Humphrey, Zeiss) and optical coherence tomography (OCT) (Stratus, Zeiss). For correlation analysis the following metrics were used: visual acuity, mean deviation for computerized visual fields, retinal nerve fibre layer (RNFL) thickness average and single quadrants (temporal, superior, nasal and inferior) thickness (for more details on OCT methods see [62].
3. Results
3.1. Demographic, clinical and behavioral results
LHON patients and HC did not significantly differ in terms of age, gender and average number of hours of light at the time of fMRI ac-quisitions. None of the participants had an extreme morning-evening chronotype, nor presented excessive sleep-wake disturbances, as eval-uated by PSQI, ESS and Berlin questionnaires. Beck anxiety and depression scores were normal in all participants, except for two patients who presented mild to moderate levels of anxiety and depression (Table 1).
Sample demographic are reported and compared in Table 1. Full ophthalmological description of patients is reported in Table 4. Partic-ipant were trained twice to the MRI task prior to entering the MR apparatus. At the second training session performed 1 h prior MRI
acquisition, all the participants reached at least 75% of accuracy in both n-back tasks. Over the whole study cohort, there was a modest but sig-nificant improvement of performances between the first training (during the week before MRI acquisitions) and the second one (just before MRI acquisitions) in the 3-back task (paired t-test, p = 0.020, mean first training: 85.7%, mean second training: 89.3%).
As for the accuracy to n-back tasks during fMRI acquisition, as intended given the short block duration of both task and light exposures, there was no significant main effect of group (0-back: F = 0.552, p = 0.473; 3-back: F = 0.759, p = 0.402), nor light condition (0-back: F = 2.861, p = 0.113; 3-back: F = 3.732, p = 0.056), as well as no sig-nificant interaction between group and light condition (0-back: F = 1.379, p = 0.272; 3-back: F = 1.932, p = 0.174). These results imply that the fMRI results were not biased by significant differences in the cognitive task performances.
3.2. Narrowband light stimulations
We first considered the impact of light exposure only, i.e. indepen-dent of the presence of a cognitive task. Brain responses to narrowband light stimulation were considered for three different durations of light stimuli: transient effects (light onset) and 10 s, during the pure visual paradigm, and 50 s sustained effects during the visual-cognitive paradigm.
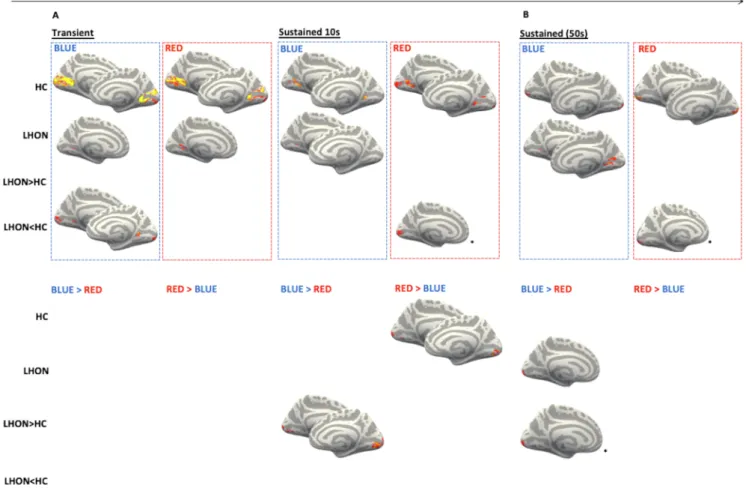
Fig. 2. Brain responses to light stimulations. Significant (TFCE-corrected p < 0.05) results for LHON and HC brain response to transient effects at light onset (A, left), 10 s sustained effects (A right) and 50 s sustained effects (B) (upper panel) and for the comparisons between red and blue light (lower panel). A: light stimulation effects from the pure visual paradigm; B: light stimulation effects from the visual-cognitive paradigm (the contribution of the cognitive task being regressed out). Brain images are shown only for the significant results, including comparisons between blue and red lights. Only for the visualization, the results were registered and projected onto freesurfer fsaverage brain surface, left hemisphere is shown on the right. LHON: Leber’s hereditary optic neuropathy; HC: healthy controls; LHON >< HC: bold response changes superior (>) or inferior (<) in patients vs. HC; BLUE >< RED: bold response changes superior (>) or inferior (<) under blue vs. red light exposure *: only for visualization purposes clusters are shown at p < 0.1 (clusters were however found at p < 0.05, see Table 2).
At light onset, activations of the primary visual cortex were detected in both groups for both light conditions, but with a greater extent in HC. Significantly higher response was detected in HC compared to LHON patients under blue light. No significant differences were detected when blue and red light were compared in either groups, and no significant difference in blue vs. red light were detected across groups (Figs. 2 and 3, Table 2).
Both groups showed sustained responses to 10 s and 50 s exposure to blue light over several parts of the primary visual cortex. In contrast, sustained visual cortex responses to 10 s and 50 s red light exposure were only detected in HC. Accordingly, sustained responses to both 10 and 50 s red light were significantly higher in HC than in LHON patients.
When assessing the interaction between light conditions and groups,
sustained responses were greater under blue vs. red light exposure in LHON patients relative to HC in the occipital cortex for both 10 and 50 s conditions (Figs. 2 and 3, Table 2).
No significant correlations were found in LHON patients between functional visual responses under either blue or red light and ophthal-mological data, namely visual acuity, visual fields and retinal nerve fibre layer thickness.
3.3. Light modulation of cognitive brain responses
Executive brain responses, isolated by subtracting 0-back brain re-sponses from 3-back rere-sponses, were observed in the typical brain areas sustaining working memory [58] and similar between the two groups, Fig. 3. Bar plot of brain responses to light stimulations. Bar plots describing the mean parameters estimates (average in arbitrary units ± standard error of the mean) of the significant voxels that were found for the comparisons between light conditions and/or groups (Fig. 2, Table 3). A representative brain response, taken from the main significant cluster, is displayed for each contrast yielding a significant difference (indicated with *).
Table 2
Brain response to monochromatic light stimulation. Cluster data of significant (TFCE-corrected p < 0.05) results for LHON and HC brain response to transient effects at light onset, 10 s sustained effects and 50 s sustained effects. Coordinates of the most significant voxel within each cluster are reported, in standard MNI space; brain areas are referred to the Harvard-Oxford Cortical and Subcortical Structural Atlases. None of the reported results were correlated to ophthalmological data, namely visual acuity, visual fields and retinal nerve fiber layer thickness. (LHON: Leber’s hereditary optic neuropathy; HC: healthy controls; l: left; r: right.)
Volume (mm3) p-value Coordinates (mm) Area (side)
x y z
Transient effects
Blue HC 16840 <E-10 − 18 − 52 −4 Lingual Gyrus (l)
LHON 216 1.80E-02 22 − 58 4 Lingual Gyrus (r)
LHON > HC no significant voxels
LHON < HC 1312 2.00E-02 14 − 84 14 Intracalcarine Cortex (r)
640 2.80E-02 − 4 − 94 −10 Occipital Pole (l)
456 5.00E-03 − 22 − 52 2 Lingual Gyrus (l)
264 1.70E-02 20 − 54 0 Lingual Gyrus (r)
Red HC 11664 1.00E-03 20 − 54 0 Lingual Gyrus (r)
LHON 712 1.70E-02 22 − 58 6 Intracalcarine Cortex (r)
LHON > HC no significant voxels LHON < HC no significant voxels
Blue > Red HC no significant voxels
LHON no significant voxels LHON > HC no significant voxels LHON < HC no significant voxels
Blue < Red HC no significant voxels
LHON no significant voxels LHON > HC no significant voxels LHON < HC no significant voxels
Sustained effects (10 s)
Blue HC 1792 3.00E-03 18 − 64 2 Intracalcarine Cortex (r)
440 4.00E-03 − 20 − 56 0 Lingual Gyrus (l)
LHON 136 3.70E-02 18 − 60 2 Lingual Gyrus (r)
40 1.40E-02 − 18 − 66 4 Intracalcarine Cortex (l)
LHON > HC no significant voxels LHON < HC no significant voxels
Red HC 4240 6.00E-03 20 − 62 8 Intracalcarine Cortex (r)
984 2.60E-02 − 14 − 100 −10 Occipital Pole (l)
344 1.40E-02 − 22 − 56 0 Lingual Gyrus (l)
336 2.20E-02 − 18 − 66 12 Supracalcarine cortex (l)
LHON no significant voxels LHON > HC no significant voxels
LHON < HC 16 4.70E-02 20 − 80 12 Intracalcarine Cortex (r)
16 4.80E-02 16 − 98 0 Occipital Pole (r)
Blue > Red HC no significant voxels
LHON no significant voxels
LHON > HC 5400 7.00E-03 − 6 − 88 −2 Intracalcarine Cortex (l)
968 2.30E-02 20 − 94 10 Occipital Pole (r)
24 4.40E-02 20 − 86 −4 Occipital Fusiform Gyrus (r)
LHON < HC no significant voxels
Red > Blue HC 2512 4.00E-03 − 14 − 96 0 Occipital Pole (l)
1072 1.00E-02 18 − 94 8 Occipital Pole (r)
208 4.20E-02 8 − 78 −6 Lingual Gyrus (r)
144 2.30E-02 20 − 86 −4 Occipital Fusiform Gyrus (r)
112 4.20E-02 14 − 100 2 Occipital Pole (r)
LHON no significant voxels LHON > HC no significant voxels LHON < HC no significant voxels
Sustained effects (50 s)
Blue HC 2600 7.00E-03 − 14 − 100 −6 Occipital Pole (l)
LHON 2160 8.00E-03 20 − 62 4 Intracalcarine Cortex (r)
1152 3.20E-02 16 − 96 −8 Occipital Pole (r)
296 2.90E-02 4 − 92 −6 Occipital Pole (r)
200 3.90E-02 − 14 − 104 −12 Occipital Pole (l)
168 4.30E-02 − 20 − 60 4 Intracalcarine Cortex (l)
144 4.50E-02 − 28 − 100 0 Occipital Pole (l)
56 4.60E-02 4 − 84 −8 Lingual Gyrus (r)
16 4.90E-02 18 − 102 8 Occipital Pole (r)
LHON > HC no significant voxels LHON < HC no significant voxels
Red HC 6080 1.00E-03 − 14 − 100 −6 Occipital Pole (l)
LHON no significant voxels LHON > HC no significant voxels
LHON < HC 32 3.40E-02 − 18 − 96 −12 Occipital Pole (l)
Blue > Red HC no significant voxels
LHON 1464 1.00E-02 18 − 96 −8 Occipital Pole (r)
32 4.30E-02 14 − 90 16 Occipital Pole (r)
and encompassed the prefrontal, parietal and cingulate cortices, thal-amus, and putamen (Fig. 4; Table 5). No group differences were detected suggesting that both patients and HC successfully and similarly per-formed both auditory tasks.
We then examined whether executive brain responses were affected in a wavelength-dependent manner. Analyses reveal that, compared to red light exposure, blue light exposures increased executive brain re-sponses in LHON patients in the middle frontal gyrus (Fig. 5, Table 3). No such a significant difference was detected in HC and groups did not significantly differ when considering the differential impact of light wavelength on executive responses.
In addition, no significant correlations were found in LHON patients between functional brain cognitive responses under either blue or red light and ophthalmological data, namely visual acuity, visual fields and retinal nerve fiber layer thickness.
4. Discussion
This study investigated the light-driven modulation of brain activity through fMRI in a cohort of chronically and severely affected LHON patients, large enough to allow for group level statistical inferences. The results demonstrate that primary visual cortex of LHON patients was Table 2 (continued)
Volume (mm3) p-value Coordinates (mm) Area (side)
x y z
24 4.60E-02 26 − 96 −18 Occipital Pole (r)
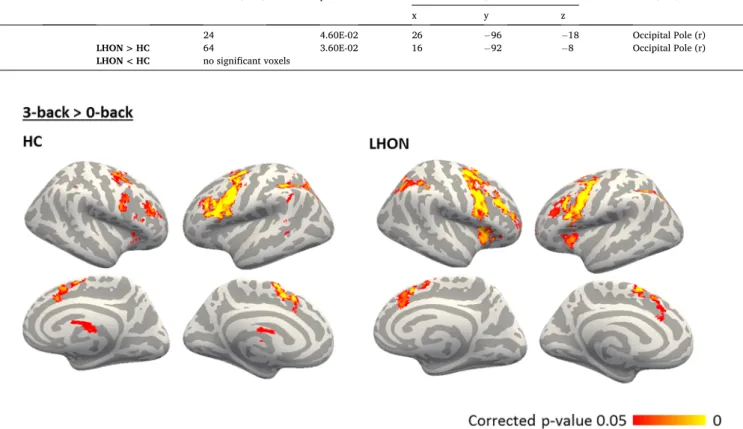
LHON > HC 64 3.60E-02 16 − 92 −8 Occipital Pole (r)
LHON < HC no significant voxels
Fig. 4. Significant (TFCE-corrected p < 0.05) group-level results for responses to 3-back task compared to the control condition (0-back) irrespectively of light conditions. Only for the visualization, the results were registered and projected onto freesurfer fsaverage brain surface, left hemisphere is shown on the right. (LHON: Leber’s hereditary optic neuropathy; HC: healthy controls.)
Fig. 5. Brain response in LHON patients is modulated by light conditions during the attentive task. Significant (TFCE-corrected p < 0.05) results for brain responses to the interaction between 3-back task and different light conditions. Results are shown only for LHON group effect since other contrasts in HC gave no significant results. The background image is an average of individual T1-w scans - in radiological convention. Only for visualization purposes the cluster is shown at p < 0.1 (it was however found significant at p < 0.05, see Table 3). The bar plot describing the mean parameters estimates for the significant contrast (indicated with *) is reported in the lateral panel.
active in response to, monochromatic blue light stimuli of different durations (transient, sustained 10 s and 50 s), with a significantly higher sustained activation in response to blue compared to red light stimula-tion in LHON compared to HC. In particular, we found V1 cortex acti-vation with both blue and red light at all stimuli durations in HC subjects, whereas for LHON V1 activation was evident only in response to blue light. It appears therefore that our findings arise from a greater relative difference between light conditions (blue vs. red) in LHON pa-tients compared with HC.
In addition to recordings of brain activity related to light exposure, our protocol also investigated whether monochromatic light stimulation would affect an ongoing cognitive brain activity by including an audi-tory working memory task in one of the fMRI sessions. Interestingly, executive brain responses were differentially affected by light wave-length, with blue light associated with higher activations than red light, in LHON patients over the lateral prefrontal cortex (or middle frontal areas) typically involved in higher executive function [63], while such a difference was not detected in HC.
We previously reported only one single study on functional brain MRI responses in a LHON patient [7]. However, the methodology in this case included multimodal stimulation based on auditory elicited visual hallucinations and purely visual checkboard stimulation not evoking any brain activation, and was not aimed at evaluating the brain re-sponses induced by the specific stimulation of mRGCs.
Here, despite the degeneration that affects RGCs and the consequent optic nerve atrophy in LHON patients, it is remarkable that primary visual cortex still reacts to visual stimulation and specifically to blue light stimulation in these patients. These results are in line with others showing that LHON patients were comparable to healthy controls in terms of melatonin suppression, subjective sleepiness and cognitive functions in response to bright light exposure in the evening [11] and therefore suggest that the ability of residual RGCs (and particularly the spared mRGCs) to send signals from retina to the visual cortex is maintained, along with melatonin suppression and other NIF responses such as pupillary reflex [8–11].
It is well-known that the isolation of mRGC contribution to pupil and brain functions in vivo is quite difficult since these cells receive inputs also from the classical photoreceptors, i.e. rods and cones and the spectral sensitivities of these three classes of photoreceptors are in part overlapping (Spitschan et al., 2018) [28]. Thus, methods for silent substitution have been proposed to isolate mRGCs [64] and Spitschan
et al., 2018, [28]. Our light stimulation protocol, based on the use of monochromatic blue and red light and on the selective sensitivity of mRGCs to the shorter of the two wavelengths, does not allow to isolate melanopsin contribution per se. In other words, we cannot exclude that rods/cones activity (that remain intact in LHON) is contributing to the effects we measured. However, given the fact that melanopsin is maxi-mally sensitive to blue light and has a sluggish response on one side, and that we have stronger V1 response in LHON with sustained stimuli of blue light on the other side, our results are in line with the inference that the mRGC signal indirectly feeds to the cortex mostly devoted to vision in humans, in addition to their classical role in circadian photo-entrainment and other NIF functions [22,45,45,64]. The present find-ings, thus, overall confirm that mRGCs are relatively spared in LHON [8,10].
Moreover, our results are also in line with a role of mRGCs in cortical visual processes [65]. This is in fact highlighted by a direct retinofugal projection of mRGCs to the LGN that, in turn, projects to the primary visual cortex (V1) in mice [24,32,66], rats [67] and non-human pri-mates [16,21]. Furthermore, neurophysiological studies in mice suggest that mRGCs can support spatial visual perception (discrimination of very coarse patterns) in animals lacking the classical rod-cone outer retinal system [24]. These studies point to a sustained and scalable response to light stimulation mediated by the dorsal LGN (dLGN) [68] in photopic conditions [33,69]. Melanopsin RGCs may drive a generalized increase of dLGN excitability, conveying information about changing background light intensity and increasing the signal/noise for fast visual responses [70]. A retinal circuitry driving changes in RGCs firing as an active response to changes in ambient light to adjust the amount of vi-sual information transmitted to the brain was also previously described [71]. The mRGC projections to LGN may help in the encoding visual images by increasing the thalamic representation of scenes in reference to total radiance [30]. Moreover, knockout mice for melanopsin show an impoverished coding of natural scenes suggesting the influence of mRGCs on the spatial and temporal tuning of dLGN neurons [29].
Melanopsin RGCs also contribute to visual processing through the maintenance of the pupil light reflex and light avoidance behaviour [72]. Finally, a melanopsin system contribution to brightness discrimi-nation has been demonstrated in mice with and without retinal de-generations [25,28]. Psychophysical experiments in healthy human subjects have shown a similar role in brightness perception [25,73] and suggested the mRGC capacity to signal slowly changing stimuli of light colour [74]. Further support for the contribution of melanopsin to human vision is provided by recent evidence that spatial patterns that were spectrally indistinguishable for cones but had contrast for mela-nopsin could be discriminated by healthy human subjects [31]. Like-wise, an fMRI study in four healthy subjects demonstrated that high contrast melanopsin-specific light stimuli elicited a response in the primary visual cortex, associated with a brightening of visual perception [64]. The class of mRGCs that more likely play a role in visual forming functions is represented by non-M1 subtypes and in particular by M4 and more recently M5-subtypes [20,75]. In particular, melanopsin photosensitivity contribution of M4 cells output is particularly impor-tant for contrast sensitivity functions [76].
Melanopsin-mediated modulation of cognitive brain activity was previously found in sighted subjects over the same lateral prefrontal cortex areas that we isolate in LHON patients [56]. However, we did not find significant differences between executive responses under blue and red light periods in HC as well as no significant difference between groups. The fact that we found a significant difference in the comparison between blue and red light only in LHON patients but not in HC is presumably due to the higher ratio mRGCs/RGCs reported in LHON. The absence of group differences and light condition difference in HC arises in our view from 2 main factors: i) the smaller sample size (previous studies in sighted individual included up to 16 volunteers [40,59], and ii) the reduced magnetic strength (1.5 T vs. 3 T), leading to a lower signal and SNR and time required for a brain volume acquisition (3 s vs. ~ 2 s) Table 3
Executive brain response in LHON patients is modulated by light conditions. Cluster data for the significant (TFCE-corrected p < 0.05) results for brain re-sponses to the interaction between 3-back task and different light conditions. Coordinates of the most significant voxel within each cluster are reported, in standard MNI space; brain areas are referred to the Harvard-Oxford Cortical and Subcortical Structural Atlases. None of the reported results were correlated to ophthalmological data, namely visual acuity, visual fields and retinal nerve fiber layer thickness. (LHON: Leber’s hereditary optic neuropathy; HC: healthy con-trols; l: left; r: right.).
Volume (mm3) p-value Coordinates
(mm) Area
x y z
(3-back > 0-back)blue > (3-back > 0-back)red
LHON 24 4.10E-02 −44 6 40 Middle Frontal
Gyrus (l) HC no significant voxels
LHON > HC no significant voxels LHON < HC no significant voxels
(3-back > 0-back)blue < (3-back > 0-back)red LHON no significant voxels HC no significant voxels LHON > HC no significant voxels LHON < HC no significant voxels
Biochemical Pharmacology xxx (xxxx) xxx 10 Table 4
Clinical and ophthalmological evaluations for LHON patients. (DD: disease duration; LE: left eye; RE: right eye; VA: visual acuity; HM: hand motion; VF: visual field; MD: mean defect; RNFL: retinal nerve fibre layer; avg = average, T: temporal; S: superior; N: nasal; I: inferior; n.e.: not executed, due to unfeasibility).
ID Sex Age
(yrs) Mutation DD (yrs) VA VF Description LE RE RNFL LE RE
LE RE MD fovea MD fovea avg T S N I avg T S N I
1 M 22 11778/
ND4 5 20/800 20/ 2000 generalized defect –33.03 not active − 34.1 not active 45 31 55 44 51 47 31 59 45 54 2 M 27 11778/
ND4 10 20/ 1250 20/400 central scotoma right eye; generalized defect left eye
−30.95 not active
− 16.95 18 39 27 5 2 36 39 27 62 33 33 3 M 29 11778/
ND4 4 20/ 1600 20/ 2000 n.e. n.e. n.e. n.e. n.e. 44 38 56 46 37 47 32 60 42 54
4 M 29 11778/
ND4 12 20/ 2000 20/ 1600 generalized defect right eye n.e. not active − 34.03 not active 41 44 35 45 41 32 27 40 34 25 5 M 40 11778/
ND4 13 20/320 20/ 2000 generalized defect –32.96 n.e. n.e. n.e. 51 30 73 52 47 56 45 73 43 61 6 F 54 11778/
ND4 24 20/ 2000 20/630 n.e. n.e. n.e. n.e. n.e. 40 27 54 36 43 41 36 53 33 42
7 M 59 11778/ ND4 32 20/500 20/ 2000 generalized defect −30.99 not active − 31.45 not active 50 29 49 60 61 43 27 56 39 51 8 M 34 3460/ND1 17 20/630 20/400 generalized defect −31.78 not
active − 27.14 not active 48 40 67 35 52 47 40 54 52 41 9 F 60 3460/ND1 49 20/320 20/200 central scotoma bilaterally −18.05 4 − 19.64 0 53 32 66 46 69 47 29 57 48 54
10 M 39 3890/ND1 9 20/
1250 20/ 1000 generalized defect n.e. n.e. –33.42 not active 50 38 57 50 57 48 40 63 51 38 11 M 29 14258/
ND6 13 20/630 20/630 generalized defect
−27.33 <0 − 27.72 <0 45 34 54 43 51 48 30 55 59 49 12 M 36 14484/
ND6 20 20/ 1000 20/125 generalized defect n.e. n.e. –32.04 20 38 29 43 36 42 37 32 39 39 39 Ophthalmological data of LHON patients are reported in Table 4. Fundus examination revealed a diffuse optic atrophy for all LHON participants, and Ishihara’s Test score was 0/12 for all of them. Visual field examination was not available for two LHON patients with a very severe visual loss for which the exam was not reliable. For the same reason, for 4 out of 12 LHON patients the VF of only one eye was considered for subsequent analyses. The duration of the disease in LHON patients was 17 ± 12 years and the average visual acuity for the entire cohort of LHON patients was 20/630. Average RNFL thickness, as evaluated by OCT, was 45.3 ± 5.1 µm indicating severe optic atrophy. HC subjects had normal ophthalmological exam including OCT and visual acuity was 20/20 in all of them.
Evangelisti
et
[45,56,59]. We further emphasize that, despite all these limitations, we were able to isolate a light condition impact while performing a cogni-tive task in part of our sample (and across both groups without cognicogni-tive tasks – cf. above). The fact that differential impact of light wavelength on ongoing brain activity was most evident in the LHON group gives further support to an important role of mRGCs in modulating ongoing cognitive activity. Aside from a maximal sensitivity to blue light compared to other wavelengths [45,56] a similar result was previously suggested in a study in sighted healthy young volunteers in which prior light history was manipulated to affect mRGC sensitivity [40], and in 3 totally blind subjects due to outer retinal disorders, with no conscious vision but retained NIF photoreception [45].
Finally, despite brain response modulations by blue light in LHON, we did not find an effect of light on behavioural performances. This is not unexpected, given that, as in previous studies in healthy subjects [56], we were careful at keeping task blocks short to avoid any behav-ioural effects that could contaminate the results. Both patients and controls are cognitively intact, and our light stimulation scheme included short exposures to light (<1 min), which differs markedly from what is described for other investigation meant to trigger improvements in cognitive performance, i.e. hour long exposures, sometimes repeated over a week [37].
To our knowledge, the present study is the first to explore and demonstrate the visually-evoked brain activity in LHON, an inherited optic neuropathy that is characterized by a selective relative sparing of the mRGC system. Even if melanopsin contribution was not uniquely isolated, these results are suggestive of a possible role of mRGCs in modulating the occipital cortex response in LHON patients, even when the brain is not engaged in a cognitive challenge, and the prefrontal cortex when engaged in a cognitive process. This early experiment will hopefully pave the way to further studies, more selectively stimulating melanopsin in LHON, as it provides an unparalleled paradigm of study given RGCs selective degeneration, and to the opening of potential windows for therapy in these patients.
CRediT authorship contribution statement
Stefania Evangelisti: Conceptualization, Investigation, Formal
analysis, Software, Writing - original draft. Chiara La Morgia: Conceptualization, Investigation, Resources, Writing - original draft. Claudia Testa: Conceptualization, Investigation, Formal analysis, Writing - original draft. David N. Manners: Investigation. Leonardo Brizi: Investigation. Claudio Bianchini: Investigation. Michele Car-bonelli: Investigation. Piero Barboni: Investigation. Alfredo A. Sadun: Conceptualization. Caterina Tonon: Conceptualization. Valerio Care-lli: Conceptualization, Resources, Supervision. Gilles Vandewalle: Conceptualization, Supervision. Raffaele Lodi: Conceptualization, Re-sources, Supervision.
Acknowledgments
We thank Fondazione del Monte di Bologna e Ravenna for the financial support. GV is supported by the Fonds National de la Recher-che Scientifique (FNRS-Belgium). These funding agencies had no role in study design, in the collection, analysis and interpretation of data, in the writing of the report and in the decision to submit the article for publication.
Declarations of Competing Interest
Dr. La Morgia reports personal fees from Santhera Pharmaceuticals, Regulatory Pharmanet and Chiesi Farmaceutici, grants from Italian Ministry of Health Grant- GR-2013-02358026 “Melanopsin retinal ganglion cells and circadian rhythms: function and dysfunction in Alz-heimer’s disease and aging” (PI), grants from Italian Ministry of Health Grant-GR-2016-02361449 “Italian Project on Hereditary Optic Nero-pathies (IPHON): from genetic basis to therapy” (Co-PI), outside the submitted work.
Dr. Carbonelli reports personal fees from Santhera Pharmaceuticals, outside the submitted work.
Dr. Barboni reports personal fees from Santhera Pharmaceuticals, personal fees from Omikron pharma, outside the submitted work.
Dr. Sadun reports grants from Stealth Biopeptides - LHON Clinical Trial, grants from GenSight - LHON Clinical Trial, outside the submitted work.
Prof. Carelli reports personal fees from Santhera Pharmaceuticals, Table 5
Cluster data for group-level results for responses to 3-back task compared to the control condition (0-back) irrespective of light condition. Coordinates of the most significant voxel within each cluster are reported, in standard MNI space; brain areas are referred to the Harvard-Oxford Cortical and Subcortical Structural Atlases. None of the reported results were correlated to ophthalmological data, namely visual acuity, visual fields and retinal nerve fiber layer thickness. (LHON: Leber’s hereditary optic neuropathy; HC: healthy controls; l: left; r: right.)
Volume (mm3) p-value Coordinates (mm) Area (side)
x y z
HC 51016 1.00E-03 −30 − 4 56 Middle frontal gyrus (l)
11512 4.00E-03 −42 − 42 40 Supramarginal Gyrus (l)
7408 1.40E-02 −14 − 10 18 Caudate (l)
1256 1.20E-02 32 − 68 −26 Cerebellum (Right Crus I)
568 3.20E-02 32 26 8 Frontal Operculum (r)
464 3.30E-02 14 − 68 60 Lateral Occipital Cortex (r)
392 4.20E-02 −64 − 42 12 Supramarginal Gyrus (l)
376 4.10E-02 −58 − 48 34 Supramarginal Gyrus (l)
304 3.40E-02 −48 − 44 0 Middle Temporal Gyrus (l)
168 3.90E-02 30 − 70 −48 Cerebellum (Right VIIb)
128 4.60E-02 8 − 78 −18 Lingual Gyrus (l)
80 4.70E-02 48 − 34 48 Supramarginal Gyrus (r)
LHON 71336 3.00E-03 42 0 34 Precentral Gyrus (r)
8168 9.00E-03 34 − 66 46 Lateral Occipital Cortex (r)
7504 6.00E-03 −38 − 52 38 Angular Gyrus (l)
5936 5.00E-03 36 26 0 Frontal Orbital Cortex (r)
344 3.00E-02 10 − 82 −26 Occipital Fusiform Gyrus (r)
176 4.90E-02 −32 52 6 Frontal Pole (l)
112 4.80E-02 −26 66 8 Frontal Pole (l)
80 3.80E-02 30 − 66 −28 Cerebellum (Right Crus I)
LHON > HC no significant voxels LHON < HC no significant voxels
grants from Stealth BioTherapeutics, personal fees from GenSight Bi-ologics, grants from Italian Ministry of Health, RF-2018-12366703, “REtinal ganglion cells and ORganoids from Inherited Optic Neuropa-thies: light on pathogenesis to fight blindness (REORION Project)” (PI), grants from Italian Ministry of University and Research, 20172T2MHH, “Keeping mitochondrial DNA in shape in health and disease: cracking the elusive relationship between the fusion protein OPA1 and mtDNA maintenance in membrane-anchored nucleoids” (PI), outside the sub-mitted work.
Dr. Evangelisti, Dr. Testa, Dr. Bianchini, Dr. Manners, Dr. Brizi, Prof. Tonon, Dr. Vandewalle and Prof. Lodi report no disclosures.
References
[1] B. Mascialino, M. Leinonen, T. Meier, Meta-analysis of the prevalence of Leber hereditary optic neuropathy mtDNA mutations in Europe, Eur. J. Ophthalmol. 22 (3) (2012) 461–465, https://doi.org/10.5301/ejo.5000055.
[2] V. Carelli, F.N. Ross-Cisneros, A.A. Sadun, Mitochondrial dysfunction as a cause of optic neuropathies, Prog. Retinal Eye Res. 23 (1) (2004) 53–89, https://doi.org/ 10.1016/j.preteyeres.2003.10.003.
[3] G. Rizzo, K.R. Tozer, C. Tonon, D. Manners, C. Testa, E. Malucelli, M.L. Valentino, C. La Morgia, P. Barboni, R.S. Randhawa, F.N. Ross-Cisneros, A.A. Sadun, V. Carelli, R. Lodi, F. Paul, Secondary post-geniculate involvement in leber’s hereditary optic neuropathy, PLoS One 7 (11) (2012) e50230, https://doi.org/ 10.1371/journal.pone.0050230.
[4] D.N. Manners, G. Rizzo, C. La Morgia, C. Tonon, C. Testa, P. Barboni, E. Malucelli, M.L. Valentino, L. Caporali, D. Strobbe, V. Carelli, R. Lodi, Diffusion tensor imaging mapping of brain white matter pathology in mitochondrial optic neuropathies, Am. J. Neuroradiol. 36 (7) (2015) 1259–1265, https://doi.org/10.3174/ajnr.A4272. [5] V. Barcella, M.A. Rocca, S. Bianchi-Marzoli, J. Milesi, L. Melzi, A. Falini, L. Pierro,
M. Filippi, Evidence for retrochiasmatic tissue loss in Leber’s hereditary optic neuropathy, Hum. Brain Mapp. 31 (12) (2010) 1900–1906, https://doi.org/ 10.1002/hbm.20985.
[6] M.A. Rocca, P. Valsasina, E. Pagani, S. Bianchi-Marzoli, J. Milesi, A. Falini, G. Comi, M. Filippi, Y.i. Wang, Extra-visual functional and structural connection abnormalities in leber’s hereditary optic neuropathy, PLoS One 6 (2) (2011) e17081, https://doi.org/10.1371/journal.pone.0017081.t002.
[7] V. Vacchiano, C. Tonon, M. Mitolo, S. Evangelisti, M. Carbonelli, R. Liguori, R. Lodi, V. Carelli, C. La Morgia, Functional MRI study in a case of Charles Bonnet syndrome related to LHON, BMC Neurol. 19 (1) (2019) 350, https://doi.org/ 10.1186/s12883-019-1579-9.
[8] C. La Morgia, F.N. Ross-Cisneros, A.A. Sadun, J. Hannibal, A. Munarini, V. Mantovani, P. Barboni, G. Cantalupo, K.R. Tozer, E. Sancisi, S.R. Salomao, M. N. Moraes, M.N. Moraes-Filho, S. Heegaard, D. Milea, P. Kjer, P. Montagna, V. Carelli, Melanopsin retinal ganglion cells are resistant to neurodegeneration in mitochondrial optic neuropathies, Brain 133 (8) (2010) 2426–2438, https://doi. org/10.1093/brain/awq155.
[9] A. Kawasaki, K. Herbst, B. Sander, D. Milea, Selective wavelength pupillometry in Leber hereditary optic neuropathy, Clin. Exp. Ophthalmol. 38 (3) (2010) 322–324,
https://doi.org/10.1111/j.1442-9071.2010.02212.x.
[10] A.L. Moura, B.V. Nagy, C. La Morgia, P. Barboni, A.G. Oliveira, S.R. Salom˜ao, A. Berezovsky, M.N. de Moraes-Filho, C.F. Chicani, R. Belfort Jr, V. Carelli, A. A. Sadun, D.C. Hood, D.F. Ventura, The pupil light reflex in Leber’s hereditary optic neuropathy: evidence for preservation of melanopsin-expressing retinal ganglion cells, Invest. Ophthalmol. Vis. Sci. 54 (7) (2013) 4471–4477, https://doi. org/10.1167/iovs.12-11137.
[11] M. Münch, L. L´eon, S. Collomb, A. Kawasaki, Comparison of acute non-visual bright light responses in patients with optic nerve disease, glaucoma and healthy controls, Sci. Rep. 19 (5) (2015) 15185, https://doi.org/10.1038/srep15185. [12] I. Pˇríhodov´a, J. Nepoˇzitek, S. Kelifov´a, S. Dost´alov´a, D. Kemlink, K. ˇSonka,
M. Tesaˇrov´a, T. Honzík, H. Kol´aˇrov´a, Subjective and polysomnographic evaluation of sleep in mitochondrial optic neuropathies, J. Sleep Res. (2020) e13051, https:// doi.org/10.1111/jsr.13051.
[13] D.M. Berson, F.A. Dunn, M. Takao, Phototransduction by retinal ganglion cells that set the circadian clock, Science (New York, N.Y.) 295 (5557) (2002) 1070–1073,
https://doi.org/10.1126/science.1067262.
[14] S. Hattar, H.W. Liao, M. Takao, D.M. Berson, K.W. Yau, Melanopsin-containing retinal ganglion cells: architecture, projections, and intrinsic photosensitivity, Science 295 (5557) (2002) 1065–1070, https://doi.org/10.1126/science.1069609. [15] J. Hannibal, L. Kankipati, C.E. Strang, B.B. Peterson, D. Dacey, P.D. Gamlin,
Central projections of intrinsically photosensitive retinal ganglion cells in the macaque monkey: central projections of intrinsically photosensitive RGCs in macaque, J. Comp. Neurol. 522 (10) (2014), https://doi.org/10.1002/cne.23588. Spc1-Spc1.
[16] J. Hannibal, A.T. Christiansen, S. Heegaard, J. Fahrenkrug, J.F. Kiilgaard, Melanopsin expressing human retinal ganglion cells: subtypes, distribution, and intraretinal connectivity, J. Comp. Neurol. 525 (8) (2017) 1934–1961, https://doi. org/10.1002/cne.24181.
[17] J.J. Gooley, I. Ho Mien, M.A. St. Hilaire, S.-C. Yeo, E.- C.-P. Chua, E. van Reen, C. J. Hanley, J.T. Hull, C.A. Czeisler, S.W. Lockley, Melanopsin and rod-cone photoreceptors play different roles in mediating pupillary light responses during
exposure to continuous light in humans, J. Neurosci. 32 (41) (2012) 14242–14253,
https://doi.org/10.1523/JNEUROSCI.1321-12.2012.
[18] A. Sand, T.M. Schmidt, P. Kofuji, Diverse types of ganglion cell photoreceptors in the mammalian retina, Prog. Retinal Eye Res. 31 (4) (2012) 287–302, https://doi. org/10.1016/j.preteyeres.2012.03.003.
[19] G. Gaggioni, P. Maquet, C. Schmidt, D.J. Dijk, G. Vandewalle, Neuroimaging, cognition, light and circadian rhythms, Front. Syst. Neurosci. 8 (2014) 126,
https://doi.org/10.3389/fnsys.2014.00126.
[20] M.L. Aranda, T.M. Schmidt, Diversity of intrinsically photosensitive retinal ganglion cells: circuits and functions, Cell. Mol. Life Sci. (2020).
[21] D.M. Dacey, H.-W. Liao, B.B. Peterson, F.R. Robinson, V.C. Smith, J. Pokorny, K.- W. Yau, P.D. Gamlin, Melanopsin-expressing ganglion cells in primate retina signal colour and irradiance and project to the LGN, Nature 433 (7027) (2005) 749–754,
https://doi.org/10.1038/nature03387.
[22] M.W. Hankins, S.N. Peirson, R.G. Foster, Melanopsin: an exciting photopigment, Trends Neurosci. 31 (1) (2008) 27–36, https://doi.org/10.1016/j.
tins.2007.11.002.
[23] L.S. Mure, F. Vinberg, A. Hanneken, S. Panda, Functional diversity of human intrinsically photosensitive retinal ganglion cells, Science 366 (6470) (2019) 1251–1255, https://doi.org/10.1126/science:aaz0898.
[24] J.L. Ecker, O.N. Dumitrescu, K.Y. Wong, N.M. Alam, S.-K. Chen, T. LeGates, J. M. Renna, G.T. Prusky, D.M. Berson, S. Hattar, Melanopsin-expressing retinal ganglion-cell photoreceptors: cellular diversity and role in pattern vision, Neuron 67 (1) (2010) 49–60, https://doi.org/10.1016/j.neuron.2010.05.023.
[25] T. Brown, S.-I. Tsujimura, A. Allen, J. Wynne, R. Bedford, G. Vickery, A. Vugler, R. Lucas, Melanopsin-based brightness discrimination in mice and humans, Curr. Biol. 22 (12) (2012) 1134–1141, https://doi.org/10.1016/j.cub.2012.04.039. [26] C.A. Procyk, C.G. Eleftheriou, R. Storchi, A.E. Allen, N. Milosavljevic, T.M. Brown,
R.J. Lucas, Spatial receptive fields in the retina and dorsal lateral geniculate nucleus of mice lacking rods and cones, J. Neurophysiol. 114 (2) (2015) 1321–1330, https://doi.org/10.1152/jn.00368.2015.
[27] N. Milosavljevic, A.E. Allen, J. Cehajic-Kapetanovic, R.J. Lucas, Chemogenetic activation of ipRGCs drives changes in dark-adapted (Scotopic) electroretinogram, Invest. Ophthalmol. Vis. Sci. 57 (14) (2016) 6305–6312, https://doi.org/10.1167/ iovs.16-20448.
[28] R.J. Lucas, A.E. Allen, N. Milosavljevic, R. Storchi, T. Woelders, Can we see with melanopsin? Annu. Rev. Vis. Sci. 6 (1) (2020) 453–468, https://doi.org/10.1146/ annurev-vision-030320-041239.
[29] A. Allen, R. Storchi, F. Martial, R. Petersen, M. Montemurro, T. Brown, R. Lucas, Melanopsin-driven light adaptation in mouse vision, Curr. Biol. 24 (21) (2014) 2481–2490, https://doi.org/10.1016/j.cub.2014.09.015.
[30] A.E. Allen, R. Storchi, F.P. Martial, R.A. Bedford, R.J. Lucas, Melanopsin contributions to the representation of images in the early visual system, Curr. Biol. 27 (11) (2017) 1623–1632.e4, https://doi.org/10.1016/j.cub.2017.04.046. [31] A.E. Allen, F.P. Martial, R.J. Lucas, Form vision from melanopsin in humans, Nat.
Commun. 10 (1) (2019) 2274, https://doi.org/10.1038/s41467-019-10113-3. [32] S. Hattar, M. Kumar, A. Park, P. Tong, J. Tung, K.-W. Yau, D.M. Berson, Central
projections of melanopsin-expressing retinal ganglion cells in the mouse, J. Comp. Neurol. 497 (3) (2006) 326–349, https://doi.org/10.1002/cne.20970.
[33] K.E. Davis, C.G. Eleftheriou, A.E. Allen, C.A. Procyk, R.J. Lucas, S.G. Solomon, Melanopsin-derived visual responses under light adapted conditions in the mouse dLGN, PLoS One 10 (3) (2015) e0123424, https://doi.org/10.1371/journal. pone.0123424.g007.
[34] C.A. Procyk, A.E. Allen, F.P. Martial, R.J. Lucas, Visual responses in the dorsal lateral geniculate nucleus at early stages of retinal degeneration in rd1 PDE6β mice, J. Neurophysiol. 122 (4) (2019) 1753–1764, https://doi.org/10.1152/ jn.00231.2019.
[35] R. Storchi, R.A. Bedford, F.P. Martial, A.E. Allen, J. Wynne, M.A. Montemurro, R. S. Petersen, R.J. Lucas, Modulation of fast narrowband oscillations in the mouse retina and dLGN according to background light intensity, Neuron 93 (2) (2017) 299–307, https://doi.org/10.1016/j.neuron.2016.12.027. PMID: 28103478. [36] G. Vandewalle, P. Maquet, D.-J. Dijk, Light as a modulator of cognitive brain
function, Trends Cognit. Sci. 13 (10) (2009) 429–438, https://doi.org/10.1016/j. tics.2009.07.004.
[37] M. Mitolo, C. Tonon, C. La Morgia, C. Testa, V. Carelli, R. Lodi, Effects of light treatment on sleep, cognition, mood, and behavior in Alzheimer’s disease: a systematic review, Dement. Geriatr. Cogn. Disord. 46 (5-6) (2019) 371–384,
https://doi.org/10.1159/000494921.
[38] S.-M. Hung, D. Milea, A.V. Rukmini, R.P. Najjar, J.H. Tan, F. Vi´enot, M. Dubail, S.L. C. Tow, T. Aung, J.J. Gooley, P.-J. Hsieh, Cerebral neural correlates of differential melanopic photic stimulation in humans, NeuroImage 146 (2017) 763–769,
https://doi.org/10.1016/j.neuroimage.2016.09.061.
[39] E.M. McGlashan, G.R. Poudel, P. Vidafar, S.P.A. Drummond, S.W. Cain, Imaging individual differences in the response of the human suprachiasmatic area to light, Front. Neurol. 9 (2018), https://doi.org/10.3389/fneur.2018.01022.s001. [40] S.L. Chellappa, J.Q.M. Ly, C. Meyer, E. Balteau, C. Degueldre, A. Luxen, C. Phillips,
H.M. Cooper, G. Vandewalle, Photic memory for executive brain responses, Proc. Natl. Acad. Sci. 111 (16) (2014) 6087–6091, https://doi.org/10.1073/ pnas.1320005111.
[41] A.D. Güler, J.L. Ecker, G.S. Lall, S. Haq, C.M. Altimus, H.-W. Liao, A.R. Barnard, H. Cahill, T.C. Badea, H. Zhao, M.W. Hankins, D.M. Berson, R.J. Lucas, K.-W. Yau, S. Hattar, Melanopsin cells are the principal conduits for rod–cone input to non- image-forming vision, Nature 453 (7191) (2008) 102–105, https://doi.org/ 10.1038/nature06829.
[42] C.A. Czeisler, T.L. Shanahan, E.B. Klerman, H. Martens, D.J. Brotman, J.S. Emens, T. Klein, J.F. Rizzo 3rd, Suppression of melatonin secretion in some blind patients