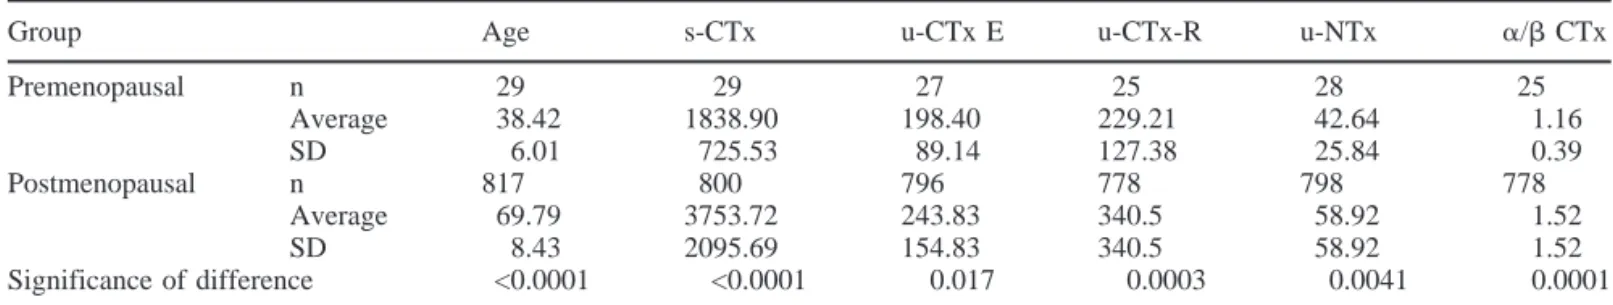
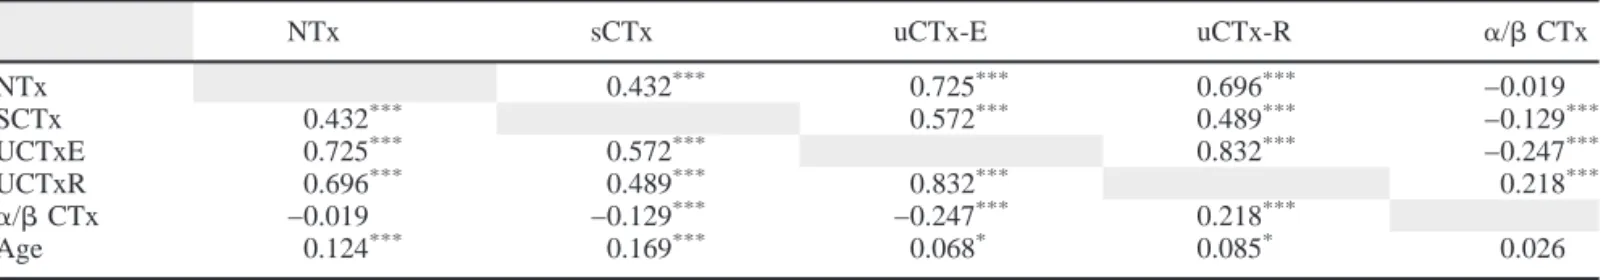
Bone resorption in post-menopausal women with normal and low BMD assessed with biochemical markers specific for telopeptide derived degradation products of collagen type I
Texte intégral
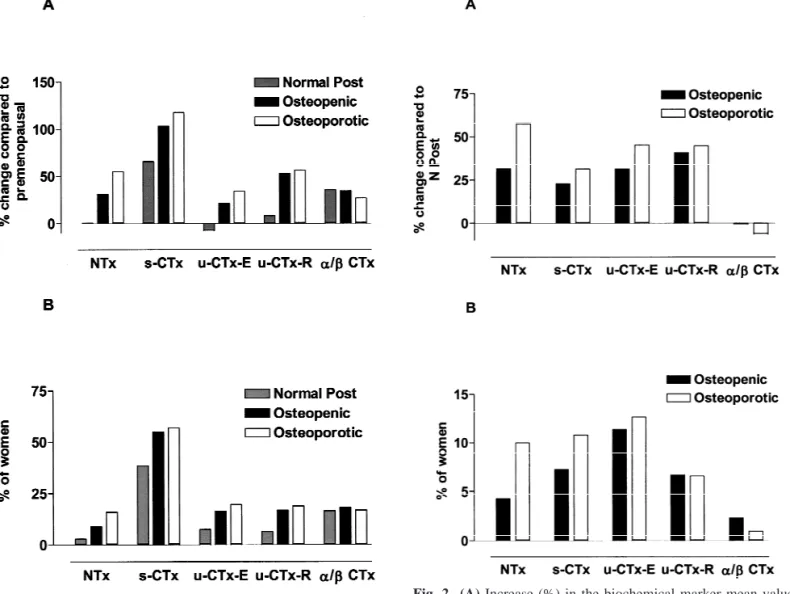
Figure
Documents relatifs
The advanced glycation end- product Nϵ -carboxymethyllysine promotes progression of pancreatic cancer: implications for diabetes- associated risk and its prevention: AGEs as
Sensitivity analyses were used to examine (a) effects of the violation of the assumption of independence by using one effect size per study (highest and low- est); (b)
ABSTRACT: The structure of the bacterial population (free vs. attached bacteria), variations in bac- terial abundance and ciliate group composition were monitored as a function
contraste avec la popularité de ces spectacles. Il est sans doute lié au statut social d’artistes en marge de la communauté civique, prêts à mettre en danger leur vie à
Improvement of tensile shear strength and wood failure percentage of 1C PUR bonded wooden joints at wet stage by means of DMF priming.. Oliver Kla¨usler • Philipp Hass • Carlos
As hemolytic blood specimen are the most common reason for sample rejection and analyses repetition, a reduction in hemolysis rates should be one of the top goals of a laboratory
Les missions locales interviennent déjà dans la recherche des contrats d’apprentissage, mais le programme expérimental a très fortement accru le nombre de jeunes ayant bénéfi
DIKENOU Christophe, Professeur Titulaire, Ethique, UL (Togo) NIAMKEY Koffi, Professeur Titulaire, Philosophie africaine, Université Cocody (Côte d’Ivoire).. NZINZI
