Clin Chem Lab Med 2015; 53(11): e285–e288
*Corresponding author: Janne Cadamuro, Universitätsinstitut für Medizinisch-Chemische Labordiagnostik, Gemeinnützige Salzburger Landeskliniken Betriebsges.m.b.H., Müllner Hauptstrasse 48, 5020 Salzburg, Austria,
Phone: +43 662 4482 57263, Fax: +43 0662 4482 885, E-mail: [email protected]; and Department of Laboratory Medicine, Paracelsus Medical University, Salzburg, Austria Helmut Wiedemann, Cornelia Mrazek, Thomas Klaus Felder, Hannes Oberkofler and Elisabeth Haschke-Becher: Department of Laboratory Medicine, Paracelsus Medical University, Salzburg, Austria
Georg Martin Fiedler: Center of Laboratory Medicine, Inselspital, University Hospital Bern, Bern, Switzerland
Letter to the Editor
Janne Cadamuro*, Helmut Wiedemann, Cornelia Mrazek, Thomas Klaus Felder, Hannes
Oberkofler, Georg Martin Fiedler and Elisabeth Haschke-Becher
The economic burden of hemolysis
DOI 10.1515/cclm-2015-0363Received April 17, 2015; accepted April 22, 2015; previously published online June 2, 2015
Keywords: economic; hemolysis; preanalytic. To the Editor,
The goal of healthcare systems is to provide the optimal treatment to the patient. However, an exact diagnosis is the prerequisite for an effective treatment. It was esti-mated that 70%–80% of all healthcare decisions that influence the clinical decision making involve one or more laboratory investigations, with individual’s treat-ment decisions and the monitoring of their response to treatment, often dependent on laboratory-based diag-nostics [1]. However, as financial resources are limited, economic issues must be considered, in order to achieve best value for the patient, making our healthcare system as efficient as possible and fundable for future gen-erations. A reduction of errors during the laboratory process is one way to reduce costs, since these errors might not only lead to possibly harmful consequences for the patient, but also causes repeated specimen col-lection and analyses, thus resulting in an unjustifiable increase in costs. It is well documented, that within the total laboratory process, errors most frequently occur in the extranalytical phase with the vast majority within
preanalytical processes [2]. Hemolytic blood specimen are the foremost preanalytic cause of sample rejec-tion, which, according to a survey of 453 laboratories, occurs five times more frequently than the second most cited reason, insufficient specimen quantity to perform the requested test [3]. We therefore tried to investigate the economic impact of hemolysis to our budget and screened current literature for respective calculations, aiming to perform similar calculations with our own data. However, to the best of our knowledge, accord-ing calculations are rare [4, 5]. We therefore aimed to quantify the consequential costs of hemolytic blood specimen, and to properly illustrate the financial conse-quences of a change in hemolysis rates. We calculated in a way, so that further investigators are able to apply our findings to their own setting.
We divided these expenses into material, person-nel and analytical costs. As blood collection can be per-formed by needle, butterfly system or IV catheter, three variants of material costs were calculated, always includ-ing one tube holder and two collection tubes. To calcu-late personnel costs, we estimated the time needed for a blood collection, including all steps from test ordering to preparation for transportation. As blood collection in our hospital is performed by the nursing staff, a mean of the respective hourly wages was used for calculation [6]. Analytical costs were calculated using the two most commonly used scales of charges of medical labora-tory analyses in Germany [7, 8]. These sums reflect the chargeable prize and not just the laboratory costs of the specific parameter. However, we chose to use these numbers, since laboratory costs depend on reagent prize, personnel costs and costs for the analytical device, all of which varying substantially between laboratories. As also the chargeable amounts in the official two scales differ from each other, we calculated costs and hypothetical cost reductions for both, displaying them as a respective range of costs. As harmonization in hemolysis measure-ment as well as respective cut-off values are still missing, we chose to refer to the hemolysis index (HI), which is measured by the COBAS analyzers (Roche, Switzerland), with a HI of 1 being equal to a concentration of 1 mg/dL
Brought to you by | Universitaetsbibliothek Basel Authenticated Download Date | 4/29/19 4:24 PM
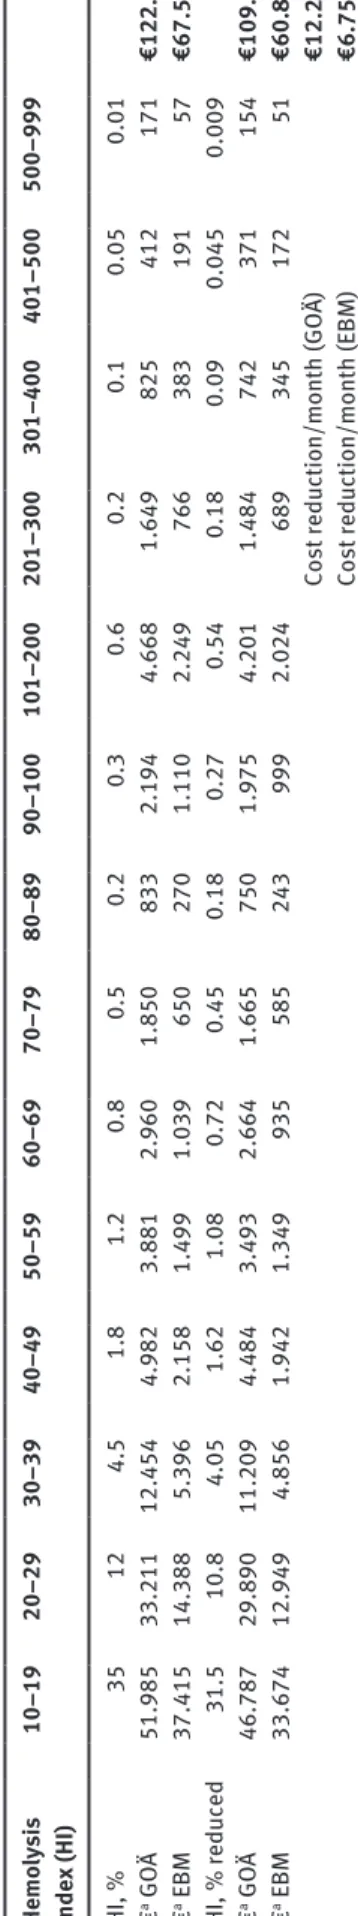
e286 Cadamuro et al.: The economic burden of hemolysis of free hemoglobin [9, 10]. As HI cut-off for each param-eter measureable on these analyzers, we used the official documents and packaging inserts of the manufacturer. These cut-offs define a HI value for each analyte, which corresponds to the point where the test analyte differs by more than 10% from the respective baseline. In order for the reader of this article to apply our findings to their own setting and to be able to calculate the economic impact of hemolysis reduction within their hospital, we refrained from hemolysis categories like mild, intermediate and severe. We rather grouped hemolysis into 16 HI ranges, and calculated the respective analysis costs (Table 1). To estimate overall costs of hemolysis in a clinical setting, we additionally set up a hypothetical situation. In this setting, which approximately reflects the situation in a common hospital, we assumed 20,000 laboratory orders monthly where blood collection is performed by the nursing staff using a butterfly system. Hemolysis rates were estimated as realistic as possible. Also, we simu-lated a 10% reduction of hemolysis within this setting, to be able to estimate the financial benefit of efforts towards this goal (Table 2).
Material costs for blood collection using a needle, a butterfly system or an IV catheter were €0.19, €0.35 and €0.76, respectively. Personnel costs for a nurse spending estimated 10 min on average on one blood collection were €4.75. Analyses costs for the different hemolysis groups rise with increasing HI, since more parameters get affected (Table 1). When applying hypothetical percentages for each hemolysis group, the financial burden would range from €67,570 to €122,077, depending on the scale of charge in use. After applying additional percentages, illustrating an assumed reduction of 10% in hemolysis rates, the cost reduction ranges accordingly from €6757 to €12,208 per month (Table 2). These calculations presume that every parameter listed in the respective HI group in Table 1 was measured in every laboratory order and therefore had to be reanalyzed. In a clinical setting this rarely would be the case and therefore the overall costs would diminish respectively.
As hemolytic blood specimen are the most common reason for sample rejection and analyses repetition, a reduction in hemolysis rates should be one of the top goals of a laboratory to be able to provide the highest possible quality in analytics and to prevent possible harm to the patient due to inappropriate further inves-tigations or even wrong treatment. Despite the quality issue, the outcome of our work impressively elucidates the financial impact of this economically underrated issue and reveals a possibility of cost saving to the healthcare system.
Jacobs et al. estimated monthly analytical costs of £4355 (∼€6000) due to repeated measurements of hemo-lytic specimen, based on 60 emergency admissions per day, not taking material or personnel costs into account [4]. Lippi et al. calculated overall material and person-nel costs of €19,535 for 38,009 samples which had to be recollected due to hemolysis over a 12-month period, accounting for 22.8% of all samples collected in this time [5]. When trying to project these numbers on our hypo-thetical setting of 20,000 orders per month, monthly analytical costs of Jacobs et al. are approximately €66,667, whereas material and personnel costs by the work of Lippi et al. sum up to €2348 per month. Sepa-rately calculating costs in our own study yielded €58,348 for material and personnel, and a range from €9223 to €63,729 for analytical costs. This demonstrates clearly, that the financial impact of hemolysis is highly depend-ent on the respective setting and the extdepend-ent of hemolyis. We hope that our work can serve as basis for calculation of consequential costs due to hemolytic specimen in dif-ferent settings.
As limitation to this work, it should be mentioned, that we focused on frequently ordered analytes in clini-cal chemistry. Analytes from other laboratory special-ties, which are also influenced by hemolysis, such as coagulation parameters, were not taken into account, as we had no defined HI cut-off levels [11]. Also, as described above, the analytic costs used in our setting reflect the chargeable prize, rather than sole labora-tory costs. Additionally, our calculations might not be adaptable to settings using different analytical meas-urements and estimations of hemolysis, apart from the one described above, as there is no harmonization between these measurements yet [9]. Also the analyti-cal interference of hemolysis differs between the tests and reagents in use. Finally, we only calculated primary costs of hemolysis. Secondary costs have to be consid-ered, but are very hard to put in numbers. Such costs could be caused by prolonged time to diagnosis and subsequent delayed treatment onset with a respectively extended hospital stay or by further inappropriate investigations.
In conclusion, the financial importance of hemolysis has been demonstrated. To further reduce hemolysis on a larger scale, harmonization of hemolysis measurements and defined HI cut-offs are desperately needed. One first approach to compare hemolysis rates all over the world could be the quality indicators project of the IFCC Working Group “Laboratory Errors and Patient Safety” [12, 13]. We want to urge each laboratory to measure hemolysis as a quality indicator and to further depict how a respective
Brought to you by | Universitaetsbibliothek Basel Authenticated Download Date | 4/29/19 4:24 PM
Cadamuro et al.: The economic burden of hemolysis e287 Tab le 1: An alytic al costs of hemo lysis. Par ameter HI c ut -off a HI gro up 10–19 20–29 30–39 40–49 50–59 60–69 70–79 80–89 90–100 101–200 201–300 301–400 401–500 500–999 Lact ate deh ydrogen ase 10 * * * * * * * * * * * * * * Asp ar tate aminot ransfer ase 25 * * * * * * * * * * * * * Bi lirub in (direct) 25 * * * * * * * * * * * * * Bi lirub in (tot al) 50 * * * * * * * * * * Al anine aminot ransfer ase 60 * * * * * * * * * Iron 80 * * * * * * * Pot assiu m 100 * * * * * * Cre atine k in ase 100 * * * * * * Hs-Troponin T 100 * * * * * * g-Glut am yl transfer ase 200 * * * * * Phosphorus 300 * * * * M agnesiu m 400 * Alk aline phosph at ase 500 * Am yl ase 500 * Ferr itin 500 * Lip ase 500 * Tr iglycer ide 500 * Tot al Protein 650 * Cho lester in 700 * Cre atinine ( Jaffé) 750 * Cho linester ase 850 * Glucose 850 * CRP 950 * An
alysis costs (GO
Ä) 2.33 8.74 8.74 8.74 11.07 13.41 13.41 15.74 31.48 33.81 36.14 36.14 36.14 80.44 An
alysis costs (EBM)
0.25 0.90 0.90 0.90 1.15 1.40 1.40 1.65 13.40 3.65 14.05 14.05 14.05 23.50 *Affected b y hemo lysis; aHI c ut -off at
which the respective p
ar ameter is a ltered b y more th an 10% comp ared to b aseline. GO Ä and EBM are sc ales of ch
arge for Germ
an y – GO Ä, Geb ührenordnu ng fü r Är
zte [7]; EBM, Einheitlicher Bewer
tu
ngsm
aßst
ab [8].
Brought to you by | Universitaetsbibliothek Basel Authenticated Download Date | 4/29/19 4:24 PM
e288 Cadamuro et al.: The economic burden of hemolysis Tab le 2: Hypothetic al model for estim ation of the fin anc ia l imp act of hemo lysis. He m ol ysis inde x (HI) 10–19 20–29 30–39 40–49 50–59 60–69 70–79 80–89 90–100 101–200 201–300 301–400 401–500 500–999 HI, % 35 12 4.5 1.8 1.2 0.8 0.5 0.2 0.3 0.6 0.2 0.1 0.05 0.01 € a G OÄ 51.985 33.211 12.454 4.982 3.881 2.960 1.850 833 2.194 4.668 1.649 825 412 171 €122.077 € a EBM 37.415 14.388 5.396 2.158 1.499 1.039 650 270 1.110 2.249 766 383 191 57 €67.570 HI, % reduced 31.5 10.8 4.05 1.62 1.08 0.72 0.45 0.18 0.27 0.54 0.18 0.09 0.045 0.009 € a G OÄ 46.787 29.890 11.209 4.484 3.493 2.664 1.665 750 1.975 4.201 1.484 742 371 154 €109.869 € a EBM 33.674 12.949 4.856 1.942 1.349 935 585 243 999 2.024 689 345 172 51 €60.813 Cost reduction/month (GO Ä) €12.208 Cost reduction/month (EBM) €6.757 aHypothetic al amo unt , c alc ul ated w
ith 20,000 orders per month; b
lood co llection b y nu rsing st aff using a b utter fly
system. HI, Hemo
lysis inde x. GO Ä and EBM are sc ales of ch
arge for Germ
an y – GO Ä, Geb ührenordnu ng f ür Är
zte [7]; EBM, Einheitlicher Bewer
tu
ngsm
aßst
ab [8].
reduction of hemolysis rates would contribute not only to their quality improvement, but also to their economic situation.
Author contributions: All the authors have accepted responsibility for the entire content of this submitted manuscript and approved submission.
Financial support: None declared.
Employment or leadership: None declared. Honorarium: None declared.
Competing interests: The funding organization(s) played no role in the study design; in the collection, analysis, and interpretation of data; in the writing of the report; or in the decision to submit the report for publication.
References
1. Plebani M, Lippi G. Is laboratory medicine a dying profession? Blessed are those who have not seen and yet have believed. Clin Biochem 2010;43:939–41.
2. Lippi G, Blanckaert N, Bonini P, Green S, Kitchen S, Palicka V, et al. Haemolysis: an overview of the leading cause of unsuitable specimens in clinical laboratories. Clin Chem Lab Med 2008;46:764–72.
3. Jones BA, Calam RR, Howanitz PJ. Chemistry specimen acceptability: a College of American Pathologists q-probes study of 453 laboratories. Arch Pathol Lab Med 1997;121:19–26. 4. Jacobs P, Costello J, Beckles M. Cost of haemolysis. Ann Clin
Biochem 2012;49:412.
5. Lippi G, Bonelli P, Cervellin G. Prevalence and cost of hemolyzed samples in a large urban emergency department. Int J Lab Hematol 2014;36:e24–6.
6. Direkte und indirekte Arbeitskosten sowie Leistungslohn und Lohnnebenkosten (ohne Lehrlinge und sonstige Auszubildende) 2012 nach ÖNACE 2008. Vol. 1. Vienna: Statistik Austria, 2012. 7. Lang M, Schäfer F, Stiel H, Vogt W. Laboratoriumsuntersuchungen.
Der GOÄ-Kommentar, Vol. 2. Stuttgart: Georg Thieme Verlag, 2002.
8. Kassenärztliche Bundesvereinigung. Einheitlicher bewertungs-maßstab (EBM). http://www.kbv.de/html/online-ebm.php. Accessed 8 April, 2015.
9. Dolci A, Panteghini M. Harmonization of automated hemolysis index assessment and use: is it possible? Clin Chim Acta 2014;432:38–43.
10. Unger J, Filippi G, Patsch W. Measurements of free hemoglobin and hemolysis index: EDTA- or lithium-heparinate plasma? Clin Chem 2007;53:1717–8.
11. Lippi G, Montagnana M, Salvagno GL, Guidi GC. Interference of blood cell lysis on routine coagulation testing. Arch Pathol Lab Med 2006;130:181–4.
12. WG-LEPS I. Quality indicators project. Available from: http:// www.ifcc-mqi.com. Accessed 8 April, 2015.
13. Plebani M, Sciacovelli L, Aita A, Chiozza ML. Harmonization of pre-analytical quality indicators. Biochem Med (Zagreb) 2014;24:105–13.
Brought to you by | Universitaetsbibliothek Basel Authenticated Download Date | 4/29/19 4:24 PM