A Meta-Analysis of the Effectiveness of
Cognitive-Behavioural Therapies for Late-Life Depression
Une méta-analyse de l’efficacité des thérapies
cognitivo-comportementales dans le traitement de la dépression
chez les personnes âgées
William J. Thomas
1,3Alexander O. Hauson
1,2,3Jessica E. Lambert
1,4Mark J. Stern
1,3Julia M. Gamboa
1,3Kenneth E. Allen
1,3Rick A. Stephan
1,3Christine L. Kimmel
1,3Scott C. Wollman
1,3Matthew G. Hall
1,3Benjamin L. Towns
1Celina Sari
1,3Bijan Sharghi
1Heather Newton
11California School of Professional Psychology 2University of California San Diego
3Institute of Brain Research and Integrated Neuropsychological Services, San Diego 4California State University Stanislaus
abstract
A comprehensive meta-analysis was conducted using studies of cognitive-behavioural-therapy-based interventions (CBT-BIs) for late-life depression. Patient characteristics, CBT modality, and other study variables were analyzed using subgroup and metaregres-sion analysis methods. Results showed the collective treatment effect of CBT-BIs for reducing late-life depression to be moderate (g = -0.63) with significant heterogeneity (I2 = 66.12%). CBT-BIs were found to be no more effective immediately posttreatment than other psychological treatments, pharmacotherapy, or combination interventions. The data support the notion that CBT is more effective in the long term.
résumé
On a mené une méta-analyse approfondie d’après des interventions basées sur la thérapie cognitivo-comportementale (IB-TCC) conçues pour le traitement de la dépression à un âge avancé. On analysa les caractéristiques du patient, les modalités de la TCC et d’autres
Revue canadienne de counseling et de psychothérapie ISSN 0826-3893 Vol. 52 No. 1 © 2018 Pages 78–117
variables de l’étude, en ayant recours à des méthodes d’analyse de sous-groupe et d’analyse de métarégression. Les résultats ont révélé que l’effet du traitement collectif des IB-TCC en vue d’atténuer la dépression en âge avancé était moyen (g = -0,63) et considérablement hétérogène (I2 = 66,12 %). On a conclu que les IB-TCC ne se révélaient pas plus efficaces immédiatement après le traitement que les autres types de traitements psychologiques, pharmacothérapeutiques ou que les interventions combinées. Les données semblent indiquer que la TCC est plus efficace à long terme.
In 2015, there were 901 million people over the age of 60 years globally. This age demographic is projected to increase to 1.4 billion by 2030 and to 2.1 billion by 2050 (United Nations Department of Economic and Social Affairs, Population Division, 2015). In older adulthood, depression is common and can have detri-mental consequences on quality of life and longevity. Prevalence rates for major depression in late life vary considerably depending on the region, setting, and age group. A meta-analysis of these prevalence rates among community-based elderly populations found pooled prevalence rates of 7.2% (range: 4.6–9.3%) for major depression and 17.1% (range: 4.5–37.4%) for clinically significant depressive symptoms (Luppa et al., 2012). Elderly people living in residential care settings have been found to have higher prevalence rates for major depression ranging from 14% to 42% (Djernes, 2006). In a different meta-analysis of prospective studies, elderly women were found to have an increased risk of depression compared to men (Cole & Dendukuri, 2003). Common risk factors for developing depressive symptoms and depressive disorders among older adults include cognitive and functional impairment, somatic illness, sleep disturbance, loss or lack of close social contacts, history of depression, low income, and older-old age (Cole & Dendukuri, 2003; Glaesmer, Riedel-Heller, Braehler, Spangenberg, & Luppa, 2011; Leadholm, Rothschild, Nielsen, Bech, & Ostergaard, 2014).
Depressive symptoms left untreated in the elderly can have severe consequences. Major depression is highly associated with suicide in this population (Yeates & Thompson, 2008). A New Zealand case-control study demonstrated that the elimi-nation of mood disorders, particularly depression, would result in a 74% reduction in serious suicidal behaviour among older adults (Beautrais, 2002). However, the prognosis for depression recovery in late life is poor. In a secondary analysis of older adults with major depression from the PRISM-E study, 71% of the patients remained depressed at 6 months’ follow-up after receiving services from mental health professionals in primary care and mental health specialty settings (Azar, Chopra, Cho, Coakley, & Rudolph, 2011). Because of this poor prognosis and the detrimental effects of depression in late life, researchers have examined the clinical utility of different psychological interventions (Mackin & Areán, 2005; Scogin, Welsh, Hanson, Stump, & Coates, 2005). Among the psychotherapies for treating depression in all age groups, cognitive-behavioural-therapy-based interventions (CBT-BIs) have been the most frequently investigated.
CBT-BIs are considered evidence-based, manualized psychological interven-tions for a variety of diagnoses, including depression. The modality specifically
referred to as CBT utilizes techniques that help identify and restructure maladap-tive thought processes and learned behaviours. The treatment aims to achieve the restructuring of maladaptive cognitions in relation to environmental contingencies that play a role in maintaining those cognitions. There are several other interven-tion techniques that are based on the broad CBT theoretical model. One of those, behaviour therapy (BT), involves manipulating environmental cues and providing response-contingent positive reinforcement in order to develop behavioural skills, increase positive mood, and decrease maladaptive behaviours. Cognitive therapy (CT) identifies cognitive distortions that cause faulty information processing and modifies those thoughts in order to provide a more accurate and unbiased view of reality. Behavioural activation (BA) increases the frequency of engagement in personally identified pleasant events to improve mood. This modality helps patients to differentiate behavioural patterns that contribute to depressive and pleasant mood states. Problem-solving therapy (PST) helps develop a positive, constructive orientation toward approaching and resolving problems. It teaches patients problem identification and formulation, generating alternative solutions, goal-oriented decision-making, and solution implementation and verification. It also often involves increasing motivation and self-efficacy (Dobson, 2009; O’Donohue & Fisher, 2009).
Psychotherapeutic interventions for late-life depression have been widely stud-ied. However, previous meta-analyses have included all types of psychological treat-ments for depression (Pinquart, Duberstein, & Lyness, 2007; Wilson, Mottram, & Vassilas, 2008) and did not differentiate among the types of CBT-BIs (Gould, Coulson, & Howard, 2012; Peng, Huang, Chen, & Lu, 2009). In previous meta-analyses, moderating variables such as participant, intervention, and study level characteristics were observed to contribute to between-study heterogeneity. For example, Pinquart et al. (2007) examined nine variables, and four were found to significantly moderate treatment effects: type of control condition, quality of study, type of depression, and comorbidity. Additionally, Gould et al. (2012) found that 6 out of 15 variables they studied contributed to between-study heterogeneity; these were concurrent pharmacotherapy, mode of therapy, type of control group, type of outcome measure, and study quality-related factors (allocation concealment and selective outcome reporting).
The current meta-analysis focuses exclusively on CBT-BIs and explores the moderating effects that have been found to play a role in treatment. Specifically, we hypothesized that CBT-BIs would have larger treatment effects in reducing depression in older adults compared to both active and nonactive control condi-tions. We also examined the effectiveness of CBT-BIs compared to non-CBT psychotherapies and pharmacotherapy. Additionally, since each CBT-BI offers both shared and unique change components that drive the effect of the treatment, the current meta-analysis explores the magnitude of treatment effects among these interventions. Finally, we examined differences in treatment effect sizes at follow-up periods of 1–3 months, 6–9 months, and 10–12 months.
method Search Strategy
Two independent investigators (WJT and AOH) conducted a comprehensive search of the following 12 electronic databases: PsycINFO, PubMed, Web of Science, Dissertations & Theses, Cochrane Library: Cochrane Central Register of Controlled Trials (Clinical Trials), Academic Search Complete, E-Journals, CINAHL Plus, Abstracts in Social Gerontology, OCLC Proceedings, ArticleFirst, and PaperFirst. To decrease the possibility of search method bias, the two inde-pendent investigators performed searches of each database using their own search terms relevant to the study topic. For example, in PsycINFO, the search included the following key words and descriptors: cognitive-behavioral therapy, behavior therapy, geriatrics psychotherapy, behavioral activation, problem-solving therapy, elderly, late life, geriatric, senior, affective disorders, dysthymic disorder, major depression, or recurrent depression.
The final search was conducted in January 2015. Also, journal-specific electronic searches were conducted, and the reference lists of systematic reviews and primary studies on psychological interventions for the treatment of depression in older adults were reviewed to find additional studies. Finally, published research experts in the subject areas of gerontology and psychological treatment for depression were contacted via email and websites for possible relevant unpublished and ongoing studies. Two unpublished dissertation studies (Norton, 2010; Shah, 2010) were obtained for review, and determined to be eligible for inclusion.
Inclusion Criteria
This meta-analysis included studies of participants described as older adults with a lower age limit of 55 years (i.e., studies with any participants below the age of 55 were rejected) and a mean age greater than or equal to 60. The articles had to have participants with a primary diagnosis of depression, as determined by use of a diagnostic clinical interview and/or by meeting a level of depression severity above the cut-off scores on self-rated or clinician-rated depression scales. Primary studies must have had participants enrolled in a CBT-BI for depression. In addition, studies were required to include a control condition or treatment com-parison condition. The presence of comorbid disorders was allowed if depression was the primary mental health disorder. Finally, studies had to provide sufficient information to calculate effect sizes (e.g., sample size, means, standard deviations, standard errors, event rates, and change scores).
Quality of Studies
The quality of studies was evaluated using a modified Randomized Control Trial of Psychotherapy Quality Rating Scale (RCT-PQRS; Kocsis et al., 2010). The modified RCT-PQRS consisted of 24 items scored from 0 to 2 for a maximum study quality score of 48. Because nonrandomized studies were included in the current meta-analysis, it was important to distinguish their scores from randomized studies on a scale that was designed primarily for randomized control trials (Higgins
et al., 2013). In pursuit of a replicable and easily reversible method for weighing nonrandomized studies lower than randomized ones, the two primary investigators (WJT and AOH) achieved consensus on multiplying nonrandomized studies by a coefficient of 0.75 to reduce their quality score by one fourth. This procedure was chosen because it was easy to replicate and, if necessary, reverse. Although the 0.75 coefficient was arbitrary, it resulted in an easily recognizable difference (one fourth) that distinguished between the two types of studies. The final scores on the modified RCT-PQRS were examined across raters using a two-way random effects intraclass correlation coefficient (ICC), and the results evidenced a reliability of .83. This level of interrater reliability is consistent with previous findings using the RCT-PQRS (Gerber et al., 2011; Kocsis et al., 2010; Thoma et al., 2012). Data Analysis
This meta-analysis utilized the random-effects model to account for between-study variance in heterogeneity estimates and sample size differences (Borenstein, Hedges, Higgins, & Rothstein, 2009; Cleophas & Zwinderman, 2008). The stand-ardized mean difference (SMD) was calculated on depression outcome measures for each study using Cohen’s d effect size. Odds ratios were used to calculate effect size estimates for categorical data (Fleiss & Berlin, 2009). Hedges’ g correction for small sample bias was employed to prevent overestimating treatment effects from studies with small samples (Hedges, 1981; Hedges & Olkin, 1985). Effect size data was calculated using the meta-analysis software package Comprehensive Meta-Analysis version 2 (CMA-2). For studies that included multiple depression outcome measures, the average of the effect sizes was calculated to create a single combined effect size. For interpretation of effect size estimates, Cohen (1988) suggested that effect size estimates around 0.2 corresponds to a small effect size,
0.5 to a medium effect size, and 0.8 and above to a large effect size. Effect size
estimates in the negative (-) direction indicated that CBT-BIs reduced depression more than control or non-CBT-BI conditions.
Because it is difficult to interpret effect sizes calculated from continuous out-comes, the numbers-needed-to-treat (NNT) was calculated for each effect size estimate (da Costa et al., 2012). The NNT is defined as the number of participants that must be treated with the experimental intervention in order to create one good outcome or to prevent one bad outcome in comparison with the control condition (Furukawa, 1999). To calculate the NNT, this meta-analysis used the SMD from the continuous outcomes conversion formula provided by Furukawa (Furukawa, 1999; Furukawa, Cipriani, Barbui, Brambilla, & Watanabe, 2005; Furukawa & Leucht, 2011).
The presence of significant heterogeneity was assessed using Cochran’s Q statistic (Cochran, 1954). This meta-analysis used an additional measure of heterogeneity that describes the amount of inconsistency in effect size estimates across the in-cluded studies, known as the I2 statistic (Higgins, Thompson, Deeks, & Altman,
2003). Values of the I2 statistic around 25%, 50%, and 75% are categorized as
The fail-safe N procedure outlined by Orwin (1983) was performed to address the occurrence of reduced reporting and publication of nonsignificant findings in treatment studies, commonly known as the “file-drawer problem” (Rosenthal, 1991; Rosenthal & Rubin, 1988). In addition, a funnel plot was utilized to ex-amine the presence of publication bias.
Sensitivity and Moderator Analyses
Sensitivity analyses were used to examine (a) effects of the violation of the assumption of independence by using one effect size per study (highest and low-est); (b) depression outcome effect sizes derived from only dichotomous outcome data (e.g., remission or improvement); and (c) the three most utilized depression outcome measures found among the included studies, which were the Geriatric Depression Scale (GDS; Yesavage et al., 1983), Beck Depression Inventory (BDI; Beck, Ward, Mendelson, Mock, & Erbaugh, 1961), and Hamilton Depression Rating Scale (HDRS; Hamilton, 1960).
Subgroup and metaregression moderator analyses were conducted to deter-mine if participant, intervention, or study level characteristics were significantly associated with effect size variability. Subgroup analyses at the level of participant characteristics were as follows: (a) depression diagnosis (MDD, minor/dysthymia/ subthreshold, mixed depression), (b) mean age category (young-old 60–69, middle-old 70–79, middle-old-middle-old 80+), (c) comorbidity (cognitive, physical, psychological, multiple conditions, none), (d) concurrent pharmacotherapy (yes or no), and (e) recruitment setting (clinical, community, both). Intervention-level moderators in-cluded (a) CBT-BI type (CBT, CT, BT, BA, PST), (b) diagnostic measure (clinician-rated, participant self-(clinician-rated, both), (c) treatment setting (inpatient or outpatient), (d) treatment format (individual, group, bibliotherapy/self-help), (e) number of intervention sessions (4–13, 14–20, 24–54, self-help), (f) treatment length in weeks (2–13, 14–20, 24–36), and (g) number of weekly intervention sessions (1 session, 2 sessions, 4 sessions, self-help). Additionally, study-level moderators included (a) control condition (active or nonactive), (b) study design (randomized control trial or nonrandomized control trial), and (c) type of analysis (intention-to-treat or completers-only). Univariate metaregression analyses were performed using an unrestricted maximum likelihood mixed-effects regression model (Borenstein et al., 2009). Quality of study, dropout percentage, gender (percentage of females), and study publication date (or date of dissertation) were examined as potential predictors of depression outcome effect sizes among the included studies.
results Selected and Included Studies
The comprehensive search strategy by two independent investigators identified a combined total of 6,493 potentially relevant abstracts (Figure 1). After combining these records and removing duplicates, 4,458 abstracts were identified for further review. Two independent investigators, who did not take part in performing the
Figure 1. Flowchart of electronic search strategy.
initial search, separately examined the 4,458 abstracts for study relevance and in-clusion (Figure 2). After further screening, 203 full-text documents were retrieved for further full-text review. Fifty-three studies met all the inclusion criteria.
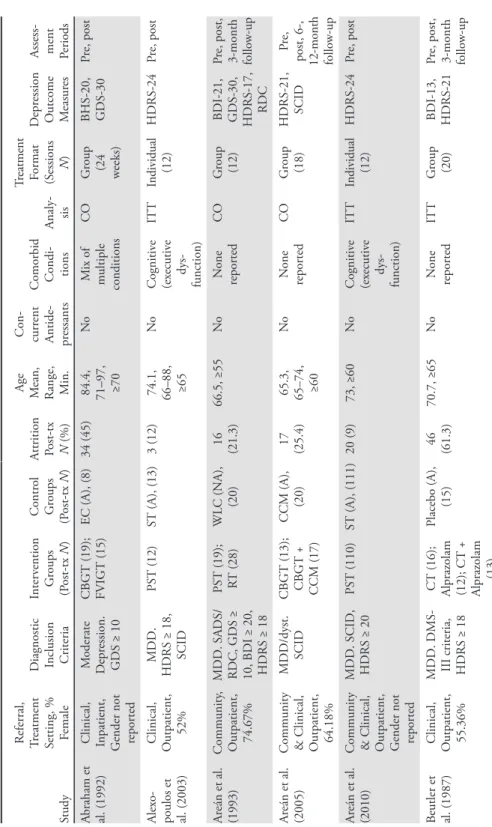
Characteristics of included studies. The 53 studies included in this meta-analysis had a combined sample size of 3,568 participants. Study publication dates ranged from 1982 to 2013. Mean quality of study score was 31 (SD = 6.14) with a range of 16–42 (see Figure 3). Of the participants within the included studies, 71% were women and 29% were men. Three studies did not report any data on the gender of participants (Abraham, Neundorfer, & Currie, 1992; Areán et al., 2010; Hsu et al., 2010). The sample-size-weighted mean age was 71 (SD = 5.49) with 62 being the youngest and 84 the oldest mean age reported in the studies.
Analyses were conducted on 1,604 participants in CBT-BIs, 1,456 in control conditions, 134 in other psychological treatments, 299 in pharmacotherapy, and 75 in combination treatment with CBT and pharmacotherapy. Among the in-cluded studies, 36 were randomized controlled trials and 6 were quasi-experimental with no randomization. These two types of studies were included in the main analysis resulting in a total of 42 studies (out of 53 total included studies). Of the remaining 11 studies, 7 were “treatment versus treatment” comparison trials without a control condition and 4 were randomized treatment and control trials at follow-up. These studies were analyzed separately. As some studies had more than one treatment condition, the 42 primary studies produced 52 effect size comparisons. Finally, 26 studies allocated participants to active control conditions and 19 studies used nonactive controls.
Table 1 Char
acteristics of S
tudies
Study
Referral, Treatment Setting, % Female
D
iagnostic Inclusion Criteria
Inter vention G roups (P ost-tx N ) Contr ol G roups (P ost-tx N ) Abraham et al. (1992) Clinical, Inpatient, Gender not repor
ted M oderate D epr ession. GDS ≥ 10 CBGT (19); FVIGT (15) EC (A), (8) Alex o-poulos et al. (2003) Clinical, O utpatient, 52% MDD. HDRS ≥ 18, SCID PST (12) ST (A), (13) Ar eán et al. (1993) Community , O utpatient, 74.67% MDD. SADS/ RDC, GDS ≥ 10, BDI ≥ 20, HDRS ≥ 18 PST (19); RT (28) WL C (NA), (20) Ar eán et al. (2005)
Community & Clinical, Outpatient, 64.18% MDD/dyst. SCID CBGT (13); CBGT + CCM (17) CCM (A), (20) Ar eán et al. (2010)
Community & Clinical, Outpatient, Gender not repor
ted MDD. SCID, HDRS ≥ 20 PST (110) ST (A), (111) Beutler et al. (1987) Clinical, O utpatient, 55.36% MDD. DMS- III criteria, HDRS ≥ 18 CT (16); Alpraz olam (12); CT + Alpraz olam (13) Placebo (A), (15) Attrition Post-tx N (%) Age Mean, Range, Min.
Con -curr ent Anti de -pr ess ants Co morbid Con di -tions Analy -sis Tr eat me nt Format (Sessions N ) D epr ess ion O ut come M easur es Assess - ment Periods 34 (45) 84.4, 71–97, ≥70 No M ix of multiple conditions CO G roup (24 weeks) BHS-20, GDS-30 Pr e, post 3 (12) 74.1, 66–88, ≥65 No Cognitiv e (ex ecutiv e dys -function) IT T Individual (12) HDRS-24 Pr e, post 16 (21.3) 66.5, ≥55 No N one repor ted CO G roup (12) BDI-21, GDS-30, HDRS-17, RDC Pr e, post, 3-month follo w-up 17 (25.4) 65.3, 65–74, ≥60 No N one repor ted CO G roup (18) HDRS-21, SCID Pr e,
post, 6-, 12-month follo
w-up 20 (9) 73, ≥60 No Cognitiv e (ex ecutiv e dys -function) IT T Individual (12) HDRS-24 Pr e, post 46 (61.3) 70.7, ≥65 No N one repor ted IT T G roup (20) BDI-13, HDRS-21 Pr e, post, 3-month follo w-up
Study Referral, Treatment Setting, % Female
D
iagnostic Inclusion Criteria
Inter vention G roups (P ost-tx N ) Contr ol G roups (P ost-tx N )
Brand & Clingem
-peel (1992) Clinical, Inpatient, 88.68% MDD. RDC BT + T AU (27) TA U standar d hospital car e (A), (26) Br ody et al. (2006) Community , O utpatient, 65.63% M aj./min./ dyst. SCID, GDS-S ≥ 5 CB T SMT (12) WL C (NA), (12); T aped EC (A), (8); WLC +T aped EC (20) Chu, Y oo, & Lee (2007) Community , O utpatient, 80% M inor D epr ession. GDS-S ≥ 5 CB T (21) N o Tx Contr ol (NA), (19) Ciechan -owski et al. (2004) Community & Clinical, Outpatient, 78.99%
M inor D epr ession or Dysthymia. SCID PST (72) UC (A), (66) Contr eras et al. (2006) Clinical, Outpatient, 92.20% M aj./
min./dyst. Diagnostic Inter
vie w Brief CB T (19) WL C (NA), (19) D eB err y et al. (1989) Community , O utpatient, 56.25% M inor D epr ession. BDI CT (10); Meditation- Relaxation (13) Pseudo-Tx (A), (9) Attrition Post-tx N (%)
Age Mean, Range, Min.
Con -curr ent Anti de -pr ess ants Co morbid Con di -tions Analy -sis Tr eat me nt Format (Sessions N ) D epr ess ion O ut come M easur es Assess - ment Periods 3 (5.4) 71.7, ≥60 Ye s N one repor ted CO G roup (8) BDI-21, HDRS-21, NOSIE- D-30 Pr e, post 0 81.5, ≥60 Ye s Physical CO G roup (6) GDS-S-15 Pr e, 6-month follo w-up 3 (7) 74.3, 68- 78, ≥65 No M ix of multiple conditions CO G roup (12) GDS-S-15 Pr e, post 11 (8) 73, ≥60 Ye s M ix of multiple conditions IT T Individual (8) HSCL-D- 20 Pr e, 6-, 12-month follo w-up 0 63-77, ≥60 Ye s Psy cho -log ical CO Individual (8) GDS-30 Pr e, post, 1-month follo w-up 0 68.9, 65- 75, ≥65 No N one repor ted CO Individual (20) BDI-21 Pr e, post
Study Referral, Treatment Setting, % Female
D
iagnostic Inclusion Criteria
Inter vention G roups (P ost-tx N ) Contr ol G roups (P ost-tx N ) Flo yd (1999) Disser -ta tion (pub lished
2004) & Floyd et al. (2006) follo
w-up Community , O utpatient, 76.09% M aj./min./ dyst. DSM- IV criteria, HDRS ≥ 10 CT (8); CB T B iblio-therapy (13) D elay ed Tx WL C (NA), (14) G allagher & Thompson (1982) Community & Clinical, Outpatient, 76.67%
MDD. SADS/RDC, BDI ≥ 17, HDRS ≥ 14 CT (10); BT (10); BPT (10) N one G allagher-Thomp son & S teffen (1994)
Community & Clinical, Outpatient, 92%
M
aj./min./
dyst. SADS/ RDC, BDI
≥ 10 CB T (31); BPT (21) N one G ellis et al. (2007) Clinical, Outpatient, 85% MDD. CES-D ≥ 22 PST -HC (20) UC (A), (20) G ellis & Br uce (2010) Clinical, Outpatient, 91.67% Subthr eshold. SCID, CES-D ≥ 22 PST -HC (18) UC+E (A), (18) Attrition Post-tx N (%) Age Mean, Range, Min.
Con -curr ent Anti de -pr ess ants Co morbid Con di -tions Analy -sis Tr eat me nt Format (Sessions N ) D epr ess ion O ut come M easur es Assess - ment Periods 14 (30) 68, 60- 80, ≥60 Allo w ed if ≥ 3 months stabiliz ed N one repor ted CO
Biblio- therapy (4 weeks); Individual (16) GDS-30, HDRS-21
Pr
e,
post, 3-, 24-month follo
w-up 8 (26.6) 67.7, 59- 80, ≥55 No N one repor ted CO Individual (16) BDI-21, HDRS-17, SDS-20 Pr e, post, 1.3-, 3-, 6-, 12-month follo w-up 14 (21.2) 62 No N one repor ted CO Individual (20) BDI-21, GDS-30, HDRS-17, RDC Pr e, post, 3-month follo w-up 8 (16.6) 79.9, ≥65 Ye s Physical CO Individual (6) BDI-21, GDS-S-15 Pr e,
post, 3-, 6-month follo
w-up 2 (5.3) 75.9, ≥65 Ye s Physical IT T Individual (6) BDI-21, HDRS-17 Pr e, post
Study Referral, Treatment Setting, % Female
D
iagnostic Inclusion Criteria
Inter vention G roups (P ost-tx N ) Contr ol G roups (P ost-tx N ) H aringsma et al. (2006) Community , O utpatient, 69% M aj./
min./dyst. M.I.N.I.-CR (Used MDD ES data only)
CB T (61) (MDD only N=21) WL C (NA), (58) (MDD only N=22) H autzinger & W elz (2004)
Community & Clinical, Outpatient, 79%
M aj./min./ dyst. SCID CB T (55) WL C (NA), (30) Hsu et al. (2010) Community , O utpatient, G
ender not repor
ted M inor D epr ession. Self-r epor ted depr essiv e symptoms CBGT (10) WL C (NA), (10) Joling et al. (2011) Clinical, Outpatient, 73.53% Subthr eshold. MINI, CES-D ≥ 16 CB T B iblio -therapy (86) UC (A), (84) Kiosses et al. (2010) Community , O utpatient, 70.83% MDD. SCID, HDRS ≥ 17 PST -HD (15) ST -HD (A), (15) Kitsumban et al. (2009) Community , O utpatient, 100% M inor to moderate Depr ession. BDI ≥ 10, BDI ≤ 29 MBCT (27) TA U (A), (27) Attrition Post-tx N (%) Age Mean, Range, Min.
Con -curr ent Anti de -pr ess ants Co morbid Con di -tions Analy -sis Tr eat me nt Format (Sessions N ) D epr ess ion O ut come M easur es Assess - ment Periods 9 (7.6) 64.2, 55- 85, ≥55 Ye s Physical CO G roup (10) CES-D-20, HADS-D-7 Pr e,
post, 2-, 14-month follo
w-up 15 (15) 68.5, 60- 87, ≥60 Ye s M ix of multiple conditions CO G roup (12) GDS-30, IDS-C-28, SCL-90-D, HR- Skala-20 Pr e, post, 6-month follo w-up 0 75.3, ≥65 No N one repor ted CO G roup (8) CES-D-20 Pr e, post 24 (14) 81.5, ≥75 Ye s Physical IT T Biblio -therapy (12 weeks) CES-D-20 Pr e, post 5 (16.7) 79.4, 66- 94, ≥65 Allo w ed if ≥ 8 weeks stabiliz ed Cognitiv e IT T Individual (12) HDRS-24 Pr e, post 6 (10) 69.3, 60- 80, ≥60 No N one repor ted CO G roup (11) BDI-21 Pr e, post, 3-month follo w-up
Study Referral, Treatment Setting, % Female
D
iagnostic Inclusion Criteria
Inter vention G roups (P ost-tx N ) Contr ol G roups (P ost-tx N ) Klausner et al. (1998) Community & Clinical, Outpatient, 54.55%
MDD. SADS GFGP (7); RT (6) N one K onner t et al. (2009) Clinical, Inpatient, 76.74% Subsyndr omal SCID-IV -R, GDS ≥ 9 CBGT (20) TA U (A), (23) Laidlaw et al. (2008) Clinical, Outpatient, 72.50% MDD. SADS, HDRS ≥ 7, HDRS < 24, BDI ≥ 13, BDI < 28
CB T (20) TA U (A), (20) Lamers et al. (2010) Clinical, Outpatient, 46.54% M aj./min./ dyst. MINI, HDRS < 18 CB T-based M inimal Psy cho-logical Inter vention (127) UC (A), (135) Landr
e-ville & Bis son
nette
(1997)
Community & Clinical, Outpatient, 86.96%
M aj./min. GDS ≥ 11, IDD ≥ 22 Cognitiv e Biblio-therapy (10) D elay ed Tx WL C (NA), (13) Attrition Post-tx N (%)
Age Mean, Range, Min.
Con -curr ent Anti de -pr ess ants Co morbid Con di -tions Analy -sis Tr eat me nt Format (Sessions N ) D epr ess ion O ut come M easur es Assess - ment Periods 2 (13.3) 66.8, ≥55 Ye s Physical CO G roup (11) BDI-21, BHS-20, HDRS-17, MADRS- 10 Pr e, post 21 (33) 81, ≥60 Ye s Physical CO G roup (13) CES-D-20, GDS-30 Pr e,
post, 3-, 6-month follo
w-up 4 (9) 74, ≥60 N o CB T. Yes T AU. M ix of
multiple con ditions
IT T Individual (17) DI-21, BHS-20, GDS-S- 15, HDRS- 17, RDC Pr e,
post, 3-, 6-month follo
w-up 97 (27) 70.7, ≥60 Ye s Physical CO Individual (10) BDI-21 Pr e,
post, 3-, 9-month follo
w-up 0 72, ≥55 Allo w ed if ≥ 3 months stabiliz ed Physical CO Biblio -therapy (4 w eeks) BDI-21, GDS-30, IDD-22 Pr e, post, 6-month follo w-up
Study Referral, Treatment Setting, % Female
D
iagnostic Inclusion Criteria
Inter vention G roups (P ost-tx N ) Contr ol G roups (P ost-tx N )
Latour & Cap
pelie z (1994) Clinical, Outpatient, 82.76% MDD. IDD, BDI ≥ 14, GDS ≥ 14 CT + Pr
etherapy Training (12); CT + Pretherapy Attention Placebo (9) N one Lichtenberg et al. (1996) Clinical, Inpatient, 83% M aj./min. GDS ≥ 11, RDC BT b y psy chologist (13); B T b y occupational therapist (13) N o Tx Contr ol (NA), (11) Lynch et al. (2003) Clinical, Outpatient, 85.29% MDD. DDES, BDI ≥ 19, HDRS ≥ 18 DB T + Medication CM (17); Medication CM (17) N one M oss (2009) D is-ser ta tion (P ub lished in 2012)
Community & Clinical, Outpatient, 76.92%
Subthr eshold depr ession. BDI ≥ 10 BA B iblio -therapy (13) D elay ed Tx WL C (NA), (13) N or ton (2010) D is-ser ta tion Clinical, Inpatient, 50% M aj./min./ dyst. GDS ≥ 9 Brief BA + Hospital TAU (24) TA U (A), (25) Oxman & H ull (2001) Clinical, Outpatient, 41% M in./dyst. HDRS ≥ 10, PRIME-MD, SCID PST -PC (104); Par ox etine (93) Pill P lacebo with CM (A), (110) Attrition Post-tx N (%) Age Mean, Range, Min.
Con -curr ent Anti de -pr ess ants Co morbid Con di -tions Analy -sis Tr eat me nt Format (Sessions N ) D epr ess ion O ut come M easur es Assess - ment Periods 8 (27.6) 69, 65- 79, ≥65 No N one repor ted CO G roup (4 pr
e-therapy sessions + 12 CT sessions) BDI-21, GDS-30, HDRS-17 Pr e, post 4 (9.8) 78, ≥60 No Physical CO Individual (4) GDS-30 Pr e, post 2 (5.6) 66, 60- 80, ≥60 Ye s Physical CO G roup (28) BDI-21, BHS-20, HDRS-17 Pr e, post, 6-month follo w-up 8 (30.8) 77.5, 65- 89, ≥65 Allo w ed if ≥ 1 month stabiliz ed N one repor ted IT T Biblio -therapy (4 w eeks) GDS-30, HDRS-17 Pr e, post, 1-month follo w-up 19 (38.8) 72.2, 65- 81, ≥65 Ye s Psy cho -log ical IT T G roup (8) GDS-30 Pr e, post 108 (26) 71, ≥60 No Physical CO Individual (6) HDRS-17 Pr e, post
Study Referral, Treatment Setting, % Female
D
iagnostic Inclusion Criteria
Inter vention G roups (P ost-tx N ) Contr ol G roups (P ost-tx N ) Rokke et al. (1999) Community & Clinical, Outpatient, 37.50%
M aj./min./ dyst. HDRS ≥ 10, BDI ≥ 10, GDS ≥ 11 CB T-based SMT -cognitiv e or behavioral target (17); BT (10); CT (12) WL C (NA), (23) Rokke et al. (2000) Community & Clinical, Outpatient, 75% MDD. SCID-P CB T-based SMT (9) WL C (NA), (16); EC (A), (9) Sallis et al. (1983) Community , O utpatient, 83% M
aj./min./ dyst. BDI ≥ 12
CB
T (8)
Attention- placebo (A),
(8) Scogin et al. (1987) Community , O utpatient, 79.31% M aj./min./ dyst. HDRS ≥ 10 Cognitiv e Biblio-therapy (9) WL C (NA), (8); A ttention-contr ol (A), (8)
Scogin et al. (1989) and Scogin et al. (1990) follo
w-up Community , O utpatient, 85.07% M aj./min./ dyst. HDRS ≥ 10 Cognitiv e
Biblio- therapy (21); Behavioral
Biblio-therapy (19) WL C (NA), (21) Ser faty et al. (2009) Clinical, Outpatient, 79.41% M aj./
min./dyst. GMSHES- AGECA
T, BDI-II ≥ 14 CB T (64) T C (A), (58); TA U (A), (55) Attrition Post-tx N (%) Age Mean, Range, Min.
Con -curr ent Anti de -pr ess ants Co morbid Con di -tions Analy -sis Tr eat me nt Format (Sessions N ) D epr ess ion O ut come M easur es Assess - ment Periods 24 (37.5) 66, 60- 86, ≥60 Ye s M ix of multiple conditions CO Individual (10) BDI-21, GDS-30, HDRS-17 Pr e,
post, 3-, 12-month follo
w-up 6 (15) 67.2, 60- 86, ≥60 Ye s M ix of multiple conditions CO G roup (10) BDI-21, GDS-30, HDRS-17 Pr e, post, 1-, 3-, 12-month follo w-up 14 (36.8) 71.3, ≥60 Ye s M ix of multiple conditions CO G roup (10) BDI-21 Pr e, post, 1-month follo w-up 9 (31) 70, ≥60 Ye s N one repor ted CO
Biblio- therapy (4 weeks) BDI-13, GDS-30, HDRS-17 Pr e, post, 1-month follo w-up 23 (34.3) 68.3, ≥60 Ye s N one repor ted CO
Biblio- therapy (4 weeks) GDS-30, HDRS-17
Pr
e,
post, 6-, 24-month follo
w-up 27 (13.2) 74.1, ≥65 Ye s N one repor ted CO Individual (12) BDI-II-21 Pr e, post, 6-month follo w-up
Study Referral, Treatment Setting, % Female
D
iagnostic Inclusion Criteria
Inter vention G roups (P ost-tx N ) Contr ol G roups (P ost-tx N ) Shah (2010) D is-ser ta tion
Community & Clinical, Outpatient, 80%
M aj./min./ dyst. GDS ≥ 10 ACB T (15) D elay ed Tx WL C (NA), (16) Snarski et al. (2011) Clinical, Inpatient, 60% Subthr eshold. GDS-S ≥ 3 BA (25) TA U (A), (25) Sood et al. (2003) Clinical, Inpatient, 42.86% M aj./min./ dyst. GDS ≥ 11 CB T (6) TA U standar d O T (A), (8) Steuer et al. (1984) Community & Clinical, Outpatient, 75.76% MDD. DSM- III criteria, HDRS ≥ 16 CB T (16); PD (17); N one Stracho wski et al. (2008) Community & Clinical, Outpatient, 66.67% MDD. BDI ≥ 10, DISH CB T (19) WL C (NA), (22) Teri et al. (1997) Clinical, Inpatient, 47.22% M aj./min. SADS/RDC, HDRS ≥ 10 BT -P E (23); BT -PS (19) WL C (NA), (20); T CC (A), (10) Attrition Post-tx N (%) Age Mean, Range, Min.
Con -curr ent Anti de -pr ess ants Co morbid Con di -tions Analy -sis Tr eat me nt Format (Sessions N ) D epr ess ion O ut come M easur es Assess - ment Periods 5 (14.7) 63.6, 55- 88, ≥55 Ye s N one repor ted CO
Self Guide CBT Audio CDs with wor kbook (4 w eeks) BSI-D-6, GDS-30, HDRS-17 Pr e, post 21 (42) 71.67, 63-87, ≥65 No M ix of multiple conditions IT T Individual (8) GDS-S-15 Pr e, post 5 (26.3) 80.79, ≥60 No Physical CO Individual (54) GDS-30 Pr e, post 13 (39.4) 66, 55- 78, ≥55 No Physical IT T G roup (46) BDI-13, HDRS-21, SDS-20 Pr e, post 7 (14.6) 62, ≥55 Ye s Physical CO Individual (16) BDI-II-21, HDRS-17 Pr e, post 16 (18.2) 76.4, ≥60 No Cognitiv e (d em en tia) CO Individual (9) BDI-21, CSDD-19, HDRS-17, RDC Pr e, post, 6-month follo w-up
Study Referral, Treatment Setting, % Female
D
iagnostic Inclusion Criteria
Inter vention G roups (P ost-tx N ) Contr ol G roups (P ost-tx N )
Thompson et al. (1987) and Gallagher- Thomp
-son et al. (1990) follo
w-up Community , O utpatient, 67.37% MDD. SADS/RDC, BDI ≥ 17, HDRS ≥ 14 BT (25); CT (27); BPT (24) D elay ed Tx WL C (NA), (19) Thompson et al. (2001) Community & Clinical, Outpatient, 67%
MDD. SADS/RDC, HDRS ≥ 14, BDI ≥ 16 CB T (31); D esipramine (33); CB T + D esipramine (36) N one W illiams et al. (2000) Clinical, Inpatient, 41.45% M inor D epr ession or Dysthymia. PRIME-MD, HDRS ≥ 10 PST -PC (138); Par ox etine (137) Pill P lacebo (A), (140) W ilson et al. (1995) Clinical, Inpatient, 83.87% MDD. DSM- III- R criteria, HDRS ≥ 17 CB T + T AU (8); Lithium (7); CB T+ Lithium (9) Pill P lacebo (A), (7) Attrition Post-tx N (%) Age Mean, Range, Min.
Con -curr ent Anti de -pr ess ants Co morbid Con di -tions Analy -sis Tr eat me nt Format (Sessions N ) D epr ess ion O ut come M easur es Assess - ment Periods 29 (24.2) 67, 60- 80, ≥60 Allo w ed if ≥ 3 months stabiliz ed N one repor ted CO Individual (16-20) BDI-21, BHS-20, BSI-D-6, GDS-30, HDRS-17, RDC Pr e, post, 12-, 24-month follo w-up 31 (30.4) 66.8, ≥60 No N one repor ted IT T Individual (16-20) BDI-21, HDRS-17 Pr e, post 104 (25) 71, 60- 93, ≥60 No M ix of multiple conditions IT T Individual (6) HDRS-17, HSCL- D-20 Pr e, post 31 (50) 75.5 Ye s N one repor ted CO
Individual (14 weekly sessions plus 10-15 booster sessions)
HDRS-17
Pr
e,
post, 6-, 12-month follo
Study Referral, Treatment Setting, % Female
D
iagnostic Inclusion Criteria
Inter vention G roups (P ost-tx N ) Contr ol G roups (P ost-tx N ) W uthrich
& Rapee (2013) Com
-mun ity , O ut patient, 64.52% M aj./min. ADIS CBGT (20) WL C (NA), (27) Attrition Post-tx N (%) Age Mean, Range, Min.
Con -curr ent Anti de -pr ess ants Co morbid Con di -tions Analy -sis Tr eat me nt Format (Sessions N ) D epr ess ion O ut come M easur es Assess - ment Periods 15 (24.2) 67.4, 60- 84, ≥60 Ye s Psy cho -logical (Anxiety) IT T G roup (12) GDS-30, CES-D-20 Pr e, post, 3-month follo w-up N ote. M easur
es. ADIS = Anxiety D
isor
ders I
nter
vie
w Schedule for DSM-IV
; A
GECA
T = A
utomated G
eriatric E
xamination for Computer Assisted
Tax onomy; BDI = B eck D epr ession I nv entor y; BHS = B eck H
opelessness Scale; BSI-D = B
rief S ymptom I nv entor y-D epr ession S
ubscale; CES-D = Center for E
pidemiological
Studies D
epr
ession Scale; DDES = D
uke D
epr
ession E
valuation Schedule; DISH = D
epr ession I nter vie w and S tr uctur ed H amilton; EDS = E dinburgh D epr ession Scale; GDS = G eriatric D epr
ession Scale; GMSHES = G
eriatric M ental S tate and H istor y and E tiology Schedule; HDRS = H amilton D epr
ession Rating Scale;
HR-S kala = H opelessness Scale; HSCL-D = H opkins S ymptom Checklist D epr
ession Scale; IDD = I
nv entor y to D iagnose D epr ession; MADRS = M ontgomer y-Asberg D epr
ession Rating Scale; MINI = M
ini-I nternational N eur opsy chiatric I nter vie w; NOSIE-D-30 = N urses ’ O bser vation Scale F or I npatient E valuation; PRIME-MD = P rimar y Car e E valuation of M ental D isor der; RDC = R esear ch D iagnostic C
riteria; SADS = Schedule for Affectiv
e D
isor
ders and Schiz
ophr enia; SDS = Z ung S elf-Rating D epr ession Scale; WDI = W akefield D epr ession I nv entor y; WHO CIDI = W orld H ealth O rganization Composite I nternational D iagnostic I nter vie w. Tr eatment. ACB T = A udio-B ased Cognitiv e B ehavioral Therapy; BA = B ehavior A ctiv ation; BPT = B rief P sy chodynamic Therapy; B T = B ehavior Therapy; B T+P E = B ehavior Therapy P leasant E vents; B T+PS = B ehavior Therapy P roblem S olving; CB T = Cognitiv e-B
ehavioral Therapy; CBGT = Cognitiv
e-B ehavioral G roup Therapy; CM = Clinical M anagement; CT = Cognitiv e Therapy; EC = E ducation Contr ol; FVIGT = F ocused V isual I mager y G roup Therapy; GFGP = G oal-Focused G roup P sy chotherapy; HC = H ome Car e; HD = H ome-D eliv er ed I nter vention; MBCT = M indfulness-B ased Cognitiv e Therapy; O T = O ccupational Therapy; PC = P rimar y Car e; PD = P sy chodynamic Therapy; PST = P roblem-S olving Therapy; R T = R eminiscence Therapy; SM = S tress M anagement; SMT = Self-M anagement Therapy; ST = S uppor tiv e Therapy; TA U = Tr eatment-as-usual; T C = Talking Contr ol; T CC = Typical Car e Contr ol; UC = U sual Car e; WL C = W aiting-List Contr ol. Study . A = activ e; NA = nonactiv e; CO = Completers-O nly; IT T = intent-to-tr eat; N = no, Y = y
es; MD = major depr
ession; M
aj./min./dyst. = combined sample of
par
ticipants with major depr
ession, minor depr
ession, and/or dysthymia; N = number of par
ticipants at posttr
CBT-BIs Versus Controls at Posttreatment
The 42 studies with 52 effect size comparisons of CBT-BIs versus controls with older adults (totalling 2,925 participants) were analyzed using a random effects model. As shown in Table 2, CBT-BIs were significantly superior to control condi-tions in reducing depression symptoms at posttreatment (g = -0.63, p < .001).
Sig-nificant heterogeneity was found to be within the moderate range (I2 = 66.12%).
CBT-BIs versus controls at follow-up. Twelve studies provided CBT-BI outcome data at follow-up. Results from 1–3 months follow-up showed a moderate
treat-ment effect (g = -0.60, p = .004; I2 = 77.88%), 6–9 months follow-up
demon-strated a borderline moderate treatment effect (g = -0.49, p = .003; I2 = 71.92%),
and there was a nonsignificant treatment effect at 10–12 months follow-up (g = -0.14, p = .336). Results are shown in Table 2.
Follow-up post-hoc meta-analysis. The four studies (five comparisons) that con-stituted the effect size at 10–12 months follow-up all consisted of active control conditions, which were found to substantially decrease effect sizes in comparison to nonactive control conditions. To assess whether CBT-BIs maintained a treatment effect or if treatment effects truly attenuate at 10–12 months follow-up periods, a post-hoc meta-analysis was performed on CBT-BIs at 10–12 months follow-up in comparison to the active control conditions at pretreatment in order to isolate the effect of active controls. Results showed a significant and large effect size of g = -0.81 (95% CI: -1.13 to -0.49, SE = 0.17, Z = -4.90, df = 4, p < .001; NNT
= 3.2), with significant and moderate heterogeneity I2 = 57.23% (Q = 9.35, df
= 4, p = .053).
CBT-BIs Versus Other Treatments
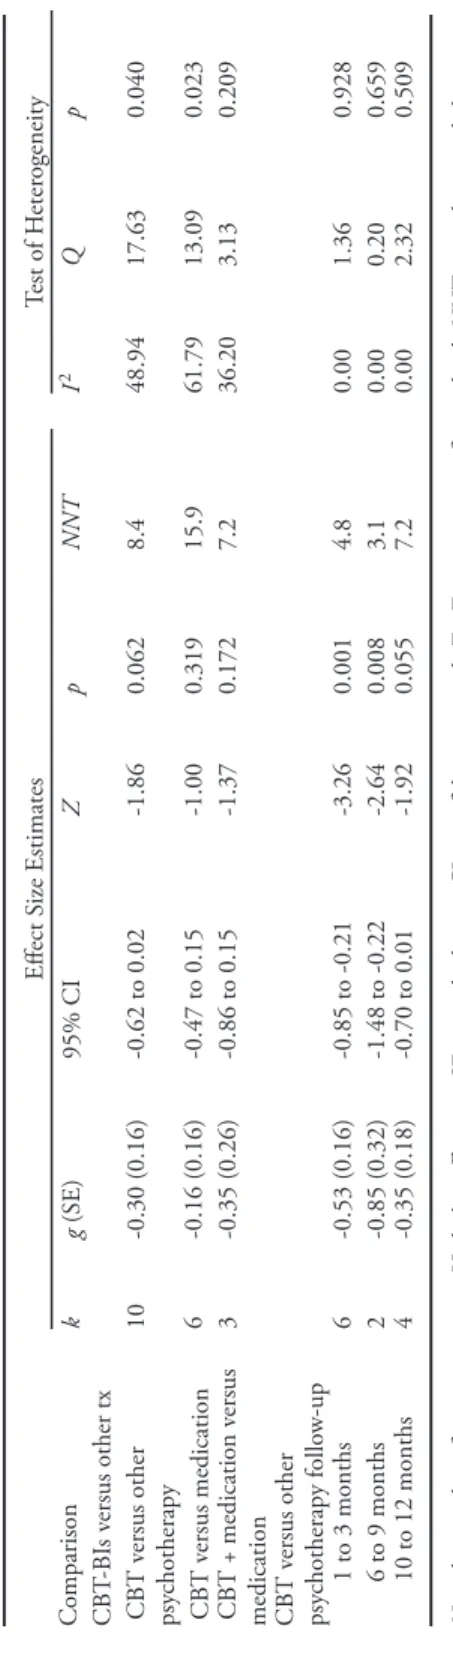
A posttreatment random effects meta-analysis revealed CBT-BIs alone were not superior to other psychotherapy interventions (g = -0.30, p = .062), pharma-cotherapy (g = -0.16, p = .319), or CBT plus pharmapharma-cotherapy versus pharmaco-therapy alone (g = -0.35, p = .172). See Table 3.
CBT-BIs versus other treatments at follow-up. Follow-up data at 1–3 months showed that CBT-BIs outperformed other psychotherapies with a moderate treat-ment effect (g = -0.53, p < .001), at 6–9 months revealed a large treattreat-ment effect (g = -0.85, p < .001), and at 10–12 months demonstrated a small treatment effect (g = -0.35, p < .055). No analyses were performed on follow-up for CBT versus pharmacotherapy and combined treatment versus pharmacotherapy due to a lack of studies. See Table 3.
Sensitivity Analyses
Sensitivity analyses were conducted on posttreatment CBT-BIs in order to examine the effect of violating the assumption of independence and exploring alternative results had we used different inclusion criteria (e.g., limited our study to dichotomous depression outcome data only).
Table 2 Over
all R
esults of S
tudies E
xamining the Effects of CB
T-BI s Compar ed to Contr ols at P osttest and F ollo w-up Effect S ize Estimates T est of H eter ogeneity Comparison k g (SE) 95% CI Z p NNT I 2 Q p
All studies at posttest
52 -0.63 (0.07) -0.76 to -0.49 -8.82 <0.001 4.1 66.12 150.55 <0.001 Follo
w-up all studies 1 to 3 months
12 -0.60 (0.21) -1.00 to -0.19 -2.86 0.004 4.2 77.88 49.74 <0.001 6 to 9 months 10 -0.49 (0.16) -0.81 to -0.17 -2.99 0.003 5.2 71.92 32.05 <0.001 10 to 12 months 5 -0.14 (0.14) -0.42 to 0.14 -0.96 0.336 18.2 44.48 7.20 0.125 N ote. k = number of comparisons; g = H edge ’s g effect siz e; SE = standar d err
or; CI = confidence inter
val; Z = Z-scor e; p = significance lev el; NNT = numbers-needed-to-tr eat; I 2 = per centage of total v ariance; Q = v ariance betw een studies as a pr opor tion of total v ariance. Table 3 Results of S tudies E
xamining the Effects of CB
T-BI s Compar ed to Differ ent Types of I nter ventions at P osttest and F ollo w-up Effect S ize Estimates Test of H eter ogeneity Comparison k g (SE) 95% CI Z p NNT I 2 Q p CB T-BI s v ersus other tx CB T v ersus other psy chotherapy 10 -0.30 (0.16) -0.62 to 0.02 -1.86 0.062 8.4 48.94 17.63 0.040 CB T v ersus medication 6 -0.16 (0.16) -0.47 to 0.15 -1.00 0.319 15.9 61.79 13.09 0.023 CB T + medication v ersus medication 3 -0.35 (0.26) -0.86 to 0.15 -1.37 0.172 7.2 36.20 3.13 0.209 CB T v ersus other psy chotherapy follo w-up 1 to 3 months 6 -0.53 (0.16) -0.85 to -0.21 -3.26 0.001 4.8 0.00 1.36 0.928 6 to 9 months 2 -0.85 (0.32) -1.48 to -0.22 -2.64 0.008 3.1 0.00 0.20 0.659 10 to 12 months 4 -0.35 (0.18) -0.70 to 0.01 -1.92 0.055 7.2 0.00 2.32 0.509 N ote. k = number of comparisons; g = H edge ’s g effect siz e; SE = standar d err
or; CI = confidence inter
val; Z = Z-scor e; p = significance lev el; NNT = numbers-needed-to-tr eat; I 2 = per centage of total v ariance; Q = v ariance betw een studies as a pr opor tion of total v ariance.
Test of violation of assumption of independence. Sensitivity analyses were con-ducted to examine the effect of violating the assumption of effect size independence by including in the meta-analysis single studies that have more than one effect size. Results of this sensitivity analysis indicated that including studies with multiple effect size comparisons did not unduly influence the statistical significance (p < .001), magnitude of the overall mean effect size (g = -0.65/-0.59 versus -0.63), or
level of heterogeneity (I2 = 71.56%/68.31% versus 66.12%). See Table 4.
Remitted, remained depressed, versus improved. A meta-analysis on dichotomous depression outcome data showed that CBT-BIs with participants whose depression had remitted versus those who remained depressed at posttreatment demonstrated
large treatment effects (g = -0.83, p < .001) with moderate heterogeneity (I2 =
57.90%). Similarly, participants whose depression had improved versus those who remained unchanged or deteriorated at posttreatment showed large treatment
ef-fects (g = -0.79, p < .001) and moderate heterogeneity (I2 = 67.55%). See Table 4.
Type of outcome measure. Examining the differences among the three most com-mon depression outcome measures revealed a large treatment effect when using
the HDRS (g = -0.81, p < .001; I2 = 65.93%), and moderate treatment effects for
both the GDS (g = -0.67, p < .001; I2 = 65.50%) and BDI (g = -0.59, p < .001;
I2 = 57.31%). See Table 4.
Subgroup Analyses
Fifteen moderators were analyzed in subgroup analyses to examine systematic differences between CBT-BIs and control conditions on depression outcome meas-ures at posttreatment. Subgroup analyses were partitioned into three categories that examined participant, intervention, and study level characteristics.
Participant characteristics. As presented in Table 5, participant characteristics subgroup analyses demonstrated that the effect size of CBT-BIs was significantly
moderated by the source from which participants were recruited (QB = 9.63, p =
.008). Participants recruited from community settings showed a large treatment effect (g = -0.92, p < .001), whereas small to moderate treatment effects were ob-served among studies that recruited from clinical settings (g = -0.45, p < .001) and studies that combined settings (g = -0.56, p < .001). The effect size for CBT-BIs on outcomes was not moderated by type of depression diagnosis (p = .605), age category (p = .076), comorbidity (p = .932), or concurrent pharmacotherapy (p = .993). It is worth noting that although the overall effect of age group was not significant, parameter estimates only found significant effect sizes for young-old (60–69; g = -0.78, p < .001) and middle-old (70–79; g = -0.59, p < .001), but not for old-old (80+; g = -0.26, p = .240). Despite the lack of statistical significance, there were substantial qualitative differences in treatment effects between age categories in the sample.
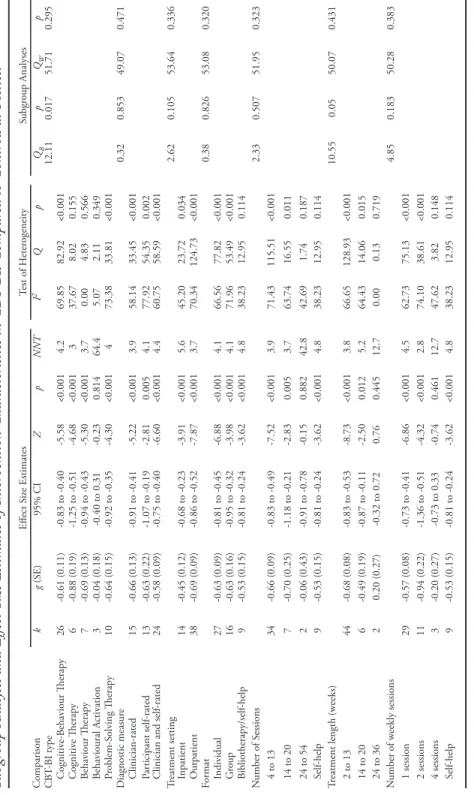
Intervention characteristics. Subgroup analyses on intervention characteristics showed that the type of CBT-BI significantly moderated depression outcome effect
sizes (QB = 12.11, p = .017; see Table 6). Participants who received CT
Table 4 Sensitivity A nalyses Effect S ize Estimates T est of H eter ogeneity Comparison k g (SE) 95% CI Z p NNT I 2 Q p
All studies at posttest
52 -0.63 (0.07) -0.76 to -0.49 -8.82 <0.001 4.1 66.12 150.55 <0.001 O ne effect siz e per study (highest) 42 -0.65 (0.08) -0.82 to -0.49 -7.84 <0.001 3.9 71.56 144.19 <0.001 O ne effect siz e per study (lo w est) 42 -0.59 (0.08) -0.74 to -0.43 -7.42 <0.001 4.3 68.31 129.37 <0.001 Remission 11 -0.83 (0.17) -1.17 to -0.49 -4.80 <0.001 3.1 57.90 23.75 0.008 Impr ov ement 10 -0.79 (0.17) -1.12 to -0.47 -4.78 <0.001 3.3 67.55 27.73 0.001 HDRS only 29 -0.81 (0.10) -1.02 to -0.61 -7.75 <0.001 3.2 65.93 82.18 <0.001 GDS only 26 -0.67 (0.12) -0.91 to -0.44 -5.60 <0.001 3.8 65.50 72.47 <0.001 BDI only 25 -0.59 (0.10) -0.77 to -0.40 -6.12 <0.001 4.3 57.31 56.22 <0.001 N ote. k = number of comparisons; g = H edge ’s g effect siz e; SE = standar d err
or; CI = confidence inter
val; Z = Z-scor e; p = significance lev el; NNT = numbers-needed-to-tr eat; I 2 = per centage of total v ariance; Q = v ariance betw een studies as a pr opor tion of total v ariance; BDI = B eck D epr ession I nv entor y; GDS = G eriatric D epr ession Scale; HDRS = H amilton D epr
Table 5 Subgr
oup A
nalyses and Effect S
iz e E stimates of P ar ticipant Char acteristics in CB T-BI s Compar ed to Contr ols at P osttest Effect S ize Estimates T est of H eter ogeneity Subgr oup Analyses Comparison k g (SE) 95% CI Z p NNT I 2 Q p QB p QW p D epr ession diagnosis 1.01 0.605 55.72 0.237 M ajor depr ession 15 -0.73 (0.12) -0.95 to -0.50 -6.31 <0.001 3.5 45.50 25.69 0.028 M inor/dysth/sub 10 -0.55 (0.17) -0.88 to -0.23 -3.35 0.001 4.6 78.04 40.98 <0.001 M ajor/minor/dysth/ sub 27 -0.60 (0.10) -0.80 to -0.40 -5.94 <0.001 4.2 63.58 71.38 <0.001 Age categor y 5.17 0.076 58.34 0.170 Young-old (60 to 69) 18 -0.78 (0.10) -0.97 to -0.58 -7.79 <0.001 3.3 33.96 25.74 0.079 M iddle-old (70 to 79) 30 -0.59 (0.09) -0.77 to -0.41 -6.33 <0.001 4.3 69.72 95.78 <0.001 O ld-old (80+) 4 -0.26 (0.22) -0.69 to 0.17 -1.18 0.240 9.7 48.61 5.84 0.120 Comorbidity 0.85 0.932 48.77 0.402 Cognitiv e 7 -0.55 (0.10) -0.74 to -0.35 -5.52 <0.001 4.6 0.00 4.31 0.634 Physical 12 -0.67 (0.16) -0.98 to -0.36 -4.28 <0.001 3.8 76.67 47.15 <0.001 Psy chological 3 -0.75 (0.56) -1.85 to 0.35 -1.34 0.179 3.4 90.15 20.30 <0.001 M ultiple conditions 10 -0.51 (0.19) -0.89 to -0.13 -2.61 0.009 5.0 76.02 37.53 <0.001 N one 20 -0.63 (0.10) -0.83 to -0.42 -6.02 <0.001 4.1 46.52 35.53 0.012 Concurr ent pharmacotherapy 0.00 0.993 54.31 0.314 Ye s 30 -0.63 (0.09) -0.81 to -0.45 -6.85 <0.001 4.1 63.52 79.49 <0.001 No 22 -0.63 (0.12) -0.85 to -0.40 -5.42 <0.001 4.1 70.29 70.69 <0.001 Recr uitment 9.63 0.008 57.97 0.178 Clinical 24 -0.45 (0.09) -0.63 to -0.28 -5.04 <0.001 5.6 64.42 64.63 <0.001 Community 18 -0.92 (0.12) -1.15 to -0.68 -7.55 <0.001 2.9 46.61 31.84 0.016
Clinical and community
10 -0.56 (0.13) -0.83 to -0.30 -4.19 <0.001 4.5 44.84 16.31 0.061 N ote. k = number of comparisons; g = H edge ’s g effect siz e; SE = standar d err
or; CI = confidence inter
val; Z = Z-scor e; p = significance lev el; NNT = numbers-needed-to-tr eat; I 2 = per centage of total v ariance; Q = v ariance betw een studies as a pr opor tion of total v ariance.
-0.88, p < .001). Significant and moderate treatment effects were found for BT (g = -0.69, p < .001), PST (g = -0.64, p < .001), and CBT (g = -0.61, p < .001). On the other hand, BA showed nonsignificant treatment effects (g = -0.04, p = .814) at posttreatment. This analysis, however, may have been underpowered due to small study sample (k = 3) and comparatively small participant sample (N = 125). The length of treatment in weeks significantly moderated depression outcome
effect sizes (QB = 10.55, p = .005). Treatment length of 2–13 weeks demonstrated a
moderate treatment effect (g = -0.68, p < .001), 14–20 weeks showed a borderline moderate treatment effect (g = -0.49, p = .012), and a nonsignificant treatment effect was found for 24–36 weeks (g = 0.20, p = .445). A decrease in treatment effect was observed beyond 13 weeks, although generalizing results for 24–36 weeks of treatment length must be made with caution. Power to detect significance for length of treatment between 24 and 36 weeks was low (power = 30%). The effect size of CBT-BIs on outcomes was not moderated by diagnostic measure (p = .853), treatment setting (p = .105), treatment format (p = .826), total number of sessions (p = .507), or number of sessions per week (p = .183).
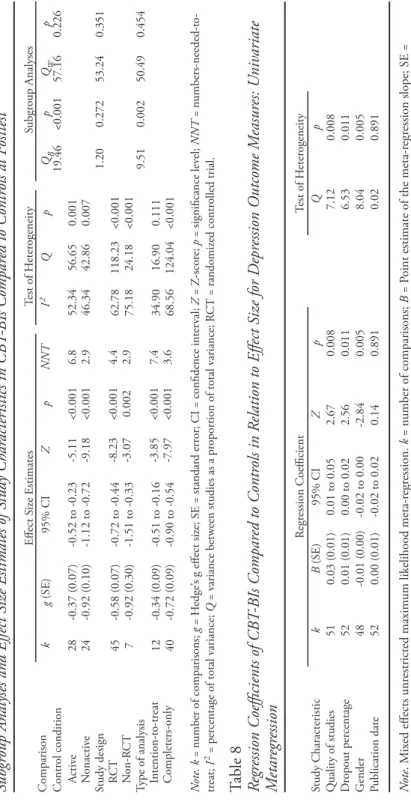
Study characteristics. Study characteristics subgroup analyses demonstrated that
control condition type significantly moderated depression outcome effect sizes (QB
= 19.46, p < .001; see Table 7). Studies that used a nonactive control condition showed a large treatment effect (g = -0.92, p < .001), whereas a small treatment effect was observed for studies that used an active control condition (g = -0.37, p <
.001). Type of analysis significantly moderated depression outcome effect sizes (QB
= 9.51, p = .002). Studies that used completer-only samples showed a moderate treatment effect (g = -0.72, p < .001), whereas a small treatment effect was found for studies that reported outcome data by the method of intention-to-treat (g = -0.34, p < .001). The effect size of CBT-BIs on outcomes was not moderated by study design (p = .272). Although the difference was not statistically significant, the lower quality nonrandomized trials demonstrated a larger effect size (g = -0.92, p < .001) than did randomized trials (g = -0.58, p < .001).
Metaregression
Quality of study, dropout percentage, gender (percentage of females), and pub-lication date were chosen a priori to conduct univariate metaregression analyses. These variables were used as predictors of depression outcome effect sizes (Table 8). Quality of study (B = 0.03, p = .008), dropout percentage (B = 0.01, p = .011), and gender (B = -0.01, p = .005) significantly predicted depression outcome ef-fect sizes. Study publication date was not significantly associated with depression outcome effect sizes (B = 0.00, p = .891).
Two post-hoc Pearson correlations were performed to further evaluate the relationships between predictor variables. First, the relationship between the percentage of males and dropout rate among the studies was found to be statisti-cally significant, but small in magnitude (r = .28, p = .05; see Figure 4). Finally, a post-hoc analysis of the relationship between number of years since publication and quality of study revealed a statistically significant and strong correlation (r = .65, p < .001; see Figure 5).
Table 6 Subgr
oup A
nalyses and Effect S
iz e E stimates of I nter vention Char acteristics in CB T-BI s Compar ed to Contr ols at P osttest Effect S ize Estimates Test of H eter ogeneity Subgr oup Analyses Comparison k g (SE) 95% CI Z p NNT I 2 Q p QB p QW p CB T-BI type 12.11 0.017 51.71 0.295 Cognitiv e-B ehaviour Therapy 26 -0.61 (0.11) -0.83 to -0.40 -5.58 <0.001 4.2 69.85 82.92 <0.001 Cognitiv e Therapy 6 -0.88 (0.19) -1.25 to -0.51 -4.68 <0.001 3 37.67 8.02 0.155 Behaviour Therapy 7 -0.69 (0.13) -0.94 to -0.43 -5.30 <0.001 3.7 0.00 4.83 0.566 Behavioural A ctiv ation 3 -0.04 (0.18) -0.40 to 0.31 -0.23 0.814 64.4 5.07 2.11 0.349 Pr oblem-S olving Therapy 10 -0.64 (0.15) -0.92 to -0.35 -4.30 <0.001 4 73.38 33.81 <0.001 D iagnostic measur e 0.32 0.853 49.07 0.471 Clinician-rated 15 -0.66 (0.13) -0.91 to -0.41 -5.22 <0.001 3.9 58.14 33.45 <0.001 Par ticipant self-rated 13 -0.63 (0.22) -1.07 to -0.19 -2.81 0.005 4.1 77.92 54.35 0.002
Clinician and self-rated
24 -0.58 (0.09) -0.75 to -0.40 -6.60 <0.001 4.4 60.75 58.59 <0.001 Tr eatment setting 2.62 0.105 53.64 0.336 Inpatient 14 -0.45 (0.12) -0.68 to -0.23 -3.91 <0.001 5.6 45.20 23.72 0.034 O utpatient 38 -0.69 (0.09) -0.86 to -0.52 -7.87 <0.001 3.7 70.34 124.73 <0.001 Format 0.38 0.826 53.08 0.320 Individual 27 -0.63 (0.09) -0.81 to -0.45 -6.88 <0.001 4.1 66.56 77.82 <0.001 G roup 16 -0.63 (0.16) -0.95 to -0.32 -3.98 <0.001 4.1 71.96 53.49 <0.001 Bibliotherapy/self-help 9 -0.53 (0.15) -0.81 to -0.24 -3.62 <0.001 4.8 38.23 12.95 0.114 N umber of S essions 2.33 0.507 51.95 0.323 4 to 13 34 -0.66 (0.09) -0.83 to -0.49 -7.52 <0.001 3.9 71.43 115.51 <0.001 14 to 20 7 -0.70 (0.25) -1.18 to -0.21 -2.83 0.005 3.7 63.74 16.55 0.011 24 to 54 2 -0.06 (0.43) -0.91 to -0.78 -0.15 0.882 42.8 42.69 1.74 0.187 Self-help 9 -0.53 (0.15) -0.81 to -0.24 -3.62 <0.001 4.8 38.23 12.95 0.114 Tr eatment length (w eeks) 10.55 0.05 50.07 0.431 2 to 13 44 -0.68 (0.08) -0.83 to -0.53 -8.73 <0.001 3.8 66.65 128.93 <0.001 14 to 20 6 -0.49 (0.19) -0.87 to -0.11 -2.50 0.012 5.2 64.43 14.06 0.015 24 to 36 2 0.20 (0.27) -0.32 to 0.72 0.76 0.445 12.7 0.00 0.13 0.719 N umber of w eekly sessions 4.85 0.183 50.28 0.383 1 session 29 -0.57 (0.08) -0.73 to -0.41 -6.86 <0.001 4.5 62.73 75.13 <0.001 2 sessions 11 -0.94 (0.22) -1.36 to -0.51 -4.32 <0.001 2.8 74.10 38.61 <0.001 4 sessions 3 -0.20 (0.27) -0.73 to 0.33 -0.74 0.461 12.7 47.62 3.82 0.148 Self-help 9 -0.53 (0.15) -0.81 to -0.24 -3.62 <0.001 4.8 38.23 12.95 0.114 N ote. k = number of comparisons; g = H edge ’s g effect siz e; SE = standar d err
or; CI = confidence inter
val; Z = Z-scor e; p = significance lev el; NNT = numbers-needed-to-treat; I 2 = per centage of total v ariance; Q = v ariance betw een studies as a pr opor tion of total v ariance.
Table 7 Subgr
oup A
nalyses and Effect S
iz e E stimates of S tudy Char acteristics in CB T-BI s Compar ed to Contr ols at P osttest Effect S ize Estimates T est of H eter ogeneity S ubgr oup Analyses Comparison k g (SE) 95% CI Z p NNT I 2 Q p QB p QW p Contr ol condition 19.46 <0.001 57.16 0.226 Activ e 28 -0.37 (0.07) -0.52 to -0.23 -5.11 <0.001 6.8 52.34 56.65 0.001 N onactiv e 24 -0.92 (0.10) -1.12 to -0.72 -9.18 <0.001 2.9 46.34 42.86 0.007 Study design 1.20 0.272 53.24 0.351 RC T 45 -0.58 (0.07) -0.72 to -0.44 -8.23 <0.001 4.4 62.78 118.23 <0.001 N on-R CT 7 -0.92 (0.30) -1.51 to -0.33 -3.07 0.002 2.9 75.18 24.18 <0.001 Type of analysis 9.51 0.002 50.49 0.454 Intention-to-tr eat 12 -0.34 (0.09) -0.51 to -0.16 -3.85 <0.001 7.4 34.90 16.90 0.111 Completers-only 40 -0.72 (0.09) -0.90 to -0.54 -7.97 <0.001 3.6 68.56 124.04 <0.001 N ote. k = number of comparisons; g = H edge ’s g effect siz e; SE = standar d err
or; CI = confidence inter
val; Z = Z-scor e; p = significance lev el; NNT = numbers-needed-to-treat; I 2 = per centage of total v ariance; Q = v ariance betw een studies as a pr opor tion of total v ariance; R CT = randomiz ed contr olled trial. Table 8 Regr ession Coefficients of CB T-BI s Compar ed to Contr ols in R elation to Effect S iz e for D epr ession O utcome M easur es: U niv ariate M etar egr ession Regr ession Coefficient Test of H eter ogeneity Study Characteristic k B (SE) 95% CI Z p Q p Q uality of studies 51 0.03 (0.01) 0.01 to 0.05 2.67 0.008 7.12 0.008 D ropout per centage 52 0.01 (0.01) 0.00 to 0.02 2.56 0.011 6.53 0.011 G ender 48 -0.01 (0.00) -0.02 to 0.00 -2.84 0.005 8.04 0.005 Publication date 52 0.00 (0.01) -0.02 to 0.02 0.14 0.891 0.02 0.891 N ote . M ix ed effects unr
estricted maximum likelihood meta-r
egr
ession.
k = number of comparisons;
B
= P
oint estimate of the meta-r
egr
ession slope; SE =
standar
d err
or; CI = confidence inter
val; Z = Z-scor e; p = significance lev el; Q = v ariance betw een studies as a pr opor tion of total v ariance.
Figure 4. Scatter plot of dropout percentage by percentage of males.
Figure 5. Scatter plot of total Quality of Study scores by year of study publica-tion.
Publication Bias
A fail-safe N analysis was conducted to examine the number of potentially missing, nonsignificant studies that would be needed to nullify the significant effect of the standardized mean difference for CBT-BIs compared to control conditions. This analysis revealed that there would need to be 2,577 studies with null results for the current p-value to exceed the 0.05 level. Further, a Duval and Tweedie’s Trim and Fill analysis revealed a symmetrical funnel plot (Figure 6). The symmetrical funnel plot suggests that a sufficient quantity of relevant studies were captured in the meta-analysis, with an indication that there are likely no missing studies.
discussion
Depression is a debilitating mental health condition that causes significant impairment, especially among vulnerable populations such as the elderly. Given the strong empirical support of CBT-BIs for the treatment of depression among youth and adults, this meta-analysis examined the effectiveness of these interven-tions among depressed older adult populainterven-tions. Results showed that CBT-BIs were significantly more effective than control conditions, producing a moderate treatment effect when compared to both control group types combined (i.e., ac-tive and nonacac-tive controls). When separated, the treatment effects for CBT-BIs were large when compared to nonactive controls (e.g., wait-list) and small when compared to active control conditions (e.g., education group).
While the statistically significant attenuation of effect-sizes in the CBT-BIs versus active control groups implies that much of the variance may be accounted for by nonspecific therapeutic factors (Laska, Gurman, & Wampold, 2013), there may still be an advantage to using CBT-BIs over other nonspecific interventions (e.g., support groups, educational groups). CBT-BIs, in comparison to active and nonactive control conditions combined, showed significant but moderate treat-ment effects on depression outcome measures up to 9 months. Results of a post-hoc analysis showed that, when controlling for the effects of active control groups, participants treated with CBT-BIs had significantly lower depression symptoms at the 10–12 months follow-up. This finding indicates that depressed older adults who receive CBT-BIs may maintain treatment benefits for at least up to a year.
At posttreatment, CBT was found to be no more effective than other psycho-therapies designed to treat depression. However, follow-up data again demon-strated that CBT-BIs were superior in long-term maintenance compared to other psychotherapies. This finding is potentially due to the adaptive skills-based nature Figure 6. Funnel plot analysis of publication bias.
of CBT-BIs. Patients learn techniques that they practice between therapy sessions to gain mastery. These strategies can be used after therapy termination to reduce vulnerability to depression and address symptoms when they occur.
CBT-BIs were found to be just as effective for treating depressive symptoms as pharmacotherapy at posttreatment. This finding is encouraging for the utility of psychotherapy (i.e., talk-based interventions for depression, given the commonly reported adverse side effects from taking antidepressant medications that older adults may need to avoid). Combining CBT-BIs and pharmacotherapy was no more effective than pharmacotherapy alone. There was an insufficient number of studies with longer-term follow-up data to compare CBT-BIs and pharmaco-therapy.
In the subgroup analysis, CT performed the best among the CBT-BI types with a large treatment effect. BT, PST, and CBT were comparable to each other, with moderate range treatment effects. BA performed the worst out of the CBT-BIs with a nonsignificant treatment effect. It is not possible to determine why BA was less effective from this meta-analysis. It is possible that BA is less effective because the physical or cognitive limitations associated with older age interfere with the effectiveness of the behavioural activities. This potential explanation deserves exploration in future studies. Also, there were fewer studies evaluating BA than other treatments, which could have influenced the findings. Thus, adding more research on the effectiveness of BA among elderly who are depressed would be extremely useful. In summary, we suggest that CT should be considered as a first-line treatment, whereas current evidence indicates that BA may not be as effective with this population.
Analyses of the three most common depression outcome measures included in the studies showed that a larger effect size was derived from the clinician-rated measure (HDRS) compared to self-report instruments (e.g., GDS and BDI). This difference could be due to biases in assessor or participant reporting of depressive symptoms, item content differences (e.g., scales that include items that rely heav-ily on physical symptoms), and differences in the weighing of items. The BDI had the smallest effect size among the three most common depression outcome measures, which could be a result of the inclusion of somatic symptoms (Smarr & Keefer, 2011). Because older adults are more prone to physical ailments, their overall score on the BDI is often inflated by endorsing somatic complaints in both the patient and control group. This would create a ceiling effect that might mask subtle differences between groups. Thus, the BDI may not be the most appropri-ate measure for use in both research with this population and in clinical practice with older adults. Self-report measures validated with this population, such as the GDS, are likely to provide information that is more accurate for determining depression severity and treatment planning with older adults.
Subgroup analyses also revealed that treatment effects were moderated by recruitment source, treatment length, and type of analysis. Results showed that participants recruited from a community setting showed large treatment effects, whereas those recruited from clinical settings (or combined clinical/community)
demonstrated moderate range treatment outcomes. This could be due to the likelihood that patients from clinical settings tend to have more severe or chronic symptoms than individuals recruited from the community in general. Future research should examine differential factors among patients treated in different settings to determine why some appear to benefit more from a depression treat-ment than others. Clinically, therapists should consider the possibility that patients who have undergone treatment for depression in other clinical settings might be less responsive to psychotherapeutic interventions compared to treatment-naïve patients.
Results of the subgroup analysis on length of treatment suggested that more therapy does not necessarily lead to better outcomes. Participants who received CBT-BIs between 2–13 weeks and 14–20 weeks demonstrated moderate treat-ment effects. Those treated longer than 20 weeks had a nonsignificant treattreat-ment effect. It is unclear if this nonsignificant finding was due to characteristics of the participants (e.g., diagnostic severity, cognitive decline) or because there were too few studies with longer-term treatment to conduct additional analyses. Regarding clinical implications, if older patients with depression are not showing benefit by 14–20 weeks of CBT-oriented therapy, a change in treatment approach that better accommodates the unique needs of older adults may be warranted.
The subgroup comparison of type of analysis revealed that completers-only depression outcome data showed significantly higher effect sizes than studies that used intention-to-treat data. Intention-to-treat analysis includes data from the last depression assessment carried forward to include data from dropouts or other sources of missing data. Thus, when researchers analyzed data only from participants who engaged in the full course of treatment, the studies yielded more favourable results. This finding highlights an important consideration: treatments may appear to have different levels of effectiveness when, in actuality, the type of analysis employed by the researchers affects the magnitude of the treatment ef-fects. End users of psychotherapy outcome research should take these factors into account when making a decision regarding their treatment of choice based on different studies. It may be beneficial for clinicians to emphasize with depressed older adults that treatment gains are typically largest for patients who commit to the full course of CBT-based treatment for depression compared to those who drop out of treatment prematurely.
Metaregression revealed that dropout rate, participant gender, and quality of the study were significantly predictive of treatment outcome effect size. As expected, studies with high dropout rates had smaller treatment effects than studies with lower dropout rates. Studies with a higher percentage of females had larger overall treatment effects than studies with a higher percentage of males. Furthermore, there was an association between gender and dropout rate; a correlational analysis revealed that studies with more males also had higher dropout rates.
There are several possible explanations for the findings on gender differences. First, it is possible that there is no true difference in the effectiveness of CBT interventions for males and females, and that the meta-analytic finding is a result