HAL Id: hal-02067448
https://hal.archives-ouvertes.fr/hal-02067448
Submitted on 13 Apr 2021
HAL is a multi-disciplinary open access
archive for the deposit and dissemination of
sci-entific research documents, whether they are
pub-lished or not. The documents may come from
teaching and research institutions in France or
abroad, or from public or private research centers.
L’archive ouverte pluridisciplinaire HAL, est
destinée au dépôt et à la diffusion de documents
scientifiques de niveau recherche, publiés ou non,
émanant des établissements d’enseignement et de
recherche français ou étrangers, des laboratoires
publics ou privés.
Influence on the ciliate community structure
Xavier Mari, F. Rassoulzadegan, Cpd Brussaard
To cite this version:
Xavier Mari, F. Rassoulzadegan, Cpd Brussaard. Role of TEP in the microbial food web structure. II.
Influence on the ciliate community structure. Marine Ecology Progress Series, Inter Research, 2004,
279, pp.23-32. �10.3354/meps279023�. �hal-02067448�
MARINE ECOLOGY PROGRESS SERIES Mar Ecol Prog Ser
Vol. 279: 23–32, 2004 Published September 28
INTRODUCTION
Since the discovery of transparent exopolymeric par-ticles (TEP) a decade ago (Alldredge et al. 1993), many studies have focused on the effect of environmental changes on the TEP pool characteristics and distribution. The aims of these previous studies on TEP were to define their source, describe their mode of formation and dis-cuss their fate in relation to ecosystem function. One of the main outcomes was to show that the size of the TEP pool is highly variable and depends on various factors, such as phytoplankton bloom events and seasonal
vari-ations (Passow & Alldredge 1994, Riebesell et al. 1995, Mari & Kiørboe 1996, Grossart & Simon 1997, Hong et al. 1997, Mari & Burd 1998, Mari et al. 2001, Passow et al. 2001), growth stage and phytoplankton species (Schuster & Herndl 1995, Grossart & Simon 1997, Hong et al. 1997, Grossart et al. 1998, Mari & Burd 1998, Mari 1999, Pas-sow 2002), turbulent regime (Stoderegger & Herndl 1999, Passow 2000), light regime (Hong et al. 1997) and carbon dioxide concentration (Engel 2002).
Field studies conducted in various regions of the ocean indicate that TEP volume concentration can vary by more than 2 orders of magnitude, depending on the
© Inter-Research 2004 · www.int-res.com *Email: [email protected]
Role of TEP in the microbial food web structure.
II. Influence on the ciliate community structure
Xavier Mari
1, 3,*, Fereidoun Rassoulzadegan
1, Corina P. D. Brussaard
2 1Marine Microbial Ecology Group, Observatoire Océanologique, Laboratoire d’Océanographie de Villefranche,UMR 7093, BP 28, 06234 Villefranche-sur-Mer Cedex, France
2Royal Netherlands Institute for Sea Research, Department of Biological Oceanography, PO Box 59, 1790 AB Den Burg, Texel, The Netherlands
3Present address: Institut de Recherche pour le Développment (IRD), Centre de Nouméa, BP A5, NC-98848 Noumea, New Caledonia
ABSTRACT: The structure of the bacterial population (free vs. attached bacteria), variations in bac-terial abundance and ciliate group composition were monitored as a function of transparent exopoly-meric particle (TEP) concentration during Phaeocystis globosa blooms that developed in mesocosms. Two ciliate groups dominated at different stages of the blooms. The oligotrichous ciliate Strombidium spp. were dominant during the growth phase of the blooms, when TEP volume concentration was lower than 20 ppm. The hypotrichous ciliate Euplotes spp. emerged and became dominant after blooms peaked, when TEP concentration reached values between 20 and 50 ppm. The succession from Strombidium spp. to Euplotes spp. was closely related to TEP variation. Strombidium spp. depletion was apparently not caused by a reduction of prey availability due to TEP aggregation, as the bacterial concentration increased over time and the fraction of available bacteria for Strombidium spp. remained close to 90%, irrespective of variations in TEP concentration. Instead, the results of incubations conducted by adding S. sulcatum to seawater collected in the mesocoms suggest that Strombidium spp. disappearance may have been caused by direct TEP-mediated aggregation of the ciliates. The emergence of Euplotes spp. coincided with the formation of macroaggregates (favored by high TEP concentration), which provide them with the physical support required for feeding on attached bacteria. Our results suggest that variations of the size in the TEP pool may induce a ciliate population succession, modify the size distribution of the bacterial population and ultimately control the microbial food web structure and function.
KEY WORDS: Transparent exopolymeric particles · Phaeocystis globosa · Ciliates · Strombidium · Euplotes · Succession · Microbial food web · Bacteria
trophic status of the area (Passow & Alldredge 1994, Passow et al. 1994, Kiørboe et al. 1998, Mari & Burd 1998) and on phytoplankton bloom dynamics (Mari & Kiørboe 1996, Mari & Burd 1998, Mari et al. 2001). Due to their physico-chemical properties TEP play a key role in coagulation processes (Kiørboe & Hansen 1993, Dam & Drapeau 1995, Mopper et al. 1995, Passow & Alldredge 1995, Hansen & Kiørboe 1997). Conse-quently, variations in the size of the TEP pool affect the overall particle size spectra by increasing aggregation rates and efficiency (Alldredge & Jackson 1995, Jack-son 1995, JackJack-son & Burd 1998).
As most protozooplankton select their food according to size (Bernard & Rassoulzadegan 1990, Epstein & Shiaris 1992, Sherr et al. 1992, Simek & Chrzanowski 1992, Simek et al. 1994, 1995, 1997, Pernthaler et al. 1996), selective removal of picoplankton-size particles (e.g. bacteria for bacterivorous protozoans) should de-pend both on the intrinsic particle size and on its stage of aggregation (i.e. inclusion into aggregates and size of the aggregates). As particle size spectra are modified via TEP-mediated coagulation processes, food abun-dance for a given ciliate group may be affected by changes in TEP volume concentration. Mari & Ras-soulzadegan (2004, this volume) showed that the avail-ability of picoplankton-size particles for the ciliate Strombidium sulcatum was reduced when TEP volume concentration increased. Whether changes in TEP con-centration in the field modify the structure of the micro-bial food web is still unknown. Enhanced TEP concen-tration may disadvantage heterotrophic bacterivorous ciliates, such as Strombidium spp., by aggregating their food source (Mari & Rassoulzadegan 2004) and the sub-sequent formation of large aggregates may favor the emergence of ciliate groups adapted to macroaggre-gate-rich environments, such as Hypotrichida ciliates (Caron et al. 1982, Davoll & Silver 1986, Artolozaga et al. 2000, Woerner et al. 2000).
The aim of this work was: (1) to study changes in the ciliate community structure as a function of TEP con-centration during Phaeocystis globosa blooms, (2) to examine the repartition of the bacterial population over the size spectra in order to assess the availability of bacteria for micro-grazers, and (3) to discuss the role of TEP produced during P. globosa blooms in the com-munity structure of microbial food webs.
MATERIALS AND METHODS
Mesocosms. Three 850 l indoor mesocosms were filled with natural coastal North Sea water enriched with nitrate and phosphate in order to reach the fol-lowing initial N:P ratios: 16 (40:2.5 µM, Mesocosm 1), 4 (40:10 µM, Mesocosm 2) and 44 (66:1.5 µM, Mesocosm
3). No silicate was added. Total concentrations of the limiting nutrient were determined in order to reach similar a Phaeocystis globosa biomass in all 3 meso-cosms. P. globosa were grown at 15°C, with a 12 h light:12 h dark cycle and under a light intensity of 150 µE m–2 s–1. Each mesocosm was inoculated with 1% v/v of an exponentially growing P. globosa culture at the beginning of the experiment. The water in meso-cosms was kept in motion to prevent sedimentation and wall growth (C. P. D. Brussaard et al. unpubl. data). Chlorophyll a data were provided by C. P. D. Brussaard et al. (unpubl. data). This study was part of a large joint effort aimed at investigating the effect of nitrogen to phosphorus ratios on P. globosa bloom dynamics during a mesocosm study. Since our objec-tives within this framework were to describe the effect of TEP pool accumulation on the ciliate community structure, the eutrophication issue was not examined. In our study, we consider the mescosms as experimen-tal triplicates of the role of TEP as a factor controlling the ciliate community structure.
Samples for determination of TEP, bacteria and cili-ates were collected from inside each mesocosm during 5 sampling occasions covering the main phases of Phaeocystis globosa blooms, i.e. initial phase, early exponential phase, late exponential phase, senescent phase and post senescent phase (i.e. when chlorophyll a concentration reached pre-bloom levels). All samples were immediately filtered for TEP and bacteria slides preparation (see following sections).
Incubations.Incubations, aimed at determining the role of TEP as a loss factor for the ciliate Strombidium sulcatum, were conducted in triplicate with seawater collected from each mesocosm during the 5 sampling occasions described above (a total of 45 incubations were conducted). Prior to incubation with S. sulcatum, seawater was pre-filtered through a 200 µm mesh in order to remove large aggregates and mesozooplank-ton. The ciliate S. sulcatum was added to 250 ml sub-samples to yield a final concentration of ca. 10 ciliates ml–1(initial concentration ~1000 ml–1). Prior to inocula-tion,S. sulcatum were maintained in stationary-phase on a wheat-grain media at 15°C. Incubations were conducted at 15°C under continuous light intensity (150 µmol photon m–1s–1) and the bottles were gently shaken twice a day. Time-course samples were taken at 24 h intervals for 2 d. S. sulcatum was counted in 100 ml sub-samples fixed with alkaline Lugol’s solu-tion (final conc. 2%) and refrigerated until analysis. Blanks were prepared as above without addition of cil-iates, but with ciliate growth media, filtered by gravity onto 0.4 µm polycarbonate filters.
TEP determination. TEP slides were prepared fol-lowing Passow & Alldredge (1994). Aliquots (2, 5 and 10 ml) of each sample were filtered through 0.2 µm
Mari et al.: Role of TEP. II. Ciliate community structure
polycarbonate filters (Osmonics, Poretics), in order to avoid potential artifacts linked to coagulation in the fil-ter funnel (Mari & Kiørboe 1996). TEP retained on the filter were stained with 500 µl of a solution of Alcian Blue, and transferred to a microscope slide using the Filter-Transfer-Freeze technique (Hewes & Holm-Hansen 1983). For each slide, 10 images were taken under the microscope at 100×, 200×and 400× magnifi-cations using a digital camera. For each image, all TEP were counted and sized using a semi-automatic image-analysis system. The cross-sectional area of each TEP was measured, and its equivalent spherical diameter (ESD) was calculated. For each sample, counts from the 3 magnifications were combined and TEP were classified according to their ESD into 20 logarithmic size classes (Mari & Burd 1998). TEP size distributions were described using a power relationship (Mari & Rassoulzadegan 2004).
Bacterial concentration. The abundance of non-attached bacteria (so called 'free') in each mesocosm was determined in 5 ml samples filtered onto 0.2 µm pore polycarbonate black filters after fixation with glu-taraldehyde (final conc. 1%) and staining with DAPI for 10 min (final conc. 0.5 µg ml–1) (Porter & Feig 1980, King & Parker 1988). Free bacteria were counted in 10 fields on each slide with an epifluorescence micro-scope at 1000× magnification. Total bacterial abun-dances were determined using flow cytometry (Facs-Calibur, Becton Dickinson) according to Marie et al. (1999) (C. P. D. Brussaard et al. unpubl. data).
TEP-attached bacteria and bacteria fraction avail-able for ciliate grazing. The number of TEP-attached bacteria was estimated for each sample by combining the TEP size spectra with a relationship between TEP size and number of attached bacteria. Since this rela-tionship was not established during the present study, we used a relationship obtained from re-examination of data from Mari & Kiørboe (1996). During their study of a spring bloom, the number of TEP-attached bacte-ria (n) scaled with TEP size (diameter, d; µm) raised to an exponent of 1.48 (n = 0.45 d1.48; r2= 0.82; n = 340) during the growth phase of the bloom and of 1.05 (n = 1.38 d1.05
; r2 = 0.67; n = 140) during the senescent phase, i.e. after the bloom peaked. Since no other study has provided tools that allow prediction of the fraction of TEP-attached bacteria from TEP size spec-tra, the above relationships were used.
Ciliate concentration and community composition. For ciliate counts and group determination in each mesocosm and during the incubations with Strombid-ium sulcatum, 100 ml samples were fixed with alkaline Lugol’s solution (final conc. 2%) and refrigerated until analysis. Aliquots were settled for >12 h in a 10 ml Hydrobios chamber. The total surface area of the chamber was examined at 200×magnification using an
inverted microscope. For protistan concentration and community composition in the mesocoms, all the cili-ates were enumerated and the different groups identi-fied according to their morphological characteristics. During the incubations with S. sulcatum, the fraction of ciliates attached to mucous aggregates was estimated only for the added ciliate species, in order to distin-guish between ciliates that may become attached to aggregates during preparation and handling of the fixed samples (considered as artifacts) and the ciliates that naturally become attached to mucous aggregates (due to TEP stickiness).
RESULTS
TEP concentration and TEP size spectra TEP occurred in significant concentrations (i.e. > 5 ppm) on all sampling occasions and in all meso-cosms (Fig. 1). TEP volume concentration increased con-tinuously from Day 0 to Day 20, from 5.4 to 118.5 ppm, 6.1 to 76.1 ppm and 5.9 to 115.9 ppm in Mesocosms 1, 2 and 3, respectively. TEP volume concentrations were low until Day 9 in all mesocosms (approximately 5 ppm) and increased after Phaeocystis globosa blooms peaked, i.e. during the senescent phase of the blooms (119, 76, and 116 ppm in Mesocosms 1, 2 and 3, respectively).
For all sampling occasions, the power relationship fitted the TEP size spectra well. In Mesocosms 1 and 2, the spectral slope, δ, increased significantly (p < 5%) from Day 2 to Day 18 (from –3.96 to –2.38 and from –4.38 to –2.11 for Mesocosms 1 and 2, respectively), i.e. the fraction of large TEP increased. Although δ re-mained relatively constant in Mesocosm 3 during the course of the bloom, large TEP were produced between Day 2 and Day 14 (i.e. larger TEP appeared between successive sampling occasions).
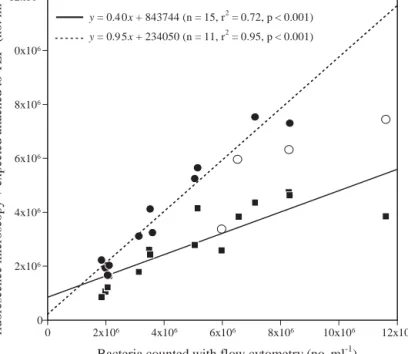
Free, attached and total bacterial concentration Bacterial concentration obtained using flow cytome-try was compared with predicted total bacterial con-centration estimated as the sum of microscope counts of free bacteria and expected number of TEP-attached bacteria. We excluded data for which the slope, δ, of the TEP size spectra was > –3 from the regressions, because when the fraction of large TEP increases (i.e. when δincreases) large TEP distribution is too sparse and counting statistics may become inaccurate and uti-lizing these data may, thus, introduce an error when estimating the number of attached bacteria. Free bac-terial concentrations, determined using epifluorescence microscopy, represented 59 ± 13% of the total bacter-25
ial population, and TEP-attached bacteria represented ~40% (slope of bacterial concentration estimated by microscopy versus bacterial concentration estimated by flow cytometry; Fig. 2). Comparison between pre-dicted and observed total bacterial concentrations
showed that attachment to TEP explains up to 95% of the observed total bacterial concentration (Fig. 2).
In all mesocosms, bacterial concentrations (total observed, total expected or free) were positively cor-related to TEP concentration (Fig. 3). Estimates of the fraction of bacteria available for proto-zoans, as a function of the maximum particle size on which a given group can graze upon, were obtained by combining TEP size spectra from the 3 mesocosms and the TEP size versus number of attached bacteria relation-ships. Depending on food size-selec-tivity, over the size range investigated (particles < 12 µm), 73 to 97% of the total bacterial population is available for protozoan grazing (Fig. 4).
Protistan community composition and concentration
Strombidium spp. and Euplotes
spp. (mainly E. vannus) dominated the mesocosms at different stages of Phaeocystis globosa blooms (Fig. 5). A few Tintinnids and Mesodinium spp. were also observed, but their abun-dance remained very low (< 2 ml–1) and their occurrence was not correlated to variations in TEP volume concentration. In Mesocosms 1 and 3, the concen-tration of Strombidium spp. was high (from 5 to 20 ml–1) and dominated the protistan community until TEP volume concentration rose from less than 10 ppm up to ~40 ppm (Days 10 to 12); thereafter Euplotes spp. emerged. For TEP volume concentration > 40 ppm, Strombidium spp. simply disappeared, while Euplotes spp. became the domi-nant species with concentrations rang-ing from 5 to 12 ml–1.
In Mesocosm 2, the protistan com-munity behaved somewhat differently, as Strombidium spp. did not disappear when TEP volume concentration reached > 40 ppm, but only slightly de-creased. Euplotes spp. also emerged when TEP volume concentration reached ~40 ppm and thereafter domi-nated the ciliate community with con-centrations as high as 44 ml–1.
Variations in the relative percent-ages of Strombidium spp. and Euplo-Mesocosm 1
100 101 102
TEP size spectrum
d N /d[dp] (no. ml -1 µ m -1 ) 100 101 102 103 104 105 106 107 Day 2 δ = -3.96 log k = 6.40 r2 = 0.99 5.4 ppm 100 101 102 100 101 102 103 104 105 106 107 Day 6 δ = -3.88 log k = 6.40 r2 = 0.97 7.9 ppm 100 101 102 100 101 102 103 104 105 106 107 Day 12 δ = -3.26 log k = 6.20 r2 = 0.97 46.4 ppm 100 101 102 100 101 102 103 104 105 106 107 Day 15 δ = -2.93 log k = 6.34 r2 = 0.99 77.5 ppm TEP ESD, dp (µm) 100 101 102 100 101 102 103 104 105 106 107 Day 18 δ = -2.38 log k = 5.65 r2 = 0.97 99.2 ppm Mesocosm 2 100 101 102 Day 2 δ = -4.38 log k = 6.72 r2 = 0.99 6.1 ppm 100 101 102 Day 6 δ = -3.99 log k = 6.68 r2 = 0.98 11.3 ppm 100 101 102 Day 14 δ = -3.21 log k = 6.10 r2 = 0.97 20.5 ppm 100 101 102 Day 16 δ = -2.92 log k = 6.09 r2 = 0.96 58.2 ppm TEP ESD, dp (µm) 100 101 102 Day 18 δ = -2.11 log k = 5.17 r2 = 0.99 76.1 ppm Mesocosm 3 100 101 102 Day 2 δ = -3.35 log k = 5.90 r2 = 0.98 5.9 ppm 100 101 102 Day 6 δ = -3.16 log k = 5.91 r2 = 0.97 9.5 ppm 100 101 102 Day 10 δ = -3.02 log k = 5.99 r2 = 0.99 37.0 ppm 100 101 102 Day 12 δ = -3.15 log k = 6.26 r2 = 0.99 46.9 ppm TEP ESD, dp (µm) 100 101 102 Day 14 δ = -3.09 log k = 6.35 r2 = 0.98 101.8 ppm
Fig. 1. Differential transparent exopolymeric particle (TEP) size distribution and TEP volume concentrations during bloom growth under contrasting N:P molar ratios. Regression lines were fitted to the data using dN/d[dp] = kdpδ, where dp
is the equivalent spherical diameter (ESD) and dN is the number of TEP
par-ticles per unit volume and per size class (no. ml–1µm–1) in the size range d pto
Mari et al.: Role of TEP. II. Ciliate community structure
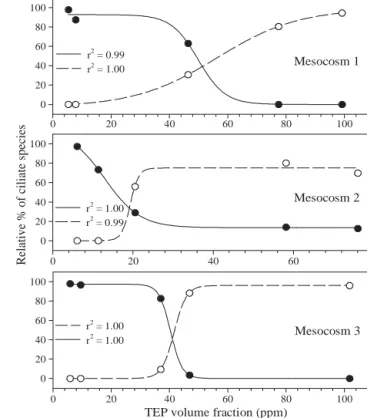
tes spp. were closely correlated with changes in TEP volume concentration (Fig. 6). The inversion point (i.e. from Strombidium spp. to Euplotes spp. dominance) coincided with the early senescent phase of the blooms and the concomitant increase in TEP volume concentration (ultimately leading to the formation of large marine snow aggre-gates).
Incubations with Strombidium sulcatum After 24 h of incubation, the percentage of Strombidium sulcatum attached to mucous ag-gregates increased from 13 to 20% to a maxi-mum of 37 ± 8% in seawater collected at Day 14 (Fig. 7). For the incubations conducted with seawater collected from Mesocosms 1 and 2 at Day 18 (during the senescent phase of the blooms), the percentage of S. sulcatum attached to mucous aggregates decreased drastically. In the mean time, the fraction of S. sulcatum still present in the medium (calculated as a function of initial concentration and for the 15 incuba-tions) decreased to 51 ± 22% after 24 h and to 37 ± 18% after 48 h. S. sulcatum associated with large mucous aggregates were both present at their surface and embedded inside them (Fig. 8), suggesting that they were trapped rather than intentionally sitting on aggregates.
The percentage of Strombidium sulcatum at-tached to aggregates after 24 h of incubation cor-related positively with TEP volume concentration, 27
Bacteria counted with flow cytometry (no. ml-1)
0 2x10⁶ 4x10⁶ 6x10⁶ 8x10⁶ 10x106 12x106
Bacteria counted by epifluorescence microscopy and by
epi-fluorescence microscopy + expected attached to TEP
(no. ml -1 ) 0 2x10⁶ 4x10⁶ 6x10⁶ 8x10⁶ 0x106 12x106 y = 0.4 0x + 843744 (n = 15, r2= 0.72, p < 0.001) y = 0.9 5x + 234050 (n = 11, r2 = 0.95, p < 0.001)
Fig. 2. Phaeocystis globosa. Comparison between total bacterial
concentration (BactTotal; estimated by flow cytometry) and free
bacterial concentration (BactFree; estimated by epifluorescence
microscopy, squares), and expected total bacterial concentration (BactExpected Total; calculated as BactFree + BactExpected Attached to TEP,
circles). Regression lines have been fitted to the data, but utilizing only data described by closed symbols
TEP volume concentration (ppm)
101 102
Bacteria (no. ml
-1)
106 107
Fig. 3. Correlation between TEP volume concentration and the concentrations of: free bacteria (squares) (r2= 0.73; n = 15;
p < 0.001), total bacteria measured by flow cytometry (tri-angles) (r2= 0.84; n = 15; p < 0.001), and expected total
bac-teria (circles) (r2= 0.75; n = 11; p < 0.001). Regression lines
have been fitted to the data, but utilizing only data described by closed symbols TEP < 1.5 µm TEP < 2.1 µm TEP < 3.0 µm TEP < 4.2 µm TEP < 6.0 µm TEP < 8.4 µm TEP < 1 2.0 µm % bacteria available 0 10 20 30 40 50 60 70 80 90 100
Fig. 4. Fraction of bacteria available for ciliate grazing accord-ing to the possible maximum aggregate size the ciliate Strom-bidium sulcatum can graze upon. The selected sizes (i.e. from
1.5 to 12.0 µm) correspond to the medium size of the TEP logarithmic size classes in the small size range
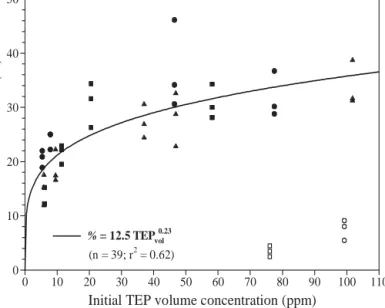
and the fraction of attached ciliates scaled with TEP volume raised to an exponent of 0.23 (Fig. 9), i.e. as the TEP pool accumulates, a larger fraction of the S. sulca-tum population may become attached. We excluded the results obtained during the incubations with sea-water collected from Mesocosms 1 and 2 on Day 18 from the regression analysis.
DISCUSSION
Partitioning of the bacterial population The bacterial population in aquatic systems usually appears as both free and attached to particles, and estimations of the attached fraction vary from less
Days 0 2 4 6 8 10 12 14 16 18 20 0 2 4 6 8 10 12
Ciliate spp. concentrations (no. ml
-1 ) 0 10 20 30 40 50 60 Strombidium spp. Euplotes spp. Tintinnids Mesodinium spp. 0 5 10 15 20 25 30 35 Mesocosm 1 Mesocosm 2 Mesocosm 3 0 20 40 60 80
Relative % of ciliate species
0 20 40 60 80 100 r2 = 1.00 r2 = 0.99 0 20 40 60 80 100 0 20 40 60 80 100 r2 = 0.99 r2 = 1.00
TEP volume fraction (ppm)
0 20 40 60 80 100 0 20 40 60 80 100 r2 = 1.00 r2 = 1.00 Mesocosm 1 Mesocosm 2 Mesocosm 3 Days 0 2 4 6 8 10 12 14 16 18 20 Attached S. sulcatum (%) 0 10 20 30 40 50
Fig. 7. Strombidium sulcatum. Temporal variations of the
per-centage attached to mucous aggregates after 24 h of
incuba-tion for Mesocosms 1 (d), 2 (j) and 3 (m) Fig. 8. Strombidium sulcatum. Examples (shown by arrows) attached to a macroaggregate
Fig. 6. Correlation between TEP volume concentration and relative percentage (dP) of Strombidium spp. (d) and
Eu-plotes spp. (s). Sigmoidal regression lines (dP/d[TEPvol] =
a{1+e–[(TEPvol – TEPvol0)/b]}–1) have been fitted to the data for each
mesocosm Fig. 5. Temporal variations of protozoan community
composi-tion in Mesocosms 1, 2 and 3 (note the different scales of the
Mari et al.: Role of TEP. II. Ciliate community structure
than 10% up to 90% of the total population (Bell & Albright 1981, Robertson & Newell 1982, Alldredge & Youngbluth 1985, Albright et al. 1986, Alldredge et al. 1986, Herndl 1988). While the fraction of free bac-teria is easily accessible microscopically, an estimate of the attached fraction is more difficult to obtain since it requires determination of the size distribution of the particles hosting bacteria and establishment of a relationship between the size of the particles and the number of attached bacteria. Therefore, for con-venience and because large aggregates hosting bac-teria are under-represented when studied in a lim-ited number of fields at 1000× magnification, the number of bacteria attached to organic aggregates is generally not determined microscopically (espe-cially when the concentration of large aggregates is high).
The number of TEP-attached bacteria was estimated from the TEP size spectra using the TEP size versus number of TEP-attached bacteria relationship ob-tained by compiling data recorded in the Kattegat (from Mari & Kiørboe 1996). Although this relationship can only provide a crude estimate of the fraction of TEP-attached bacteria, this approach allowed us to confirm the hypothesis that attachment to TEP could explain the difference between free (determined microscopically) and total (determined by flow cyto-metry) bacterial populations. Therefore, the combined use of both methods can help to describe the structure of the bacterial population.
In the present study, the fraction of attached bacteria was ~40% of the total bacterial population, which is high compared to previous estimates (i.e. average val-ues from 0.5 to 25%; Passow & Alldredge 1994, Schus-ter & Herndl 1995, Mari & Kiørboe 1996). Our results support the hypothesis that the fraction of attached bacteria may increase along productivity gradients (Schuster & Herndl 1995), as the Phaeocystis globosa mesocosms were highly eutrophic systems (i.e. TEP concentration up to 100 ppm and chlorophyll a concen-trations > 20 µg l–1; C. P. D. Brussaard et al. unpubl. data).
Succession of protists: influence of TEP concentration The present study suggests that TEP concentration is a significant controlling factor of the ciliate community structure. The ciliate Strombidium spp. dominated the protozoan community in all mesocosms when TEP concentration was relatively low (i.e. < 20 ppm), while the ciliate Euplotes spp. became dominant in all meso-cosms when TEP concentration reached a critical value (from 20 to 50 ppm). However, the observed difference between the community composition varied among mesocosms, suggesting that additional mechanisms besides TEP volume concentration may be important in structuring the ciliate community.
Strombidium spp. are typical filter feeders feeding on small-suspended food particles, such as nanoflagel-lates, bacteria and, to a lesser extent, picoplanktonic organisms (Allali et al. 1994, Dolan & Sˇimek 1997, Christaki et al. 1998). They have an optimum food particle size of ~3 µm (Fenchel & Jonsson 1988, Bernard & Rassoulzadegan 1990, Mari & Rassoulzade-gan 2004) and are able to graze on free bacteria and aggregates ≤6 µm (Bernard & Rassoulzadegan 1990, Mari & Rassoulzadegan 2004). Additionally, like most Oligotrichina, Strombidium spp. are truly free swim-ming protists and do not usually inhabit aggregates (Artolozaga et al. 2000). During their study of pico-plankton-size prey analog grazing by S. sulcatum as a function of TEP concentration, Mari & Rassoulzadegan (2004) showed that the food size spectrum was modi-fied subsequent to enhanced TEP production and de-monstrated that this process had a negative effect on the studied ciliate, which could ultimately lead to its disappearance. If prey concentration for Strombidium spp. decreases due to transfer of its food source to unreachable size classes, this ciliate population may decline and may gradually be superseded by other populations of ciliates feeding on larger particles or needing to sit on a physical support to feed.
The bacterial population structure (free vs. attached bacteria) was modified due to TEP-mediated aggrega-29
Initial TEP volume concentration (ppm)
0 10 20 30 40 50 60 70 80 90 100 110 Attached S. sulcatum (%) 0 10 20 30 40 50 % = 12.5 TEPvol0.23 (n = 39; r2 = 0.62)
Fig. 9. Strombidium sulcatum. Percentage attached to mucous
aggregates (%) as a function of TEP volume concentration (TEPvol, ppm) for Mesocosms 1 (d,s), 2 (j,h) and 3 (m).
Re-gression line (% = aTEPvolb) has been fitted to the data, but
tion. However, the fraction of bacteria available for Strombidium spp. was high and relatively constant (ca. 90%), and even increased over the course of the blooms, as bacterial and TEP concentrations were pos-itively correlated. Therefore, reduction of bacteria availability does not seem to be directly responsible for the observed Strombidium spp. disappearance. The results obtained during the incubations conducted with S. sulcatum suggest that attachment to mucous aggregates may act as a loss factor for this ciliate (i.e. S. sulcatum were embedded inside mucous aggre-gates and, thereby, disabled). Assuming that TEP con-trol upon Strombidium spp. abundance is due to their high sticking properties and subsequent direct scav-enging by TEP aggregation, the diminution of the frac-tion of attached S. sulcatum observed for Mesocosms 1 and 2 at Day 18 could be due to a diminution in TEP stickiness or to a bad estimation of the fraction of attached S. sulcatum when aggregates started to age and to become denser (i.e. content hardly identifiable). Euplotes spp. are poor swimmers, commonly found in benthic habitats, and the presence of large mucous aggregates in the water column may help them ‘colo-nize’ the epibenthic zone (and to some extent the pelagic zone). Such colonization may be achieved by swimming from one aggregate to another, using an active reversal response to the food gradient to locate food patches (Jonsson & Johansson 1997). Unlike Strombidium spp., Euplotes spp. prefer to graze on attached bacteria while temporally attached to a solid surface (Albright et al. 1987, Patterson et al. 1993, Artolozaga et al. 1997). Therefore, large marine snow aggregates can be considered as environments in the pelagic zone that support populations with combined features allowing success in both pelagic and benthic systems. This mechanism of colonization may explain why benthic protists, known to be poorly adapted to pelagic lifestyle, are often observed inhabiting marine snow aggregates (Caron et al. 1982, Patterson & Fenchel 1990). Hypotrichous ciliates, such as Euplotes spp. are specifically adapted to inhabit the surface and are known to be abundant in aggregate-rich en-vironments (Caron et al. 1982, Davoll & Silver 1986, Artolozaga et al. 2000, Woerner et al. 2000). An accu-mulation of TEP may, thus, favor the dominance of Euplotes spp. by promoting the formation of macro-aggregates.
Consequences for the microbial food web structure and function
The consequences of high TEP production for the microbial food web structure and function could be divided into 2 processes. First, TEP production and the
subsequent formation of mixed aggregates could act as a ‘trophic elevator’ by providing a direct lift for micrometer-size particles and dissolved organic car-bon to higher trophic levels (Mari & Rassoulzadegan 2004). Second, due to high sticking properties, the TEP-mediated aggregation of active components of the microbial food web (i.e. bacteria, heterotrophic nanoflagellates, ciliates) could cause a ‘trophic jam’ activating the trophic elevator by forcing a detour to higher trophic levels, thus inhibiting the microbial food web. Both mechanisms would minimize the signifi-cance of the microbial trophic web for the transfer of energy from the dissolved phase back to higher trophic levels.
Acknowledgements. This work was supported by the
Euro-pean Commission (Research Directorate General-Environ-ment Programme-Marine Ecosystems) through the BIOHAB project ‘Biological control of harmful algal blooms in Euro-pean coastal waters: role of eutrophication’ (contract EVK3-CT99-00015). BIOHAB project is part of the EC EUROHAB cluster.
LITERATURE CITED
Albright LJ, McCrae SK, May BE (1986) Attached and free-floating bacterioplankton in Howe Sound, British Colum-bia, a coastal marine fjord-embayment. Appl Environ Microbiol 51:614–621
Albright LJ, Sherr EB, Sherr BF, Fallon RD (1987) Grazing of ciliated protozoa on free and particle-attached bacteria. Mar Ecol Prog Ser 38:125–129
Allali K, Dolan JR, Rassoulzadegan F (1994) Culture char-acteristics and orthophosphate excretion in a marine oligotrich ciliate, Strombidium sulcatum, fed heat-killed
bacteria. Mar Ecol Prog Ser 105:159–165
Alldredge AL, Jackson GA (1995) Aggregation in marine systems. Deep-Sea Res Part I 42:1–8
Alldredge AL, Youngbluth MJ (1985) The significance of macroscopic aggregates (marine snow) as sites for hetero-trophic bacterial production in the mesopelagic zone of the subtropical Atlantic. Deep-Sea Res 32:1445–1456 Alldredge AL, Cole JJ, Caron DA (1986) Production of
hetero-trophic bacteria inhabiting macroscopic organic aggregates (marine snow) from surface waters. Limnol Oceanogr 31: 68–78
Alldredge AL, Passow U, Logan BE (1993) The abundance and significance of a class of large, transparent organic particles in the ocean. Deep-Sea Res 40:1131–1140 Artolozaga I, Santamarìa E, Lòpez A, Ayo B, Iriberri J (1997)
Succession of bacterivorous protists on laboratory-made marine snow. J Plankton Res 19:1429–1440
Artolozaga I, Ayo B, Latatu A, Azùa A, Unanue M, Iriberri J (2000) Spatial distribution of protists in the presence of macroaggregates in a marine system. FEMS Microbiol Ecol 33:191–196
Bell CR, Albright LJ (1981) Attached and free-floating bacte-ria in the Fraser River estuary, British Columbia, Canada. Mar Ecol Prog Ser 6:317–327
Bernard C, Rassoulzadegan F (1990) Bacteria or microflagel-lates as a major food source for marine ciliates: possible implications for the microzooplankton. Mar Ecol Prog Ser 64:147–155
Mari et al.: Role of TEP. II. Ciliate community structure
Caron DA, Davis PG, Madin LP, Sieburth JMcN (1982) Hetero-trophic bacteria and bacterivorous protozoan in oceanic macroaggregates. Science 218:795–797
Christaki U, Dolan JR, Pelegri S, Rassoulzadegan F (1998) Consumption of picoplankton-size particles by marine ciliates: effects of physiological state of the ciliate and particle quality. Limnol Oceanogr 43:458–464
Dam HG, Drapeau DT (1995) Coagulation efficiency, organic-matter glues and the dynamics of particles during a phyto-plankton bloom in a mesocosm study. Deep-Sea Res 42: 111–123
Davoll PJ, Silver MW (1986) Marine snow aggregates: life history sequence and microbial community of abandoned larvacean houses from Monterey Bay, California. Mar Ecol Prog Ser 33:111–120
Dolan JR, Sˇimek K (1997) Processing of ingested matter in
Strombidium sulcatum, a marine ciliate (Oligotrichida).
Limnol Oceanogr 42:393–397
Engel A (2002) Direct relationship between CO2uptake and
transparent exopolymer particles production in natural phytoplankton. J Plankton Res 24:49–54
Epstein SS, Shiaris M (1992) Size-selective grazing of coastal bacterioplankton by natural assemblages of pigmented flagellates, colorless flagellates, and ciliates. Microb Ecol 23:211–225
Fenchel T, Jonsson PR (1988) The functional biology of Strom-bidium sulcatum, a marine oligotrich ciliate (Ciliophora,
Oligotrichina). Mar Ecol Prog Ser 48:1–15
Grossart HP, Simon M (1997) Formation of macroscopic organic aggregates (lake snow) in a large lake: the signifi-cance of transparent exopolymer particles, phytoplankton, and zooplankton. Limnol Oceanogr 42:1651–1659 Grossart HP, Berman T, Simon M, Pohlmann K (1998)
Occur-rence and microbial dynamics of macroscopic organic aggregates (lake snow) in Lake Kinneret, Israel, in fall. Aquat Microb Ecol 14:59–67
Hansen JLS, Kiørboe T (1997) Quantifying interspecific co-agulation efficiency of phytoplankton. Mar Ecol Prog Ser 159:75–79
Herndl GJ (1988) Ecology of amorphous aggregations (marine snow) in the Northern Adriatic Sea. II. Microbial density and activity in marine snow and its implication to overall pelagic processes. Mar Ecol Prog Ser 48:265–275 Hewes CD, Holm-Hansen O (1983) A method for recovering
nanoplankton from filters for identification with the micro-scope: the Filter-Transfer-Freeze (FTF) technique. Limnol Oceanogr 28:389–394
Hong Y, Smith WO, White AM (1997) Studies on transparent exopolymer particles (TEP) produced in the Ross Sea (Antarctica) and by Phaeocystis antarctica
(Prymnesio-phyceae). J Phycol 33:368–376
Jackson GA (1995) TEP and coagulation during a mesocosm experiment. Deep-Sea Res Part II 42:215–222
Jackson GA, Burd AB (1998) Aggregation in the marine environment. Environ Sea Technol 32:2805–2814 Jonsson PR, Johansson M (1997) Swimming behaviour, patch
exploitation and dispersal capacity of a marine benthic ciliate in flume flow. J Exp Mar Biol Ecol 215:135–153 King LK, Parker BC (1988) A simple, rapid method for
enumerating total viable and metabolically active bacteria in groundwater. Appl Environ Microbiol 54:1630–1631 Kiørboe T, Hansen JLS (1993) Phytoplankton aggregate for-mation: observations of patterns and mechanisms of cell sticking and the significance of exopolymeric material. J Plankton Res 15:993–1018
Kiørboe T, Tiselius P, Mitchell-Innes B, Hansen JLS, Wisser AW, Mari X (1998) Intensive aggregate formation with low
vertical flux during an upwelling induced diatom bloom. Limnol Oceanogr 43:104–116
Mari X (1999) Carbon content and C:N ratio of transparent exopolymeric particles (TEP) produced by bubbling exu-dates of diatoms. Mar Ecol Prog Ser 183:59–71
Mari X, Burd A (1998) Seasonal size spectra of transparent exopolymeric particles (TEP) in a coastal sea and compar-ison with those predicted using coagulation theory. Mar Ecol Prog Ser 163:63–76
Mari X, Kiørboe T (1996) Abundance, size distribution and bacterial colonization of transparent exopolymeric parti-cles (TEP) during spring in the Kattegat. J Plankton Res 18:969–986
Mari X, Rassoulzadegan F (2004) Role of TEP in the microbial food web structure. I. Grazing behavior of a bacterivorous pelagic ciliate. Mar Ecol Prog Ser 279:13–22
Mari X, Beauvais S, Lemée R, Pedrotti ML (2001) Non-Redfield C:N ratio of transparent exopolymeric particles in the northwestern Mediterranean Sea. Limnol Oceanogr 46:1831–1836
Marie D, Partensky F, Vaulot D, Brussaard CPD (1999) Enu-meration of phytoplankton, bacteria, and viruses in marine samples. In: Robinson JP, Darzynkiewicz Z, Dean PN, Orfao A, Rabinovitch PS, Stewart CC, Tanke HJ, Wheeless LL (eds) Current protocols in cytometry, Suppl 10. John Wiley & Sons, New York, p 11.11.1–15
Mopper K, Zhou J, Ramana KS, Passow U, Dam HG, Drapeau DT (1995) The role of surface-active carbohydrates in the flocculation of a diatom bloom in a mesocosm. Deep-Sea Res 42:47–73
Passow U (2000) Formation of transparent exopolymer par-ticles, TEP, from dissolved precursor material. Mar Ecol Prog Ser 192:1–11
Passow U (2002) Production of TEP by phytoplankton and bacteria. J Phycol 236:1–12
Passow U, Alldredge AL (1994) Distribution, size and bacter-ial colonization of transparent exopolymer particles (TEP) in the ocean. Mar Ecol Prog Ser 113:185–198
Passow U, Alldredge AL (1995) Aggregation of a diatom bloom in a mesocosm: the role of transparent exopolymer particles (TEP). Deep-Sea Res Part II 42:99–109
Passow U, Alldredge AL, Logan BE (1994) The role of partic-ulate carbohydrate exudates in the flocculation of diatom blooms. Deep-Sea Res Part I 41:335–357
Passow U, Shipe RF, Murray A, Pak DK, Brzezinski MA, Alldredge AL (2001) Origin of transparent exopolymer particles (TEP) and their role in the sedimentation of particulate matter. Cont Shelf Res 21:327–346
Patterson DJ, Fenchel T (1990) Massisteria marina Larsen and
Patterson 1990, a widespread and abundant bacterivorous protist associated with marine detritus. Mar Ecol Prog Ser 62:11–19
Patterson DJ, Nygaard K, Steinberg G, Turley C (1993) Het-erotrophic flagellates and other protists associated with oceanic detritus throughout the water column in the Mid North Atlantic. J Mar Biol Assoc UK 73:67–95
Pernthaler J, Sattler B, Sˇimek K, Schwarzenbacher A, Psenner R (1996) Top-down effects on the size-biomass distribution of a freshwater bacterioplankton community. Aquat Microb Ecol 10:255–263
Porter GK, Feig YS (1980) The use of DAPI for identifying and counting aquatic microflora. Limnol Oceanogr 25:943–948 Riebesell U, Reigstad M, Wassmann P, Noji T, Passow U (1995) On the trophic fate of Phaeocystis pouchetii (Hariot):
VI. Significance of Phaeocystis-derived mucus for vertical
flux. Neth J Sea Res 33:193–203
Robertson JR, Newell SY (1982) Experimental studies of 31
particle ingestion by the sand fiddler Uca pugilator (Bosc).
J Exp Mar Biol Ecol 59:1–21
Schuster S, Herndl GJ (1995) Formation and significance of transparent exopolymeric particles in the northern Adri-atic Sea. Mar Ecol Prog Ser 124:227–236
Sherr BF, Sherr EB, McDaniel J (1992) Effect of pro-tistan grazing on the frequency of dividing cells in bac-terioplankton assemblage. Appl Environ Microbiol 58: 2381–2385
Sˇimek K, Chrzanowski TH (1992) Direct and indirect evi-dence of size-selective grazing on pelagic bacteria by freshwater nanoflagellates. Appl Environ Microbiol 58: 3715–3720
Sˇimek K, Vrba J, Hartman P (1994) Size selective feeding by
Cyclidium sp. On bacterioplankton and various sizes of
cultured bacteria. FEMS Microbiol Ecol 14:157–168
Sˇimek K, Bodkova J, Macek M, Nedoma J, Psenner R (1995) Ciliate grazing on picoplankton in a eutrophic reservoir during the summer phytoplankton maximum: a study at the species and community level. Limnol Oceanogr 40: 1077–1090
Sˇimek K, Hartman P, Nedoma J, Pernthaler J, Springman D, Vrba J, Psenner R (1997) Community structure, picoplank-ton grazing and zooplankpicoplank-ton control of heterotrophic nano-flagellates in a eutrophic reservoir during the summer phytoplankton maximum. Aquat Microb Ecol 12:49–63 Stoderegger K, Herndl GJ (1999) Production of exopolymer
particles by marine bacterioplankton under contrasting turbulence conditions. Mar Ecol Prog Ser 189:9–16 Woerner U, Zimmerman-Timm H, Kausch H (2000)
Succes-sion of protists on estuarine aggregates. Microb Ecol 40: 209–222
Editorial responsibility: Otto Kinne (Editor), Oldendorf/Luhe, Germany
Submitted: November 11, 2003; Accepted: May 27, 2004 Proofs received from author(s): September 10, 2004