The Choice of Detecting Down Syndrome: Does Money Matter?
∗Clémentine GARROUSTE†, Jérôme LE‡, Eric MAURIN§
January 28, 2011
Abstract
The prenatal diagnosis of Down syndrome (amniocentesis) presents parents with a complex dilemma which requires comparing the risk of giving birth to an affected child and the risk of losing an unaffected child through amniocentesis-related miscarriage. Building on the specific features of the French Health insurance system, this paper shows that variation in the monetary costs of the diagnosis procedure may have a very significant impact on how parents solve this ethical dilemma. The French institutions make it possible to compare otherwise similar women facing very different reimbursement schemes and we find that eligibility to full reimbursement has a largely positive effect on the probability of taking an amniocentesis test. By contrast, the sole fact of being labelled "high-risk" by the Health system seems to have, as such, only a modest effect on subsequent choices. Finally, building on available information on post-amniocentesis outcomes, we report new evidence suggesting that amniocentesis increases the risk of premature birth and low weight at birth.
KEYWORDS: Amniocentesis Choice, Regression Discontinuity Design
JEL CODES: C010, I120
∗We are very grateful to Françoise Muller and Sophie Dreux for providing data. We also thank seminar participants at PSE, at
CREST, as well as participants at the Nineteenth European Workshop European Workshop on Econometrics and Health Economics (Lausanne). In particular, we thank Maria Dolores De La Mata for her very helpful discussion and comments.
†Paris School of Economics (PSE), 48 Boulevard Jourdan Paris 75014. Phone : (+33 1) 43 13 63 37. Mail : garrouste at pse.ens.fr.
Clémentine Garrouste thanks the AXA Research Fund for financial support.
‡Centre de Recherche en Economie et Statistique (CREST), 15, Boulevard Gabriel Péri Malakoff 92245. Phone : (+33 1) 44 38 37
81. Mail : jerome.le at ensae.fr.
§Paris School of Economics (PSE), 48 Boulevard Jourdan Paris 75014, Phone : (+ 33 1) 43 13 62 63 / Fax : (+ 33 1) 43 13 62 59.
Introduction
Down syndrome is the most frequent chromosomal defect and the main source of children’s mental retardation. In the general population, the average risk of carrying an affected fetus is about one in 700. Parents who wish to know whether their fetus is affected can request a prenatal diagnosis (amniocentesis). This prenatal test produces an unambiguous diagnosis, but costs about 500 euros (about half the minimum wage) and is not systematically
reimbursed by the health system. In addition, the procedure is invasive and may produce complications and
miscarriage. In France, the rate of amniocentesis-related miscarriage is officially estimated at about 1%. In such a context, parental decision-making concerning prenatal diagnosis of Down syndrome represents a very difficult dilemma. It requires comparing the risk of giving birth to an affected child and the risk of complications and miscarriage (i.e. the risk of death of an unaffected child). Parents who are not eligible for the reimbursement also have to take into account the monetary cost of the diagnosis procedure. In most developed countries, a free screening test is proposed to parents in order to help them make their choice. It is based on a simple blood sample taken after 14-18 weeks of pregnancy and provides each mother with an individual probability of an affected fetus. The result of the test is also one of the key factors of eligibility to free prenatal diagnosis. In France, eligibility for amniocentesis reimbursement is indeed restricted to women aged 38 or older and for women whose individual probability of having an affected fetus is initially estimated to be above P =1/250 (i.e. 1/250 being the average probability of an affected fetus for women aged 37). Virtually all parents are faced with the issue of Down syndrome detection, but little is known on whether and how the design of existing detection procedures actually affects their decisions. In fact, little evidence is available on how parents take account of the estimated risks an affected fetus or the potential costs of the amniocentesis. Furthermore, it is not clear whether and how the relationships between risks, costs and the decision to take an amniocentesis test vary across age groups.
In this paper, we shed light on these issues, using a unique French database with exact information on the risk of Down syndrome (as estimated from blood sample after 14 and 18 weeks pregnancy), the mother’s age and amniocentesis decisions for a large sample of pregnant mothers, representative of those who took the free screening test between 2003 and 2007 in the largest French testing center. We build on the specific features of the French health system to develop a Regression Discontinuity (RD) analysis of the causal effect of eligibility for amniocentesis
reimbursement on actual amniocentesis decision1.
To begin with, our data show a very strong discontinuity at the P =1/250 cut-off. The probability of taking 1Generally speaking, RD designs are appropriate whenever a treatment is determined by whether an observed "assignment" variable
(i.e., a variable which cannot be precisely manipulated by individuals, also referred to as a "forcing" variable) exceeds a known cut-off point. In our case, the treatment corresponds to eligibility to amniocentesis reimbursement whereas the "forcing" variable is the result of the free blood test (denoted P ) and the pre-determined cut-off is P =1/250. A recent introduction to RD designs is provided by Lee and Lemieux (2010). Several recent studies in health economics have relied on RD designs, including Bauhoff, Hotchkiss and Smith (2010), Albouy and Lequien (2009) or Arcand and Wouabe (2010).
an amniocentesis test is about 55 percentage points larger for mothers whose estimated risk is just above the 1/250 cut-off than for mothers just below the cut-off. Further investigations reveal that this choice discontinuity is much more significant and perceptible for women below the 38 year-old threshold than for older women (i.e. those aged 38 or more). In other words, the choice discontinuity is perceptible and large only for the age groups whose reimbursement eligibility status changes at the risk cut-off, not for the age groups which are unconditionally eligible. These findings suggest that a relatively modest variation in the monetary costs of the procedure has a significant effect on how parents solve the ethical dilemma between the risk of having an affected child and the risk of losing an unaffected fetus. By contrast, the sole fact of being labelled "high-risk" by the Health system seems to have only a modest effect on women’s decisions. Available data also reveal that elementary increase in the computed risk of Down Syndrome have, as such, a significant positive effect on the probability to take an amniocentesis test. This relationship between computed risk and choice is perceptible within the "low-risk" group as well as within the risk" group of women. This result further confirms that women’s choices are not driven by the sole "high-risk" label given by the system, but involves instead a careful consideration of individual risks. Finally, building on available information on post-amniocentesis outcomes, we provide new evidence on the effect of amniocentesis on miscarriage risk, low weight at birth and premature birth. Both standard OLS and RD estimates suggest that the amniocentesis procedure has a near-zero effect on miscarriage, but that it increases the risk of premature birth and low weight at birth, which may be a consequence of the prenatal stress induced by the procedure (Marteau et al., 1992). However, RD estimates are not very precise, due to the relatively small size of the subsample where post-amniocentesis information is available.
The remainder of the paper is organized as follows. Section 1 describes the French institutional framework. Section 2 describes available data and Section 3 develops a simple graphical analysis of the impact of eligibility for reimbursement on women’s choices. Section 4 presents our regression-discontinuity analysis. Section 5 presents the effect of amniocentesis on subsequent outcomes and Section 6 concludes.
1
Institutional Framework
In France, the detection of Down syndrome involves two steps: a screening test and a prenatal diagnosis procedure. To start with, a screening test is proposed to all pregnant women. The test is performed on a blood sample and involves the analysis of the concentration of two maternal serum markers - beta-human chorionic gonadotropin (β−hCG) and the alpha-fetoprotein (AFP). After 14-18 weeks of pregnancy, high levels of β−hCG and low levels of AFP are associated with an increased risk of Down syndrome. Accepting the blood test requires signing a form explaining its purpose. About 80%-90% of pregnant women actually sign the form and take the screening test. All
tested women are told the result of the test and the corresponding risk of Down syndrome. They then have to decide whether or not to take an amniotic fluid test (AFT, also referred to as amniocentesis). For women aged 38 or more, this AFT test is free, as well as for women whose screening risk is higher than 1/250. By contrast, for women under 38 and with a risk of less than 1/250, amniocentesis is not reimbursed by the French health system
and costs about 500 euros2. Amniocentesis is a medical procedure in which a small amount of amniotic fluid is
extracted from the amniotic sac and the fetal deoxyribonucleic acid (DNA) is examined for genetic abnormalities. The advantage of amniocentesis is that it provides women with an unambiguous diagnosis on whether the fetus is affected by Down syndrome or not. The main disadvantage is that it is an invasive procedure, which may cause complications and increases the risk of miscarriage (Wilson et al. 2007, Tabor et al., 1986). After the result of the screening test, about 10-15% of women decide to take an amniocentesis test. They are required to sign a second form describing the purpose of the amniocentesis and specifying the risks of the procedure. In this document, the risk of amniocentesis-related miscarriage is evaluated at about 1%. After the amniocentesis, virtually all the women who are given a positive Down syndrome diagnosis chose to have an abortion. Overall, one can estimate that the French two-step strategy is able to detect about 75% of affected fetuses.
2
Data
Our administrative database corresponds to the 28,341 screening tests performed between 2003 and 2007 at the Robert Debré hospital in Paris. There are 75 medical centers which are authorized to perform screening tests in
France and Robert Debré is the largest3. For each woman, we have information on the exact individual risk (as
computed from the blood test), as well as the exact age and subsequent amniocentesis decision. As discussed below, information on exact risk and exact age is key to developing a regression discontinuity analysis of the effect of French institutions. With respect to the pre-decision variable, we have information on women’s weight at the time of the screening test as well as their smoking habits and geographical origins. For a subsample of observations, we also have information on some key post-amniocentesis outcomes such as the weight at birth or the gestational age at birth. Table 1 shows some descriptive statistics. About 11% of the sample showed a blood test risk above the 1/250 threshold. About 63% of those in the high-risk group decided to undergo amniocentesis against only about 3% in the low-risk group. Overall, about 10% of the population took an amniocentesis test. Generally speaking, these numbers are consistent with official national data (see the report of the French Haute Autorité de la Santé,
2Personal health insurance only provides reimbursement for additional related fees.
3This center performs the screening tests for seven maternity hospitals located in Paris (Robert Debré, Tenon, Rothschild, Saint
Antoine, Necker, Bichat, Claude Bernard) as well as for three maternity hospitals located in the Parisian suburbs (Louis Mourier in Colombes, Beaujon in Clichy and Jean Verdier in Bondy) plus a couple of smaller maternity hospitals outside the Parisian region (e.g., Yves Le Foll in St Brieuc).
HAS, 2007). The average age of our population is about 30. Women in the high-risk groups are about 4.5 years older than women in the low-risk group, which reflects the well-established fact that the risk of Down Syndrome increases with age (HAS, 2007). By contrast, there is no significant difference in women’s weight nor in women’s smoking habits across high-risk and low-risk groups. Finally, about 0.17% of the population had an affected fetus. Unsurprisingly, the rate is much larger in the high-risk group (1.06%) than in the low-risk group (0.05%). As it turns out, about 72% of the affected fetuses in our sample are in the high-risk group, which corresponds almost exactly to the proportion that is officially targeted by the Health system. In France, prenatal diagnosis has been regulated since 1997 and the national detection rate is estimated at 73% whereas the false-positive rate is estimated at 7% (Muller et al., 2002).
3
Graphical Evidence
Before moving on to more sophisticated econometric analysis, we provide some simple graphical evidence on the impact of reimbursement eligibility on women’s choices. Figure 1 shows the relationship between the risk of Down syndrome calculated after 14 weeks of pregnancy and the probability of subsequent prenatal diagnosis. The X-axis represents the probability P of having an affected fetus (as given by the blood test) whereas the Y -axis represents the probability of choosing amniocentesis after the blood test. The figure reveals a huge discontinuity at the P =1/250 eligibility cut-off. About 60% of women just above the 1/250 cut-off take an amniocentesis test compared to only about 10% of those just below the same eligibility cut-off. This is obviously consistent with the assumption that monetary costs matter, at least for women whose calculated risk is close to the institutional threshold. Another possible interpretation is that the doctor consulted tends to have a different prescriptive behaviour just below and just above the institutional cut-off, i.e. tends to insist on the amniocentesis option mostly for women that are institutionally considered as risky (i.e. above the P =1/250 threshold). Women themselves may be impacted by the sole fact of being labelled "high-risk" by the health system (rather than by the exact P itself). In such a case, the discontinuity observed at the threshold captures not only a reimbursement eligibility effect, but also a "prescription" or "label" effect. One simple way to separate the two mechanisms is to replicate our graphical analysis for the age groups just below and just above the Age=38 threshold. Since all women above the Age=38 threshold are eligible for an amniocentesis reimbursement by the health system regardless of their calculated risk, any discontinuity in their actual choice at the P =1/250 threshold is likely to isolate a pure "prescription" effect. Moreover, the comparison of their choices with those of slightly younger women (i.e., just below the 38 year cut-off) is likely to isolate the pure reimbursement effect. To start with, Figure 2 presents women just below the age threshold (aged 35-37) and shows a discontinuity that is no less significant than the one observed for the whole population. By contrast, Figure
3 gives rates for women just above the threshold (aged 38-40) and reveals a much more continuous pattern, with a much more modest discontinuity at the cut-off. Taken together, these two graphs confirm the very strong effect of reimbursement eligibility on individual choices and suggest that the "prescription" effect is at best modest4. A symmetrical way to put the same result into perspective is to compare the effect of age on choices for different risk groups. Figures 4 and 5 contrast the change in amniocentesis probability at the Age=38 threshold for the group of "high-risk" women (those above the P =1/250 eligibility threshold) with that of the "low-risk" group. In this specification, the Age=38 threshold corresponds to a change in reimbursement eligibility for "low-risk" women only (since all "high-risk" women are eligible regardless of their age). The graphs reveal a significant increase in the probability of taking an amniocentesis test at the age cut-off for the "low-risk" women only. The probability of undergoing amniocentesis is actually about 20 percentage points greater for low-risk women just above the Age=38 cut-off than for low-risk women just below the same cut-off. This discontinuity is all the more suggestive as it plausibly underestimates the true effect of reimbursement eligibility on amniocentesis probability. This is because women who are certain to undergo amniocentesis (regardless of the risks) are likely to be observed in our sample only below the age cut-off5. If these "certain" women were also observed above the age threshold, they would contribute to further increase the amniocentesis probability above the cut-off and the observed relationship between age and amniocentesis would be even more discontinuous. The fact that our sample misses a small fraction of "certain" women above the Age=38 threshold is also reflected in the negative shift observed at this very age cut-off in Figure 4 within the group of "high-risk" mothers. Within this group, reimbursement eligibility does not change at the age cut-off and we should not observe any discontinuity in behaviors. The fact that we actually observe a decline in amniocentesis probability is consistent with the assumption that the fraction of women who are certain to undergo
amniocentesis do not take the test anymore after age 38 6. All in all, the previous graphical analysis suggests a
very significant impact of reimbursement eligibility on individual choice. It also provides interesting insights into how the blood sample calculated risks affect mothers’ choices. Generally speaking, the probability of taking an amniocentesis increases with computed risk. This positive relationships between risks and choices is observed above the P =1/250 cut-off (high-risk group), but also below the cut-off, within the low-risk group. This result holds true for both women below the age 38 cut-off (non eligible) and for women above the same cut-off (eligible). In the 4As discussed by Fajnzylber, Hotz and Sanders (2010), it is likely that the expected benefits of taking an amniocentesis test vary
with age. But it does not entail that the effect of risk on amniocentesis choice should vary with age, nor that these variations should be discontinuous at a given cut-off.
5Above the age cut-off, women who are certain to take an amniocentesis do not have to take the screening test since it does not
affect eligilibility to reimbursement anymore.
6According to the survey Enquête Nationale Perinatale conducted in 2003 by the French ministry of Health about 2.3% of French
pregnant women do undergo amniocentesis without taking a screening test (Blondel et al., 2005). Assuming that these women are all aged 38 or over, it is not difficult to show that missing information for these women generates a downward bias of about 15 percentage points in our evaluation of amniocentesis rate for women aged 38 or more. As it turns out, this is almost exactly the negative shift in amniocentesis rates that we observe in our sample at the age cut-off in the high-risk group.
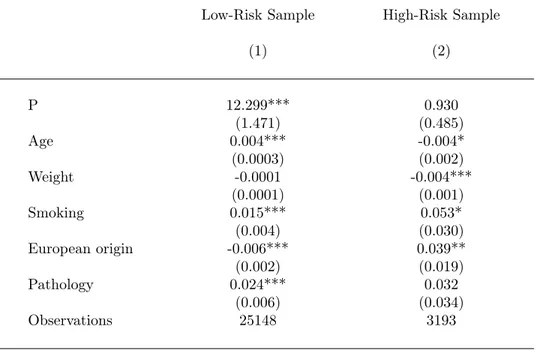
Appendix, we report additional evidence on this issue. Table A1 shows the results of regressing a dummy indicating amniocentesis choice on individual calculated risk (as well as on observed pre-decision characteristics), separately within the low-risk and high-risk groups. This analysis confirms that the individual risk has a positive effect on amniocentesis choice and suggests that this effect is particularly strong within the low-risk group. These results are consistent with a choice model where mothers continue to take account of their individual risks even when the Health system classifies their own risk as negligible and does not provide reimbursement for the subsequent detection procedure. Overall, our graphical analysis reveals that the way parents solve the psychological dilemma raised by the detection of Down syndrome is (a) strongly affected by the institutions which determine eligibility for reimbursement of the diagnosis by the health system, (b) affected in a uniform way by the exact risk of having an affected fetus, with an elementary increase in risk having significant effects even on women labelled as "low-risk" by the system.
4
Reimbursement Eligibility and Amniocentesis : a Regression
Discon-tinuity Design (RDD)
For mother i, we denote Pi the Down syndrome risk (as computed from the initial blood test) and Ei a dummy
indicating actual eligibility to amniocentesis reimbursement. Also, following Imbens and Angrist (1994) and Hahn,
Todd and Van der Klaauw (2001), we denote Ei(P ) the potential eligibility status of mother i given any risk P .
Within the French institutional framework, focusing on mothers aged 37 or less, we have in fact Ei(P ) = 1 if
P ≥ 1/250 and Ei(P ) = 0 otherwise, i.e., there is a sharp discontinuity in the relationship between the forcing
variable P and potential eligibility variable E(P ). Lastly, we define Ai1 the potential amniocentesis decision of
i if i is eligible to reimbursement and Ai0 the same potential outcome if i is not eligible. We are interested in
the causal effect Ai1− Ai0 of eligibility on mothers’ decisions and the fundamental issue is that we never observe
simultaneously Ai1and Ai0. Our identifying strategy exploits the sharp discontinuity in the probability of eligibility at Pc = 1/250. Specifically, we use local linear regressions (see Hahn et al., 2001, or Imbens and Lemieux, 2008). It amounts to selecting the observations within a distance h on either side of the cut-off Pc and estimating the effect
of Ei on Ai as the effect of the discontinuity dummy 1[Pi ≥ Pc] in a regression where we control for a continuous
spline function of Pi (with a knot at Pc),
Ai= a0+ a1Ei+ a2(Pi− Pc) + a31[Pi≥ Pc](Pi− Pc) + ui (1)
and ui the random error term. With respect to the bandwidth size h, we use h = 0.3% as a benchmark and test the robustness of our results to alternative bandwidth choices. Under the assumptions that the potential outcome
E(Ai0|Pi = Pc) is continuous at Pc and the causal effect Ai1− Ai0 is independent P , this strategy provides an
estimates of E(Ai1− Ai0|Pi = Pc), i.e., the average causal effect of reimbursement on a mother’s decision at the
threshold.
In substance, our identifying assumption is that amniocentesis rates would be continuous at Pc if monetary
incentives did not change at this threshold. As it happens, the decision to take an amniocentesis test is potentially impacted by many non-monetary factors (including family history of Down syndrome, religion and social
back-ground), but there is no reason to believe that these factors change discontinuously at Pc. Under this maintained
assumption, any discontinuous change in amniocentesis rates at Pc (as measured by parameter a1) isolates the
average causal impact of reimbursement eligibility on amniocentesis choice for patients at the threshold.
4.1
Regression Results
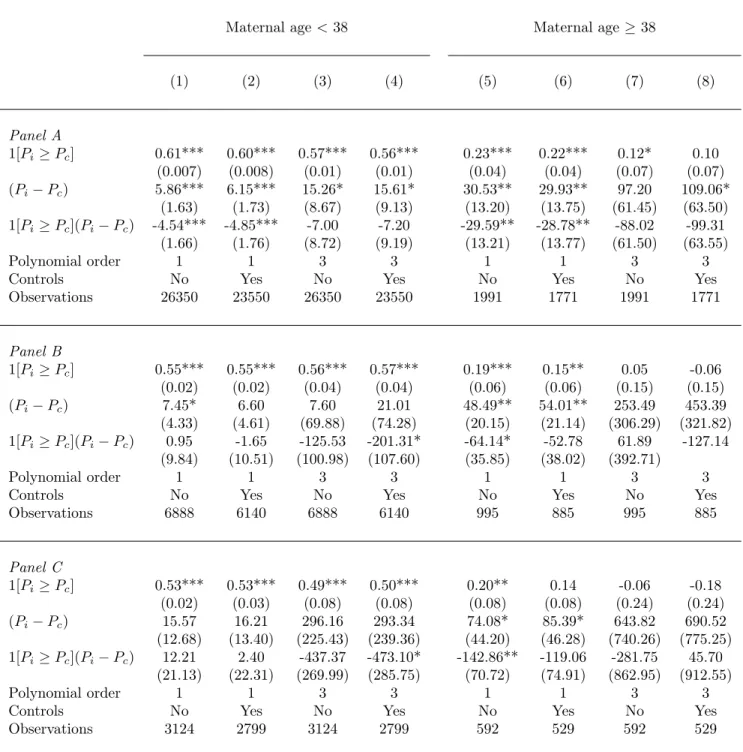
Table 2 shows the results of estimating model (1) separately for women above and below the Age=38 threshold. Columns (1) to (4) correspond to the youngest age group whereas columns (5) to (8) correspond to the oldest. The regression results confirm a highly discontinuous relationships between A and P for the youngest age group, with actual eligibility to reimbursement being, as such, associated with an increase of about 55 percentage points in the probability of taking the amniocentesis. The result remains almost unchanged when we control for observed characteristics of women (column 2) and/or when we control for a continuous spline function of higher degree (columns 3 and 4). This finding is consistent with our working assumption that the distribution of maternal pre-amniocentesis characteristics is continuous at the threshold. Additionaly, results are unaffected regardless of whether we use the full sample (panel A) or subsamples closer to the cut-off point (panel B and C). By contrast, the discontinuity in the relationship between A and P within the older age group is much weaker. When we control for a spline function of degree 3 and for mothers’ observed characteristics, the estimated effect of reimbursement eligibility is not significant at standard level anymore (column 8).
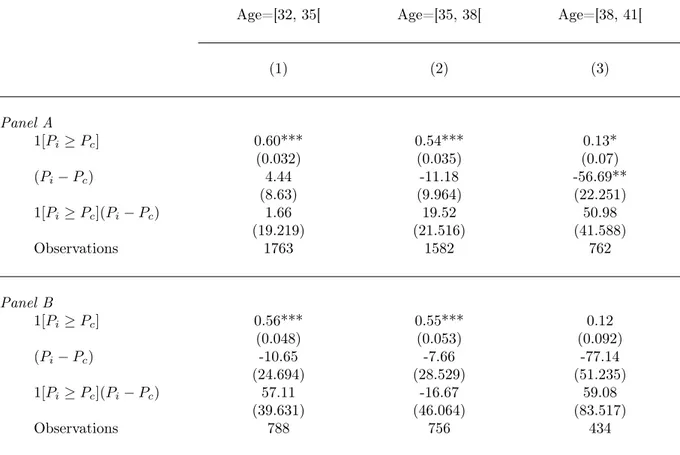
One important question is whether the decline in the effect of eligibility at the P =1/250 threshold occurs precisely at the Age=38 institutional cut-off or whether it reflects a deeper, non-institutional, age effect. To shed light on this issue, we have replicated our regression analysis for two age groups just below the Age=38 threshold and for one age group just above the same age threshold (see Table 3). The regression results confirm a similar, highly discontinuous, relationships between A and P for the two youngest age groups, with actual eligibility to reimbursement being, as such, associated with an increase of about 50 percentage points in the probability of taking
the amniocentesis (columns 1 and 2). By contrast, the discontinuity in the relationship between A and P within the age group just above the age threshold is much weaker and not even significant at standard level (column 3). This result is consistent with the assumption that the high-risk label has, as such, a negligible effect on women’s choices.
4.2
Robustness tests
When using model (1), the identifying assumption is that eligibility for reimbursement is the only factor of amnio-centesis choice which changes discontinuously at the P = 1/250 cut-off. One simple way to explore the credibility of this assumption is to test whether we observe significant discontinuous variation in women’s pre-decision char-acteristics at the P = 1/250 cut-off. To shed light on this issue, Table 4 reports the results of regressing observed pre-decision characteristics (i.e., women’s weight, smoking habits, geographic origin and health, as measured before the screening test) on eligibility status using the same regression design as Tables 2 and 3. Comfortingly, this Table reveals discontinuities in women’s characteristics at the cut-off that are small and non-significant at standard level. The fact that the P = 1/250 cut-off does not correspond to significant change in women’s pre-decision characteris-tics is also reflected in the fact that the estimated effect of reimbursement eligibility in Table 2 is unchanged when we add pre-decision characteristics as an additional control variable.
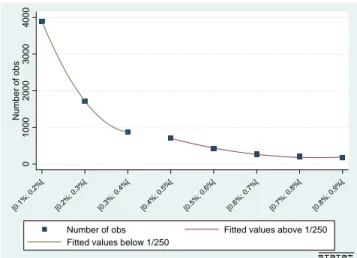
Finally, one of the interesting features of our set-up is that the forcing variable (the calculated risk) cannot be manipulated by agents (pregnant women). Specifically, it is not possible for agents with higher propensity to take an amniocentesis test to manipulate the result of their blood test in order to become eligible. In such a set-up, variation in the number of observations at the cut-off cannot be interpretable as partial manipulation by agents (as conceptualized by McCrary, 2008) and do not threat identification. In Figure 6, we report nonetheless the variation in the number of observations across risk intervals, above and below the institutional cut-off. The density decreases in a quadratic way across intervals, but without any significant discontinuity at the cut-off.
5
Effect of Amniocentesis on Subsequent Outcomes
There is still a significant uncertainty about the effect of amniocentesis on fetus’outcomes (Wilson et al., 2007). In this section, we build on the post-amniocentesis information available in our dataset to provide new evidence on this question. We develop a separate analysis of the effects on miscarriage risk and on outcomes at birth. Economic analyses typically focus on the risks of miscarriage (see e.g., Harris et al., 2004, Seror, 2008). They neglect possible effects on outcomes at birth which may lead to an overestimation of the actual cost-effectiveness of the amniocentesis
procedure.
For a subgroup of medical centers, we have information not only on the amniocentesis decisions, but also on how the pregnancies ended: living at birth, abortion or miscarriage (i.e., the death of the fetus without any medical decision or intervention). Also, when information on the end of pregnancy is available, we get additional information on weight at birth and gestational age at birth in about 50% of cases. In this section, we focus on medical centers
where information on the end of pregnancy is well collected7 and consider in turn the three sub-samples where
information is available on miscarriage (N =10,964), weight at birth (N =4,939) or gestational age (N =4,373) in order to explore the effect of amniocentesis decisions on miscarriage risk, premature birth (i.e., 37 or less completed weeks) or low weight at birth (i.e., less than 2,500 g). Low weight at birth is associated with increased risks of mortality and disability in infancy as well as with lower income and worse health outcomes in adult life according to a variety of studies (see e.g., Conley and Bennett, 2000). It is therefore of particular interest to explore whether the amniocentesis procedure has any effect on this specific outcome8.
To start with, Table 5 shows the result of regressing our three post-amniocentesis outcomes on a dummy indicating whether the mother took an amniocentesis test as well as on a spline function of calculated risks. These basic regressions reveal a weak, marginally significant effect of amniocentesis on miscarriage rates, but a much larger and statistically significant effect on low-weight at birth and premature birth (Columns 1, 3 and 5). Comfortingly, the estimated effects remain almost exactly the same when we use observed pre-amniocentesis characteristics as additional control variables (Columns 2, 4 and 6). Also, the estimated effects are unchanged when we use separately the low-risk or the high-risk subsamples (regressions not reported).
However suggestive they may be, these OLS estimates do not necessarily eliminate the effect of all the unobserved confounding factors that may affect jointly the probability of taking an amniocentesis and the development of the fetus. To further explore the causal effect of an amniocentesis on subsequent outcomes, it is possible to compare outcomes just below and just above the P = 1/250 eligibility threshold. As discussed in the previous sections, the probability of taking an amniocentesis varies in a highly discontinuous way at the eligibility threshold. Under the assumption that potential outcomes are continuous at the threshold, any discontinuity in the relationship between actual outcomes and risk at the threshold identifies the local average effect of the amniocentesis decision. If Yi denotes outcome Y for mother i, the corresponding local linear regression model is,
7Specifically, we focused on the centers where the response rate for how the pregnancy ended is 70% or above. We drop the centers
with lower response rates because they show a small, but significant correlation between availability of information on post-amniocentesis outcomes and eligibility to amniocentesis reimbursement. We have checked that this correlation does not exist anymore when we focus on centers with high response rates.
8Recent evidence on the relationship between amniocentesis and low weight at birth or preterm birth is provided by Cani et al.
Yi= b0+ b1Ai+ b2(Pi− Pc) + b31[Pi ≥ Pc](Pi− Pc) + vi, (2)
and the parameter of interest b1 is identified using the eligibility dummy Ei = 1[Pi ≥ Pc] as an instrumental
variable.
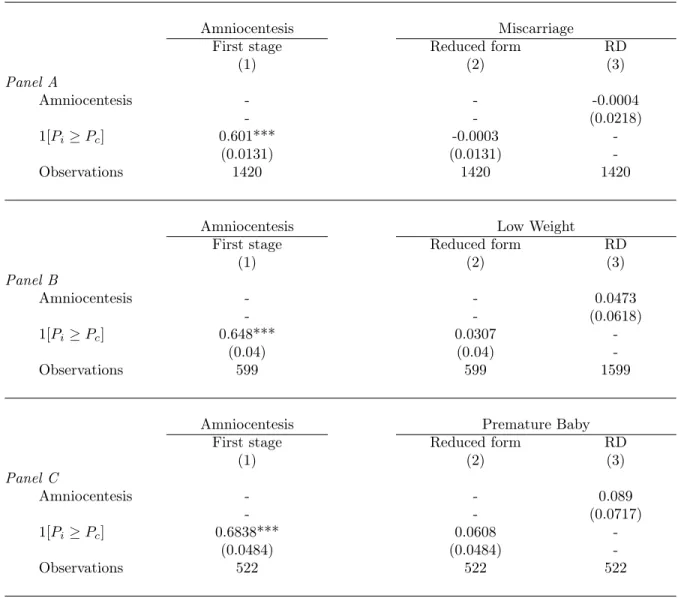
Table 6 shows the result of this RD analysis. The first-stage effects remain very strong even after focusing on the subsamples where information on outcomes is not missing. Specifically, we observe very large shifts in amniocentesis
rates at the Pc cut-off, regardless of the subsample under consideration. With respect to reduced-form and RD
regressions, they are suggestive of a small, near zero effect on miscarriage, which is consistent with recent evidence provided by Eddleman et al. (2006). By contrast, the RD effects of amniocentesis on low-weight at birth and premature birth remain large and positive. Amniocentesis is a source of stress for pregnant women and it is one possible reason for these adverse effects on gestational age and weight at birth9. However, it should be emphasized that (due to the small sample size) our RD effects are not well estimated and statistically non-significant at standard level. The RD effect on low-weight at birth is significant at the 23% level only, whereas the RD effect on premature birth is significant at the 11% level. Further research is needed to confirm that the most problematic effect of amniocentesis is possibly not on miscarriage risk anymore, but on outcomes at birth and the child’s development after the birth.
6
Discussion and Conclusion
The decision to take an amniocentesis depends potentially on many factors, such as individual past experience regarding previous pregnancies, family history of Down syndrome, relationships with doctors etc.. There may also be effects of individual level of education, religion or cultural origins. Given all these potential confounders, it is very difficult to provide a credible evaluation of the specific role of monetary incentives. Simple statistical comparison or simple multivariate OLS analysis are unlikely to isolate their true role since mothers facing different monetary incentives may also be different according to many other non-monetary factors that are typically not observed in available datasets. In this paper, we overcome this issue by exploiting a particular feature of the French Health insurance system that makes it possible to compare otherwise similar women facing very different amniocentesis reimbursement schemes, below and above a predetermined Down syndrome risk threshold. Within this quasi-experimental set-up, we provide evidence that a pregnant woman’s decision whether or not to undergo an 9For an analysis of low-weight at birth as a consequence of maternal stress during pregnancy, see Marmot and Wilkinson (2006) and
the studies cited therein. Direct evidence on the effect of amniocentesis on mothers’ stress is provided by Marteau et al. (1992). For evidence on the relationships between amniocentesis choice and longer-term outcomes, see e.g. Baird et al. (1994).
amniocentesis is very sensitive to monetary incentives. Making a woman eligible for a free prenatal test increases the probability that she will take it by approximately 55 percentage points at the eligibility threshold. We provide robustness checks which confirm that our estimates are not contaminated by confounding factors that may also have changed discontinuously at the eligibility threshold. Furthermore, by comparing adjacent age groups with completely different incentive schemes, we provide additional evidence that this causal effect is a purely monetary one. Overall, the other costs and losses associated to amniocentesis (whose magnitude we do not know) do not seem that high for a large proportion of women since a very significant proportion are sensitive to the monetary incentives.
Available data also reveal that elementary increases in individual risk of Down syndrome are always associated with significant increases in the probability of undergoing an amniocentesis, regardless of whether the mother is assigned by the Health system to the low-risk group or to the high-risk-group. This finding is not consistent with a "prescription model" where women do not understand (or, at least, do not take into account) their individual risk, but only take account of the label given to their situation by the system. The last aim of this paper was to provide a new quantification of the causal effect of the amniocentesis procedure on a fetus’ subsequent development. Building on the highly discontinuous relationship between calculated risk of Down Syndrome (as measured by the blood test) and observed amniocentesis rates, we developed a RD analysis which suggests a near-zero effect of amniocentesis on miscarriage rates, but a large effect of amniocentesis on the probability of low weight at birth. However, due to the small sample size, our RD estimates remain imprecise, in spite of very strong first-stage effects. Further research is needed to better evaluate the social costs of a typical Down syndrome detection institution.
References
[1] V. Albouy and L. Lequien, Does compulsory education lower mortality?, Journal of Health Economics, 28 (2009), pp. 155–168.
[2] J. L. Arcand and E. D. Wouabe, Teacher training and HIV/AIDS prevention in West Africa: Regression discontinuity design evidence from the Cameroon, Health Economics, 19 (2010), pp. 36–54.
[3] P. A. Baird, I. M. L. Yee, and A. D. Sadovnick, Population-based study of long-term outcomes after amniocentesis, The Lancet, 344 (1994), pp. 1134–1136.
[4] S. Bauhoff, D. R. Hotchkiss, and O. Smith, The impact of medical insurance for the poor in georgia: A regression discontinuity approach, Health Economics, published online in Wiley Online Library, (2010). [5] B. Blondel, K. Supernant, C. Mazaubrun, and G. Breart, Enquête nationale périnatale 2003, situation
en 2003 et évolution depuis 1998, Unité de Recherches en Santé Périnatale et Santé des Femmes (INSERM), (2005).
[6] S. Buyukkurt, A. Yuksel, G. Seydaoglu, R. Has, and O. Kadayifci, The effect of amniocentesis on preterm delivery rate in women with uterine myoma, Clinical and Experimental Obstetrics and Gynecology, 37 (2010), pp. 33–36.
[7] C. Cani, E. Bertucci, M. Pati, V. Fenu, S. Latella, and V. Mazza, Second trimester amniocentesis is not a risk factor for very low birth weight (VLBW) and extremely low birth weight (ELBW), Ultrasound in Obstetrics and Gynecology, 36 (2010), pp. 78–79.
[8] D. Conley and N. G. Bennett, Is biology destinity? Birth weight and life chances, American Sociological Review, 65 (2000), pp. 458–467.
[9] K. A. Eddleman, F. D. Malone, L. Sullivan, K. Dukes, R. L. Berkowitz, Y. Kharbutli, T. F. Porter, D. A. Luthy, C. H. Comstock, G. R. Saade, S. Klugman, L. Dugoff, S. D. Craigo, I. E. Timor-Tritsch, S. R. Carr, H. M. Wolfe, and M. E. D’Alton, Pregnancy loss rates after midtrimester amniocentesis, Obstetrical and Gynecological Survey, 62 (2007), pp. 163–164.
[10] E.Fajnzylber, V. Hotz, and S. Sanders, An Economic Model of Amniocentesis Choice, NBER Working Paper No. 16306, (2010).
[11] J. Hahn, P. Todd, and W. Van der Klaauw, Identification and Estimation of Treatments Effects with a Regression-Discontinuity, Econometrica, 69 (2001), pp. 201–209.
[12] R. A. Harris, A. E. Washington, R. F. Nease, and M. Kuppermann, Cost utility of prenatal diagnosis and the risk-based threshold, The Lancet, 363 (2004), pp. 276–282.
[13] HAS, Evaluation des strategies de depistage de la trisomie 21, Haute Autorité de la Santé (HAS), (2007). [14] G. Imbens and J. Angrist, Identification and estimation of local average treatment effects, Econometrica,
62 (1994), pp. 467–475.
[15] G. Imbens and T. Lemieux, Regression discontinuity designs: A guide to practice, Journal of Econometrics, 142 (2008), pp. 615–635.
[16] D. Lee and T. Lemieux, Regression Discontinuity Design in Economics, Journal of Economic Literature, 48 (2010), pp. 281–355.
[17] M. Marmot and R. Wilkinson, Social Determinant of Health, Oxford University Press, (2006), p. 376. [18] T. Marteau, J. Kidd, R. Cook, S. Michie, M. Johnston, J. Slack, and R. Shaw, Psychological effects
of having an amniocentesis: Are these due to the procedure, the risk or the behaviour?, Journal of Psychosomatic Research, 36 (1992), pp. 395–402.
[19] J. McCrary, Manipulation of the running variable in the regression discontinuity design: A density test, Journal of Econometrics, 142 (2008), pp. 698–714.
[20] F. Muller, S. Dreux, J. F. Oury, D. Luton, S. Uzan, M. Uzan, M. Levardon, and M. Dommergues, Down syndrome maternal serum marker screening after 18 weeks’ gestation, Prenatal diagnosis, 22 (2002), pp. 1001–1004.
[21] V. Seror, Fitting observed and theoretical choices - Women’s choices about prenatal diagnosis of Down’s syndrome, Health Economics, 17 (2008), pp. 557–577.
[22] A. Tabor, M. Madsen, E. Obel, J. Philip, J. Bang, and B. Gaard-Pedersen, Randomised controlled trial of genetic amniocentesis in 466 low-risk women, The Lancet, 327 (1986), pp. 1287–1293.
[23] R. Wilson, S. Langlois, and J. Johnson, Taux de perte fetale associée à l’amniocentèse menée au cours du deuxième trimestre, Journal of Obstetrics and Gynaecology Canada, 29 (2007), pp. 591–595.
Table 1: Descriptive Statistics.
Low-Risk Sample High-Risk Sample Full Sample
(P < 1/250) (P ≥ 1/250)
Amniocentesis (%) 3.2 62.8 10.0
P (%) 0.08 1.42 0.23
Affected fetus (%) 0.05 1.06 0.17
Age ≥ 38 (%) 4.5 27.3 7.0
Maternal age (years) 30 34.5 30.5
Mother weight(kg) 64.8 65.4 64.9
Smoking (%) 10.5 9.7 10.4
European Origin (%) 59.3 62.5 59.6
Table 2: The Effect of Reimbursement Eligibility on Amniocentesis Probability. Dependent Variable : Amniocentesis
Maternal age < 38 Maternal age ≥ 38
(1) (2) (3) (4) (5) (6) (7) (8) Panel A 1[Pi≥ Pc] 0.61*** 0.60*** 0.57*** 0.56*** 0.23*** 0.22*** 0.12* 0.10 (0.007) (0.008) (0.01) (0.01) (0.04) (0.04) (0.07) (0.07) (Pi− Pc) 5.86*** 6.15*** 15.26* 15.61* 30.53** 29.93** 97.20 109.06* (1.63) (1.73) (8.67) (9.13) (13.20) (13.75) (61.45) (63.50) 1[Pi≥ Pc](Pi− Pc) -4.54*** -4.85*** -7.00 -7.20 -29.59** -28.78** -88.02 -99.31 (1.66) (1.76) (8.72) (9.19) (13.21) (13.77) (61.50) (63.55) Polynomial order 1 1 3 3 1 1 3 3
Controls No Yes No Yes No Yes No Yes
Observations 26350 23550 26350 23550 1991 1771 1991 1771 Panel B 1[Pi≥ Pc] 0.55*** 0.55*** 0.56*** 0.57*** 0.19*** 0.15** 0.05 -0.06 (0.02) (0.02) (0.04) (0.04) (0.06) (0.06) (0.15) (0.15) (Pi− Pc) 7.45* 6.60 7.60 21.01 48.49** 54.01** 253.49 453.39 (4.33) (4.61) (69.88) (74.28) (20.15) (21.14) (306.29) (321.82) 1[Pi≥ Pc](Pi− Pc) 0.95 -1.65 -125.53 -201.31* -64.14* -52.78 61.89 -127.14 (9.84) (10.51) (100.98) (107.60) (35.85) (38.02) (392.71) Polynomial order 1 1 3 3 1 1 3 3
Controls No Yes No Yes No Yes No Yes
Observations 6888 6140 6888 6140 995 885 995 885 Panel C 1[Pi≥ Pc] 0.53*** 0.53*** 0.49*** 0.50*** 0.20** 0.14 -0.06 -0.18 (0.02) (0.03) (0.08) (0.08) (0.08) (0.08) (0.24) (0.24) (Pi− Pc) 15.57 16.21 296.16 293.34 74.08* 85.39* 643.82 690.52 (12.68) (13.40) (225.43) (239.36) (44.20) (46.28) (740.26) (775.25) 1[Pi≥ Pc](Pi− Pc) 12.21 2.40 -437.37 -473.10* -142.86** -119.06 -281.75 45.70 (21.13) (22.31) (269.99) (285.75) (70.72) (74.91) (862.95) (912.55) Polynomial order 1 1 3 3 1 1 3 3
Controls No Yes No Yes No Yes No Yes
Observations 3124 2799 3124 2799 592 529 592 529
Note: Standard errors in parentheses. * significant coefficients at the 10% confidence level; ** significant coefficients at the 5% confidence level; *** significant coefficients at the 1% confidence level. Columns (1) and (5) correspond
to the regression of amniocentesis choice on a reimbursement eligibility dummy 1[Pi ≥ Pc] and a spline function
of degree 1 of P with a knot at Pc(i.e. model (1) in the text). Columns (2) and (6) include maternal age, weight,
Table 3: The Effect of Reimbursement Eligibility on Amniocentesis Probability, by Age Groups.
Dependent Variable : Amniocentesis
Age=[32, 35[ Age=[35, 38[ Age=[38, 41[
(1) (2) (3) Panel A 1[Pi≥ Pc] 0.60*** 0.54*** 0.13* (0.032) (0.035) (0.07) (Pi− Pc) 4.44 -11.18 -56.69** (8.63) (9.964) (22.251) 1[Pi≥ Pc](Pi− Pc) 1.66 19.52 50.98 (19.219) (21.516) (41.588) Observations 1763 1582 762 Panel B 1[Pi≥ Pc] 0.56*** 0.55*** 0.12 (0.048) (0.053) (0.092) (Pi− Pc) -10.65 -7.66 -77.14 (24.694) (28.529) (51.235) 1[Pi≥ Pc](Pi− Pc) 57.11 -16.67 59.08 (39.631) (46.064) (83.517) Observations 788 756 434
Note: Standard errors in parentheses. * significant coefficients at the 10% confidence level; ** significant coefficients at the 5% confidence level; *** significant coefficients at the 1% confidence level. Table shows the result of regressing amniocentesis choice on a reimbursement eligibility dummy 1(Pi≥ Pc) and a spline function of degree 1 with a knot at Pc(i.e., model (1) in the text) on the subsample of women aged [32; 35[ (column 1) as well as on the subsample aged [35;38[ (column 2) and the subsample aged [38; 41[ (column 3). Panel A focuses on Pi in [0.1%; 0.7%] whereas panel B focuses on Pi in [0.2%; 0.6%].
Table 4: Reimbursement Eligibility and Mother’s Pre-Decision Characteristics.
Women weight Smoking habits Geographical Origin Pathology
(European vs other) (Sick vs good health)
(1) (2) (3) (4) Age groups: Age=[32, 35[ -0.26 -0.04 -0.02 0.03 (Observations=788) (1.296) (0.310) (0.048) (0.025) Age=[35, 38[ 0.88 -0.0003 0.02 -0.02 (Observations=756) (1.337) (0.031) (0.051) (0.027) Age=[38, 41[ 1.36 0.003 0.04 -0.015 (Observations=434) (1.934) (0.037) (0.060) (0.033) All -0.23 0.006 -0.00007 0.02* (Observations=3716) (0.521) (0.012) (0.019) (0.01)
Note: Standard errors in parentheses. * significant coefficients at the 10% confidence level; ** significant coefficients at the 5% confidence level; *** significant coefficients at the 1% confidence level. For each dependent variable and each age group, the table reports the effect of reimbursement eligibility in a model where we control for maternal age, for a spline function of P of degree 3 with a knot at Pc. Regressions are
Table 5: Amniocentesis Effects on Fetus Health (OLS).
Dependent variable Miscarriage Low Weight Premature baby
(1) (2) (3) (4) (5) (6) Amniocentesis 0.0045 0.0046 0.0510*** 0.0499*** 0.0346** 0.0352** ( 0.0037) (0.0038) (0.0124) (0.0123) (0.0153) (0.0152) Age - 0.0002 - -0.0004 - 0.0001 (0.0002) (0.0007) (0.0008) Mother Weight - 0.0000 - -0.0008*** - -0.0003 (0.0001) (0.0002) (0.0003) Origin= Africa - 0.0166*** - 0.0271*** - 0.0084 (0.0030) (0.0096) (0.0116) French Caribbean - 0.0114** - 0.0196 - 0.0777*** (0.0051) (0.0170) (0.0208) Smoking status= Yes - -0.0003 - 0.0275*** - -0.0096 (0.0031) (0.0092) (0.0111) Pathology= Yes - 0.0165* - 0.0761*** - 0.0751*** (0.0085) (0.0238) (0.0276) Observations 10964 10964 4939 4939 4373 4373
Note: Standard errors in parentheses. * significant coefficients at the 10% confidence level; ** significant
coefficients at the 5% confidence level; *** significant coefficients at the 1% confidence level. All
Table 6: Amniocentesis Effects on Fetus Health (RD).
Amniocentesis Miscarriage
First stage Reduced form RD
(1) (2) (3) Panel A Amniocentesis - - -0.0004 - - (0.0218) 1[Pi ≥ Pc] 0.601*** -0.0003 -(0.0131) (0.0131) -Observations 1420 1420 1420
Amniocentesis Low Weight
First stage Reduced form RD
(1) (2) (3) Panel B Amniocentesis - - 0.0473 - - (0.0618) 1[Pi ≥ Pc] 0.648*** 0.0307 -(0.04) (0.04) -Observations 599 599 1599
Amniocentesis Premature Baby
First stage Reduced form RD
(1) (2) (3) Panel C Amniocentesis - - 0.089 - - (0.0717) 1[Pi ≥ Pc] 0.6838*** 0.0608 -(0.0484) (0.0484) -Observations 522 522 522
Note: Standard errors in parentheses. * significant coefficients at the 10% confidence level; ** sig-nificant coefficients at the 5% confidence level; *** sigsig-nificant coefficients at the 1% confidence level. All regressions include maternal age and weight, smoking habits, geographical origin, pathology as
ad-ditional controls as well as a spline function of degree 1 of P with a knot at Pc (i.e. (Pi − Pc) and
1[Pi≥ Pc](Pi− Pc)). Panel A corresponds to the sub-sample with information on miscarriage. Panel B
corresponds to the sample with information on low weight at birth. Panel C corresponds to the sub-sample with information on gestational age at birth. Regressions are conducted on sub-samples restricted to Pi in [0.2%; 0.6%]
Figure 1: Relationship Between Down Syndrome Risk and Probability of Amniocentesis 0 .2 .4 .6 .8 Amniocentesis rates ]0; 0 .1% [ [0.1 %; 0.2 %[ [0.2 %; 0.3 %[ [0.3 %; 0.4 %[ [0.4 %; 0.5 %[ [0.5 %; 0.6 %[ [0.6 %; 0.7 %[ [0.7 %; 0.8 %[ [0.8 %; 0.9 %[ 0.9% and mor e
Amniocentesis rates Fitted values above 1/250 Fitted values below 1/250
Figure 2: Risk and Probability of Amniocen-tesis, women aged 35-37
0 .2 .4 .6 .8 Amniocentesis rates ]0; 0 .1% [ [0.1 %; 0.2 %[ [0.2 %; 0.3 %[ [0.3 %; 0.4 %[ [0.4 %; 0.5 %[ [0.5 %; 0.6 %[ [0.6 %; 0.7 %[ [0.7 %; 0.8 %[ [0.8 %; 0.9 %[ 0.9% and mor e
Amniocentesis rates Fitted values above 1/250 Fitted values below 1/250
Figure 3: Risk and Probability of Amniocen-tesis, women aged 38-40
0 .2 .4 .6 .8 Amniocentesis rates ]0; 0 .1% [ [0.1 %; 0.2 %[ [0.2 %; 0.3 %[ [0.3 %; 0.4 %[ [0.4 %; 0.5 %[ [0.5 %; 0.6 %[ [0.6 %; 0.7 %[ [0.7 %; 0.8 %[ [0.8 %; 0.9 %[ 0.9% and mor e
Amniocentesis rates Fitted values above 1/250 Fitted values below 1/250
Figure 4: Relationship between Amniocente-sis and Age (High Risk Group)
.4 .5 .6 .7 .8 Amniocentesis Rates 30 35 40 45 Maternal age
Amniocentesis rates Fitted values above 38 Fitted values below 38
Figure 5: Relationship between Amniocente-sis and Age (Low Risk Group)
0 .1 .2 .3 .4 Amniocentesis Rates 30 35 40 45 Maternal age
Amniocentesis rates Fitted values above 38 Fitted values below 38
Figure 6: Number of Observations around the Risk Cut-Off
0 1000 2000 3000 4000 Number of obs [0.1 %; 0.2 %[ [0.2 %; 0.3 %[ [0.3 %; 0.4 %[ [0.4 %; 0.5 %[ [0.5 %; 0.6 %[ [0.6 %; 0.7 %[ [0.7 %; 0.8 %[ [0.8 %; 0.9 %[
Number of obs Fitted values above 1/250 Fitted values below 1/250
Appendix
Table A1: The Effect of Risk on Amniocentesis, by Risk Groups.
Dependant variable : Amniocentesis
Low-Risk Sample High-Risk Sample
(1) (2) P 12.299*** 0.930 (1.471) (0.485) Age 0.004*** -0.004* (0.0003) (0.002) Weight -0.0001 -0.004*** (0.0001) (0.001) Smoking 0.015*** 0.053* (0.004) (0.030) European origin -0.006*** 0.039** (0.002) (0.019) Pathology 0.024*** 0.032 (0.006) (0.034) Observations 25148 3193
Note: Standard errors in parentheses. * significant coefficients at the 10% confidence level; ** significant coefficients at the 5% confidence level; *** significant coefficients at the 1% confidence level.