AN1-type zinc
finger protein 3 (ZFAND3) is a
transcriptional regulator that drives Glioblastoma
invasion
Anne Schuster
1
, Eliane Klein
1
, Virginie Neirinckx
1
, Arnon Møldrup Knudsen
2,3
, Carina Fabian
1,4
,
Ann-Christin Hau
1
, Monika Dieterle
1
, Anais Oudin
1
, Petr V. Nazarov
5
, Anna Golebiewska
1
,
Arnaud Muller
5
, Daniel Perez-Hernandez
5
, Sophie Rodius
5
, Gunnar Dittmar
5
, Rolf Bjerkvig
1,4
,
Christel Herold-Mende
6
, Barbara Klink
7,8
, Bjarne Winther Kristensen
2,3
& Simone P. Niclou
1,4
✉
The in
filtrative nature of Glioblastoma (GBM), the most aggressive primary brain tumor,
critically prevents complete surgical resection and masks tumor cells behind the blood brain
barrier reducing the ef
ficacy of systemic treatment. Here, we use a genome-wide interference
screen to determine invasion-essential genes and identify the AN1/A20 zinc
finger domain
containing protein 3 (ZFAND3) as a crucial driver of GBM invasion. Using patient-derived
cellular models, we show that loss of ZFAND3 hampers the invasive capacity of GBM,
whereas ZFAND3 overexpression increases motility in cells that were initially not invasive. At
the mechanistic level, we
find that ZFAND3 activity requires nuclear localization and integral
zinc-
finger domains. Our findings indicate that ZFAND3 acts within a nuclear protein
com-plex to activate gene transcription and regulates the promoter of invasion-related genes such
as
COL6A2, FN1, and NRCAM. Further investigation in ZFAND3 function in GBM and other
invasive cancers is warranted.
https://doi.org/10.1038/s41467-020-20029-y
OPEN
1NORLUX Neuro-Oncology Laboratory, Department of Oncology, Luxembourg Institute of Health, Luxembourg, Luxembourg.2Department of Pathology,
Odense University Hospital, Odense, Denmark.3Department of Clinical Research, University of Southern Denmark, Odense, Denmark.4Department of
Biomedicine, University of Bergen, Bergen, Norway.5Quantitative Biology Unit, Luxembourg Institute of Health, Luxembourg, Luxembourg.6Division of
Neurosurgical Research, Department of Neurosurgery, University of Heidelberg, Heidelberg, Germany.7National Center of Genetics, Laboratoire National de
Santé, Dudelange, Luxembourg.8Functional Tumor Genetics, Department of Oncology, Luxembourg Institute of Health, Luxembourg, Luxembourg.
✉email:[email protected]
123456789
C
ancer cell invasion and ensuing metastasis are a leading
cause of death. Malignant tumors of the brain, including
Glioblastoma (GBM), are characterized by a high invasive
capacity leading to a spread throughout the brain parenchyma
1, a
growth pattern which is largely accountable for the current
therapeutic failure and poor patient outcome. Invasive cells that
migrate away from the tumor core escape surgical resection, are
partially sheltered from radio- and chemotherapy and are not
detected by standard imaging techniques. Furthermore it was
recently shown that glial tumors form multicellular networks
through ultra-long membrane protrusions, so-called tumor
microtubes, that facilitate brain invasion and contribute to
treatment resistance
2,3.
Due to the specific structure of the adult brain, GBM invasion
differs from vascular or lymphathic pathways classically associated
with peripheral metastatic cancer. GBM cells insinuate themselves
in the interstitial space of the neural tissue or migrate along blood
vessels and white matter tracts, relying on basal membranes and
extracellular matrix (ECM) components
4. Although significant
efforts were carried out to elucidate the mechanisms underlying
GBM cell invasion (e.g., cytoskeleton remodeling, secretion of
proteases, intracellular signaling)
5, therapeutic approaches
tar-geting GBM invasion have not heralded any benefit so far and
novel targets regulating the invasive process are actively being
pursued
6–8.
RNA interference screens are powerful tools to uncover gene
function and their contribution to specific cellular phenotypes
9.
Such approaches allowed e.g., the identification of genes involved
in cell migration and invasion in various cancer models
10,11including GBM
12. Here, we applied genome-wide RNA
inter-ference in GBM and identified AN1-Type Zinc Finger protein 3
(ZFAND3) as a key regulator of GBM cell invasion. Zinc
finger
(ZF) proteins are involved in nucleic acid recognition,
tran-scriptional activation, protein folding and assembly, however the
function of ZFAND3 remains unknown. ZFAND3 (also known as
testis expressed sequence 27, Tex27) was initially characterized
during mouse sperm maturation
13,14and was associated with
susceptibility for development of type 2 diabetes in humans
15,16.
We
find that ZFAND3 strongly potentiates invasiveness of GBM
patient-derived cells in vitro, ex vivo and in vivo. We show that
nuclear ZFAND3 expression is increased in the infiltrative
com-partment in GBM patient biopsies and that nuclear localization is
essential for ZFAND3 activity. Finally we identify ZFAND3 as a
transcription factor that regulates expression of adhesion and
invasion-related genes.
Results
RNA interference screen identi
fies ZFAND3 as a candidate
gene involved in GBM invasion. Although GBMs in patients are
invariably invasive, not all patient-derived GBM cells display the
same invasion capacity. Inter-patient differences can be observed
when patient-derived GBM stem-like cells (GSCs) are implanted
into the mouse brain: Non-invasive (NI) cells grow as
circum-scribed tumors displaying aberrant blood vessels and necrosis;
low invasive (LI) cells partially invade into the cortex and traverse
the corpus callosum to the contralateral hemisphere and highly
invasive cells (HI) completely colonize the brain parenchyma of
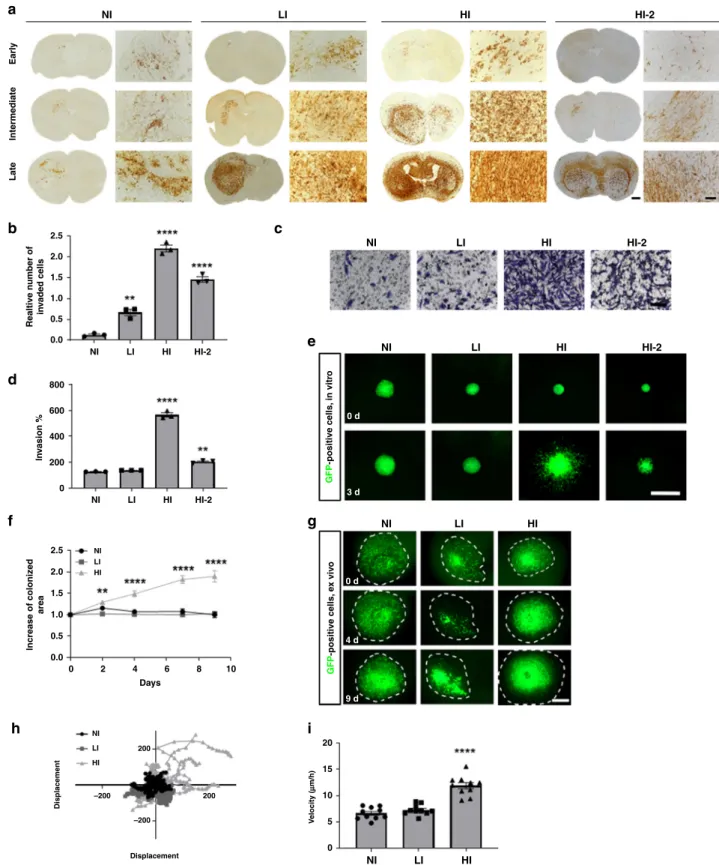
both hemispheres (Fig.
1
a, additional examples on Supplementary
Fig. 1a, b). We have previously described similar histological
phenotypes with differential invasive potential in GBM
patient-derived orthotopic xenografts based on organotypic tumor
spheroids
17. Interestingly the distinct invasive behavior of GSCs
could be recapitulated in vitro, e.g., using 3D-Boyden chamber
assays (Fig.
1
b, c, Supplementary Fig. 1a, b) or sphere sprouting
assays (Fig.
1
d, e). We further confirmed the differential invasive
phenotypes in ex vivo invasion assays in organotypic brain slice
cultures, which allowed to determine differences in single cell
velocity (Fig.
1
f–i). The invasion capacity was correlated to the
expression of some (CDH2, MMP2, SNAI1, ZEB1) but not all
known invasion markers in vitro and in vivo (Supplementary
Fig. 1c–h), but did not correlate to transcriptional GBM subtypes
(proneural, mesenchymal, classical) as defined by Wang et al.
18(Supplementary Fig. 1i). Taken together these data indicate that
patient-derived GSCs faithfully reflect the heterogeneity and
invasion capacity of GBM in vivo, ex vivo and in vitro.
Using highly invasive (HI) GBM GSCs, we performed a
genome-wide loss-of-function shRNA screen to uncover novel
key drivers of GBM invasion. Invasion-defective and
invasion-competent cells were specifically isolated using the Boyden
chamber assay (Fig.
2
a). In highly aneuploid cancer cells, such as
GBM GSCs, RNA interference may be more reliable then CRISPR
based knockout screens, because the transcripts rather than the
DNA are targeted
9. Focusing on the invasion-defective cells,
barcoded shRNAs were sequenced and a stringent bioinformatic
analysis pipeline was applied by combining four of the most
common analysis methods: RSA
19, RIGER
20, MAGeCK
21,22, and
HiTSelect
23(Supplementary Fig. 2a, b). Only the gene candidates
in common between all four methods were selected, resulting in a
set of 17 invasion-essential candidate genes within the 2% top hits
(Fig.
2
b). This included Colony stimulating factor 1 (CSF1), a
known cytokine involved in invasion and metastasis. To further
reduce the number of gene candidates of interest, we analysed the
expression of the 17 genes in NI, LI, and HI cells in vitro and
when grown as xenografts in vivo. Compared to other candidate
genes, the AN1-Type Zinc Finger protein 3 (ZFAND3) gene
showed higher expression in HI cells compared to NI and LI cells,
in vitro as well as in vivo, and corresponding knockdown clones
were enriched in the analysis (Supplementary Fig. 2b–d), we
therefore focused on ZFAND3 for further analysis. Quantitative
real time PCR (qPCR) confirmed a higher expression of ZFAND3
in HI cells, compared to LI and NI (Fig.
2
c).
Immunohistochem-istry of corresponding GBM xenografts in the mouse brain
showed more ZFAND3 positive cells in HI tumors in comparison
to LI tumors (Fig.
2
d). Analysis of TCGA data via the GlioVis
platform
24revealed strong ZFAND3 expression in all classes of
diffuse glioma compared to nontumor controls (Supplementary
Fig. 2e), in line with the high invasive potential of these tumors.
There was no correlation with transcriptional GBM subtypes
(Supplementary Fig. 2f). Pan-tumor studies based on TCGA and
GTEx databases (via GEPIA platform)
25,26also highlighted
increased ZFAND3 expression in diverse cancers compared to
control tissue, in particular in pancreatic adenocarcinoma and
melanoma (Supplementary Fig. 2g). Next we analysed ZFAND3
protein expression in 21 fresh GBM patient biopsies. ZFAND3
protein was detected in the majority of GBM (17/21) and
throughout different tumor compartments, including central,
intermediate and peripheral areas (Fig.
2
e). By
immunofluores-cence, we found that ZFAND3 was present in the cytoplasm and
the nucleus of GBM cells (identified by P53 staining) and we
analysed the fraction of ZFAND3 positive tumor cells based on
subcellular localization (Fig.
2
f and Supplementary Fig. 3a, b).
The fraction of positive cells was similar throughout different
tumor compartments, both for cytoplasmic and nuclear staining
(Supplementary Fig. 3c, d). However, in contrast to cytoplasmic
ZFAND3 staining (Fig.
2
g), we found that both the staining
intensity and the ratio of nuclear/cytoplasmic ZFAND3 staining
were increased in peripheral tumor cells compared to central
cells, indicating that the relative fraction of tumor cells with
nuclear ZFAND3 is higher in the tumor periphery, and that
nuclear ZFAND3 is expressed to a higher extent in these cells
(Fig.
2
h, i). Since ZFAND3 appeared also in nontumor cells, we
a
b
d
c
e
g
f
h
i
NI NI LI LI HI HI HI-2 NI LI HI HI-2 NI 0 d 0 d 4 d 9 d 3 d LI HI NI NI LI LI HI HI HI-2 HI-2 NI NI LI HI NI LI HI 0 2 4 6 Days 200 200 –200 –200 Displacement V elocity ( μμ m/h) Displacement 8 10 LI HI HI-2 Earl y lntermediate Late 2.5 2.0 1.5 1.0 Realtive n umber of in v aded cells 0.5 0.0 2.5 2.0 1.5 1.0 0.5 0.0 20 15 10 5 0 800 600 400 ln v asion % lncrease of coloniz ed area GFP -positive cells, in vitr o GFP -positive cells, e x viv o 200 0Fig. 1 Patient-derived GBM stem-like cells (GSCs) display different invasion phenotypes in vivo, which are recapitulated in in vitro and ex vivo assays. a Early, intermediate and late time point of different GSC orthotopic xenografts in mice displaying non invasive (NI), low invasive (LI) and highly invasive (HI, HI-2) phenotypes. Respective tumor development times were 5 weeks (NI), 8 weeks (LI) and 25 weeks (HI, HI-2). Anti-human vimentin staining was used
to visualize tumor cells (Scale bars= 100 µm and 1000 µm for overview). (n = 2 mice for each tumor and time point with n = 3-4 sections per mouse). b In
vitro Boyden Chamber invasion assay, displaying the relative number of invaded cells (n = 3). c Representative pictures of in vitro Boyden chamber invasion
assay reflecting the different invasion phenotypes. Scale bar 100 µm. d Quantification of invasion of GSCs in 3D sprouting assay (n = 3). e Representative
pictures of sprouting assay of different GFP-positive GSCs (n = 3) (Scale bar = 1000 µm). GFP: Green fluorescent protein. f Quantification of increase of
colonized area of GSCs in ex vivo brain slice cultures, 9 days after tumor implantation (n = 10). g Representative pictures of GSCs in ex vivo brain slice
cultures at day 0, 4, and 9 (Scale bar= 1000 µm). h Displacement of GSCs injected into ex vivo brain slice cultures (n = 10). i Velocity of GSCs in ex vivo
performed colabeling for Iba1 (microglia marker) and NeuN
(neuronal marker). We observed some colocalization with Iba1,
but not with NeuN, both in clinical samples (Supplementary
Fig. 3e) and in xenografts (Supplementary Fig. 3f), indicating that
ZFAND3 is expressed by a subpopulation of microglial cells. The
majority of staining was found in the tumor area rather than in
the neuropil (Supplementary Fig. 3f lower panel). In conclusion,
we identified ZFAND3 as an invasion-related gene that displays
increased nuclear expression in the infiltrative tumor
compart-ment of clinical GBM specimen.
ZFAND3 knockdown impairs GBM cell invasion in vitro,
ex vivo and in vivo. To confirm the functional screen data,
a
d
e
f
g
h
i
b
c
Invasion-defective GBM cells Genome-wide shRNA screenInvasion-competent GBM cells RIGER HitSelect vs RSA MAGeCK 5 4 3 2 ZF
AND3 relative expression
1 0 1.0 0.8 0.6 0.4 Mean intensity (c ytoplasmic) (A U) 0.2 0.0 1.0 3 2 1 0 0.8 0.6 0.4 Mean intensity (nuc lear) (A U) Nuc lear/c ytoplasmic ratio 0.2 0.0 Central Intermediate ns ns ns Periphery
Central Intermediate Periphery Central Intermediate Periphery
Nl
Nl
Central
DAPI P53 ZFAND3 Merged
Intermediate Periphery ZFAND3 ZFAND3 HE Ll Ll Hl Hl Hl-2 213 163 46 61 203 20 33 8 17 1731 16 10 19 228
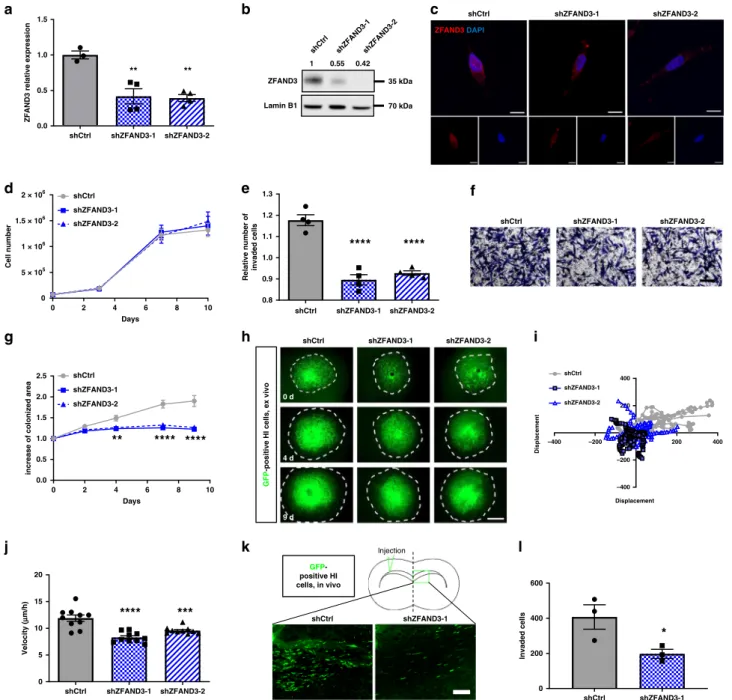
shRNA-mediated knockdown (KD) of ZFAND3 was performed
in two highly invasive GSCs (HI and HI-2). Efficient KD with two
different shRNAs was achieved at RNA and protein level (Fig.
3
a,
b and Supplementary Fig. 4a–e). Similar to patient samples,
endogenous ZFAND3 protein displayed cytoplasmic and nuclear
localization, while KD cells only retained minor cytoplasmic
staining (Fig.
3
c). ZFAND3 KD had no significant impact on cell
proliferation (Fig.
3
d). Using Boyden chamber assays on the same
cells, ZFAND3 KD significantly reduced invasion compared to
shCtrl in HI cells (Fig.
3
e, f). This was confirmed in the HI-2 cell
line (Supplementary Fig. 4a–e).
To better imitate invasion in a brain microenvironment, we
implanted GBM HI cells into ex vivo brain slices. In ZFAND3 KD
cells the area of colonization of the brain slice was decreased in
contrast to shCtrl (Fig.
3
g, h) and cellular velocity, as determined
by single cell tracking, was reduced accordingly (Fig.
3
i, j). Finally,
we evaluated the invasion potential of ZFAND3 KD cell in vivo:
eight weeks after intracranial tumor implantation, the mice were
sacrified and cell invasion to the contralateral hemisphere was
quantified. We found significantly less cells in ZFAND3 KD
tumors compared to control (Fig.
3
k, l and Supplementary
Fig. 4j). Taken together these data validate the result of the screen
and indicate that loss of ZFAND3 strongly impairs GBM cell
invasion in vitro, ex vivo and in vivo.
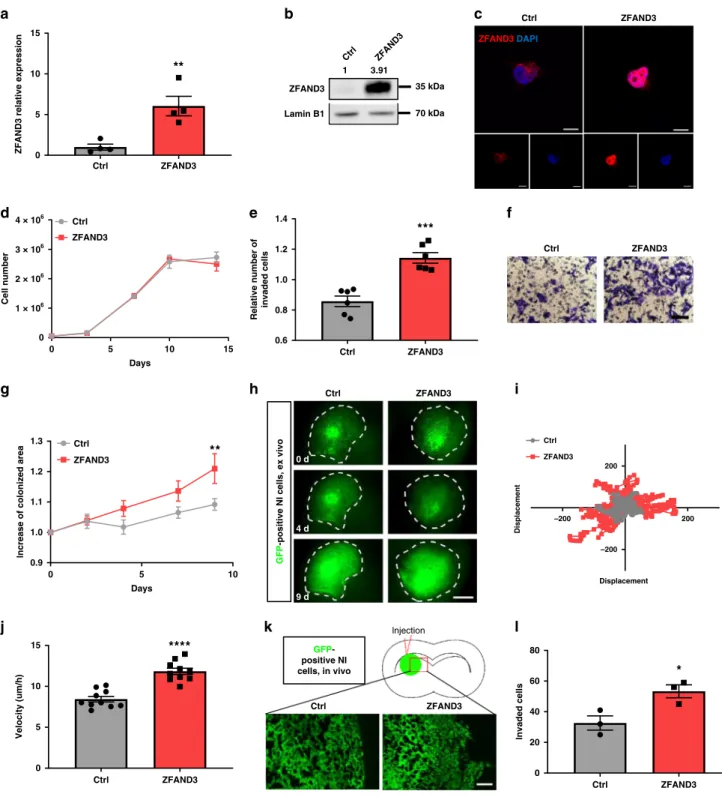
Expression of
ZFAND3 confers invasion potential to
non-invasive patient-derived GBM cells. Given that ZFAND3
downregulation considerably decreased the invasion potential of
invasive GSCs, we asked if ZFAND3 overexpression was able to
bestow invasion capacity to non-invasive (NI) GSCs. We
there-fore expressed ZFAND3 in NI GSCs, as shown by qPCR (Fig.
4
a)
and western blot analysis (Fig.
4
b). Upon overexpression,
ZFAND3 protein mostly accumulated in the nucleus (Fig.
4
c) and
did not affect proliferation of the cells (Fig.
4
d). Instead we found
that ZFAND3 increased invasion in vitro (Fig.
4
e, f) and ex vivo
in brain slice cultures. ZFAND3 expressing cells colonized a
larger area (Fig.
4
g, h) and displayed higher velocity (Fig.
4
i, j).
Upon transplantation in the mouse brain, ZFAND3 expressing
tumors lost the circumscribed growth pattern of control NI cells
(Fig.
4
k and Supplementary Fig. 4k). The number of cells
escaping the tumor mass was significantly increased for ZFAND3
expressing cells, compared to controls (Fig.
4
l). These data
indi-cate that ZFAND3 expression confers invasion potential to GBM
cells that were initially not invasive.
Nuclear localization of ZFAND3 is required for GBM cell
invasion. ZFAND3 contains two ZF domains, a N-terminal A20
domain and a C-terminal AN1 domain separated by a linker
region (Fig.
5
a). As we found ZFAND3 immunostaining in the
nucleus and nuclear localization was increased in the infiltrative
tumor compartment, we asked whether nuclear localization was
needed for ZFAND3 activity. A ZFAND3 construct with a
mutated nuclear localization signal (NLS) (ZFAND3-mutNLS)
was expressed in NI cells (Fig.
5
a–c and Supplementary
Fig. 5a–c). This resulted in ZFAND3 accumulation in the
cyto-plasm (Fig.
5
d) and prevented ZFAND3-induced invasion
(Fig.
5
f, g). The addition of a second NLS sequence to the mutant
construct rescued both nuclear localisation and the invasion
phenotype (Fig.
5
a–g), indicating that ZFAND3 was active in the
nucleus. No impact on proliferation was observed (Fig.
5
e). In
summary, these data demonstrate that nuclear localization is
required for ZFAND3-induced invasion.
Deletion of zinc-finger domains leads to loss of invasion
phe-notype. In an attempt to further uncover the molecular basis of
its activity, we generated ZFAND3 mutants with deletion of
individual or both ZF domains (ZFAND3-Δ1, Δ2, and Δ1Δ2)
(Fig.
5
a and Supplementary Fig. 5a), and expressed them in NI
GSCs (Fig.
5
h, i). None of the variants exhibited proliferation
defects (Fig.
5
j). In contrast to full length ZFAND3, no increase in
invasion was observed in cells expressing ZFAND3-Δ1,
ZFAND3-Δ2 or ZFAND3-Δ1Δ2 (Fig.
5
k, l), suggesting that both
ZF domains are required for induction of invasion. Of note, while
the double deletion construct accumulated in the cytoplasm,
ZFAND3-Δ1 and ZFAND3-Δ2 correctly translocated to the
nucleus (Fig.
5
m). To further pinpoint the active residues, we
generated point mutations in putative zinc-complexing amino
acids (M1, M2, and M1-M2) (Supplementary Fig. 5a). These
constructs retained nuclear localization, but also full activity with
regard to the invasive phenotype (Supplementary Fig. 5b–g). In
conclusion, although the exact residues conferring nuclear
ZFAND3 activity remain elusive, our data hint to the need of
both ZF domains to trigger invasion in GBM cells, suggesting that
ZFAND3 may act as a transcriptional regulator.
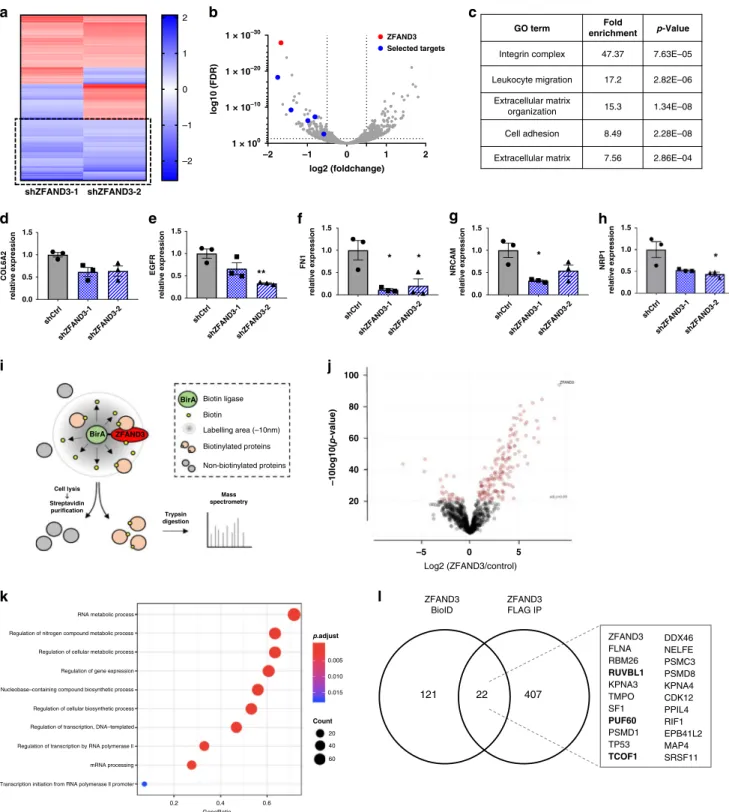
ZFAND3 is involved in transcriptional regulation of
invasion-related genes. To address whether ZFAND3 correlates with the
expression of genes involved in migration and
epithelial-mesenchymal transition, we analysed expression of CDH2 (coding
for N-cadherin), MMP2, SNAI2 and ZEB1 in GSCs with various
ZFAND3 expression levels. Surprisingly, the modulation of ZFAND3
expression (KD or overexpression) or function (mutation
con-structs) did not affect expression of these genes (Supplementary
Fig. 6). We therefore performed RNA sequencing on shCtrl,
shZFAND3-1 and shZFAND3-2 HI cells to gain broader insight into
the transcriptional landscape upon ZFAND3 knockdown. Among
the differentially expressed genes (DEGs), 58 genes were significantly
downregulated in both shZFAND3-1 and shZFAND3-2 versus
Fig. 2 Expression of ZFAND3 is associated with GBM cell invasion. a Set up of genome-wide shRNA pooled screen selecting for invasion-defective and
invasion-competent cells in ECM-collagen coated transwell chambers.b Loss-of-function screen focused on shRNAs significantly enriched in
invasion-defective cells. Results were analysed with RSA, RIGER, MAGeCK and HitSelect methods, identifying 17 genes as the top 2% common hits.c qPCR showed
higherZFAND3 expression in highly invasive GSCs (HI, HI-2) compared to non invasive (NI) (n = 3; p = 0.007) and low invasive (LI) cells (n = 3
biologically independent samples). Results are displayed as average ± SEM and were anlysed with one-way ANOVA. *pvalue< 0.1.d IHC for ZFAND3 in
intracranial GBM xenografts in mice generated from respected patient-derived GSCs (NI, LI HI) (Scale bars= 50 µm, hematoxylin counterstaining). e IHC
revealed ZFAND3 protein in GBM patient biopsies in the tumor core (central), intermediate area (intermediate) and tumor margin with diffuse infiltration
(periphery) (Scale bars= 100 µm). Representative images are shown (n = 21). f Triple immunofluorescence identified ZFAND3 staining in cytoplasm and
nucleus of positive tumor cells: ZFAND3 (red), P53 (green) and DAPI (blue) (Scale bar upper row= 50 µm, lower row = 15 µm). (n = 17 different partient
samples). Mean intensity of cytoplasmic (g) and nuclear (h) ZFAND3+ tumor cells in central, intermediate, and peripheral tumor areas, the latter being
increased in the periphery (n = 17). Data were analyzed as matched data with one-way ANOVA and Tukey´s multiple comparison test. (p = 0.009) i Ratio
of nuclear/cytoplasmic ZFAND3 staining is increased in the periphery compared to the central tumor area (n = 17 patient samples). Data were analysed as
shCtrl HI cells (FDR < 0.05, logFC <
−0.5) (Fig.
6
a, b,
Supplemen-tary Fig. 7a, b). Gene ontology analysis associated these DEGs with
adhesion and motility-related pathways, such as migration, integrin
complex, ECM and cell adhesion (Fig.
6
c). Among these DEGs, we
selected genes reportedly linked to GBM cell invasion including
COL6A2 (alpha-2 subunit of type VI collagen), EGFR (epidermal
growth factor receptor), FN1 (fibronectin 1), NRCAM (neuronal cell
adhesion molecule) and NRP1 (neuropilin 1), and confirmed their
downregulation upon ZFAND3 KD (Fig.
6
d–h), thus supporting a
role for ZFAND3 in transcriptional regulation. To further address
shCtrl shZFAND3-1 shZFAND3-1 shZFAND3-2 shZFAND3-2 0.0 0.5 1.0 1.5
ZFAND3 relative expression
** ** shZFAND3-1 shZFAND3-2 shCtrl shCtrl shZFAND3-1 shZFAND3-2 0.8 0.9 1.0 1.1 1.2 1.3 Relative number of invaded cells
****
****
0 2 4 6 8 10 0 2 × 10⁶ 1.5 × 10⁶ 1 × 10⁶ 5 × 10⁵ Days Cell number shCtrl shZFAND3-1 shZFAND3-2 0 2 4 6 8 10 0.0 0.5 1.0 1.5 2.0 2.5 Daysincrease of colonized area
shCtrl shZFAND3-1 shZFAND3-2
**** ****
**
shCtrl shZFAND3-1 shZFAND3-2 0 5 10 15 20 Velocity ( μ m/h)****
***
shCtrl shZFAND3-1 0 200 400 600 lnvaded cells*
shZFAND3-1 shZFAND3-2 shCtrl 0 d 4 d 9 d GFP-positive HI cells, ex vivo
a
b
c
d
e
f
g
h
i
j
k
l
shZFAND3-1 shZFAND3-2 shCtrl ZFAND3 DAPI –400 –200 200 400 –400 –200 200 400 Displacement Displacement shZFAND3-1 shZFAND3-2 shCtrl shZFAND3-1 lnjection shCtrl GFP-positive HI cells, in vivo ZFAND3 shCtrl Lamin B1 1 35 kDa 70 kDa 0.42 0.55Fig. 3 Knockdown of ZFAND3 decreases invasion capacity of highly-invasive GBM cells. a qPCR confirming knockdown (KD) of ZFAND3 in highly
invasive GCSs (HI) using two ZFAND3 shRNAs (n ≥ 3 biologically independent samples). Results are displayed as average ± SEM and were analysed with
one-way ANOVA.b, c Decrease of ZFAND3 protein inZFAND3 KD by western blot (n = 3) and IF staining (red: ZFAND3, blue: DAPI. Scale bars = 10 µm)
(n = 2). In analogy to patient samples, ZFAND3 protein is present in the nucleus and cytoplasm. d Growth curves of control and ZFAND3 KD cells show no
defect in cell proliferation (n = 3 biologically independent experiments). e, f Boyden chamber invasion assay showing reduced invasion in ZFAND3 KD cells
compared to control (n = 4 biologically independent experiments) (Scale bar = 100 µm). Results are displayed as average ± SEM and were analysed with
one-way ANOVA.g, h ZFAND3 KD cells implanted in ex vivo brain slice cultures showed reduced colonization compared to control cells, 9 days after
tumor implantation (n = 10 biologically independent samples) (Scale bar = 1000 µm). Results are displayed as average ± SEM and were analysed with a
two-way ANOVA.i, j Visualization and quantification of single cell displacement of ZFAND3 KD cells in ex vivo brain slice cultures showing reduced
velocity compared to control (n = 15 cells over 10 biologically independent samples). Results are displayed as average ± SEM and were analysed with
one-way ANOVA.k, l Upon intracranial implantation (n = 3 biologically independent animals), ZFAND3 KD cell invasion toward the contralateral hemisphere
was decreased compared to control tumors. GBM xenografts were analyzed at 2 months post-surgery (3 sections per mouse) (Scale bar= 100 µm).
Results are displayed as average ± SEM and were analysed with an unpaired, two-sidedt test. *pvalue< 0.05, **pvalue< 0.01, ***pvalue< 0.001, ****pvalue<
Ctrl Ctrl ZFAND3 ZFAND3 0 5 10 15
ZFAND3 relative expression
**
Ctrl ZFAND3 0.6 0.8 1.0 1.2 1.4 Relative number of invaded cells***
0 5 10 15 0 4 × 10⁶ 3 × 10⁶ 2 × 10⁶ 1 × 10⁶ Days Cell number Ctrl ZFAND3 0 5 10 0.9 1.0 1.1 1.2 1.3 Dayslncrease of colonized area
Ctrl ZFAND3
**
Ctrl ZFAND3 0 5 10 15 Velocity (um/h)****
Ctrl ZFAND3 0 20 40 60 80 lnvaded cells*
Ctrl ZFAND3 DAPI ZFAND3 ZFAND3 Ctrl 0 d 4 d 9 d GFP-positive NI cells, ex vivo
Ctrl ZFAND3 ZFAND3 lnjection Ctrl
a
b
c
d
e
f
g
h
i
j
k
l
–200 200 –200 200 Displacement Displacement Ctrl ZFAND3 GFP -positive NI cells, in vivo ZFAND3 Lamin B1 1 35 kDa 70 kDa 3.91Fig. 4 Overexpression of ZFAND3 in non-invasive GBM cells confers invasion potential. ZFAND3 overexpression in non-invasive GSCs (NI) (n = 4
biologically independent samples) confirmed by qPCR (a), Western blot (n = 3) (b) and with IF staining (c) (red: ZFAND3, blue: DAPI. Scale bars = 10 µm).
d ZFAND3-overexpression did not affect cell proliferation (n= 3 biologically independent experiments). e, f Boyden chamber invasion assay indicating
increased invasion potential in ZFAND3-overexpressing cells (n = 6 biologically independent experiments) (Scale bar = 100 µm). g, h
ZFAND3-overexpressing cells implanted in ex vivo brain slice cultures showed augmented colonization compared to control cells, 9 days after tumor implantation
(n = 10 biologically independent samples) (Scale bar = 1000 µm). i Velocity of ZFAND3-overexpressing cells in ex vivo brain slice cultures was improved
compared to control cells (n = 10, p < 0.0001). j Visualization of single cell displacement for control and ZFAND3-overexpressing cells in ex vivo brain slice
cultures (n = 15 cells over 10 biologically independent samples). k, l Upon orthotopic xenografting in mice (n = 3), an increased number of
ZFAND3-overexpressing cells invaded out of the tumor border into the surrounding tissue, compared to control cells (analysis done at 4 weeks after implantation)
(3 sections per mouse) (Scale bar= 100 µm). Results of (a, e, g, j, l) are displayed as average ± SEM, results of (a, e, j, and l) were analysed with an
this, we interrogated the ZFAND3 neighboring interactome, using
the BioID screening technology
27. Briefly, we expressed ZFAND3
fused with a biotin ligase (ZFAND3-BirA) in GSCs, which allowed
the biotinylation of proteins in close proximity (~10 nm) (Fig.
6
i).
After streptavidin-based purification, biotinylated proteins were
analysed by mass spectrometry, and statistical analysis revealed
143 significantly enriched proteins in ZFAND3-BirA cells compared
to control (adj. p value < 0.05, FC > 2) (Fig.
6
j). Gene ontology
analysis indicated candidate interactors to be involved in RNA
regulation and transcriptional processes (Fig.
6
k, Supplementary
Fig. 7c), reinforcing our hypothesis. To validate these results we
performed ZFAND3-FLAG coimmunoprecipitation (FLAG Co-IP)
a
d
f
h
k
m
i
l
j
g
b
c
e
ZFAND3 N C 200 HA 4 3 2 relative n umber of in v aded cells Relative n u mber of in v aded cells 1 0 40 30 20 10 0 2.0 1.5 1.0 0.5 0.0 Ctrl CtrlHADAPI HADAPI HADAPI HADAPI ZFAND3 ZFAND3 ZFAND3-mutNLS-HA ZFAND3-mutNLS ZFAND3-mutNLS-NLS-HA ZFAND3-mutNLS-NLS 1 5.9 10.4 2.3 35 kDa 70 kDa 35 kDa 25 kDa 70 kDa Ctrl ZFAND3 ZF AND3-mu tNLSZF AND3-mutNLS-NLS Ctrl ZF AND3 ZF AND3-ΔΔ1 ZF AND3-Δ2 ZF AND3-Δ1Δ2 Lamin B1 HA Lamin B1 150 100 ZF AND3 relative ex pression ZF AND3 relative ex pression 50 0 4×10⁵ 5×10⁵ 3×10⁵ 2×10⁵ Cell n u mber Cell n u mber 1×10⁵ 0 4×10⁵ 3×10⁵ 2×10⁵ 1×10⁵ 0 1 2.0 7.42 7.96 10.59 Ctrl ZFAND3 ZFAND3-m utNLS ZFAND3-m utNLS-NLS CTR ZFAND3 ZFAND3-m utNLS ZFAND3-m utNLS-NLS Ctrl ZFAND3 ZFAND3-m utNLS ZFAND3-m utNLS-NLS Ctrl ZFAND3 ZF AND3-Δ1 ZF AND3-Δ2 ZF AND3-Δ1Δ2 Ctrl ZFAND3 ZF AND3-Δ1 ZF AND3-Δ2 ZF AND3-Δ1Δ2 Ctrl Ctrl ZFAND3 ZFAND3 ZF AND3-Δ1 ZFAND3-Δ1 ZF AND3-Δ2 ZFAND3-Δ2 ZFAND3-Δ1Δ2 Ctrl ZFAND3 DAPl
ZFAND3 ZFAND3-Δ1 ZFAND3-Δ2 ZFAND3-Δ1Δ2
ZF AND3-Δ1Δ2 A20 AN1 AN1 AN1 AN1 A20 A20 A20
zinc finger HA-tag NLS mutNLS c-myc NLS ZFAND3-Δ1
ZFAND3-Δ2 ZFAND3- Δ1Δ2
ZFAND3-mutNLS-NLS ZFAND3-mutNLS
and subsequent mass spectrometry analysis (Supplementary
Fig. 7d–f). Among the 143 proteins identified as ZFAND3
inter-actome, 22 proteins were also pulled-down by FLAG Co-IP
sup-porting these as ZFAND3 interactors (Fig.
6
l). These included
several proteasome-associated proteins (PSMD1, PSMD8, PSMC3),
nuclear importins (KPNA3, KPNA4), and splicing factors (e.g.,
PUF60, SF1, PPIL4) (Supplementary Fig. 7g). Since we found the
invasion-related activity of ZFAND3 to be localized to the nucleus,
we focused on nuclear proteins. Database-driven analysis of protein
complexes (via the Dragon Database for Human Transcription
Co-Factors and Transcription Factor Interacting Proteins (TcoF-DB)
28revealed interacting proteins PUF60, Pontin and Treacle
(respec-tively encoded by PUF60, RUVBL1 and TCOF1 genes) as common
binding partners within a GPN-loop GTPase 1 (GPN1) complex. To
investigate if the interaction with ZFAND3 could be further
con-firmed by western blot, FLAG-tagged ZFAND3 from overexpressing
cells (NI-ZFAND3 OE) was immunoprecipitated and analysed.
PUF60 co-immunoprecipitated with ZFAND3 thereby validating it
as a ZFAND3 interaction partner (Supplementary Fig. 7h), a weak
background detected in control cells was not present when using
isotype-specific IgG control in overexpressing cells. Technical
rea-sons prevented confirmation of direct interaction with TCOF1 or
Pontin by WB Co-IP.
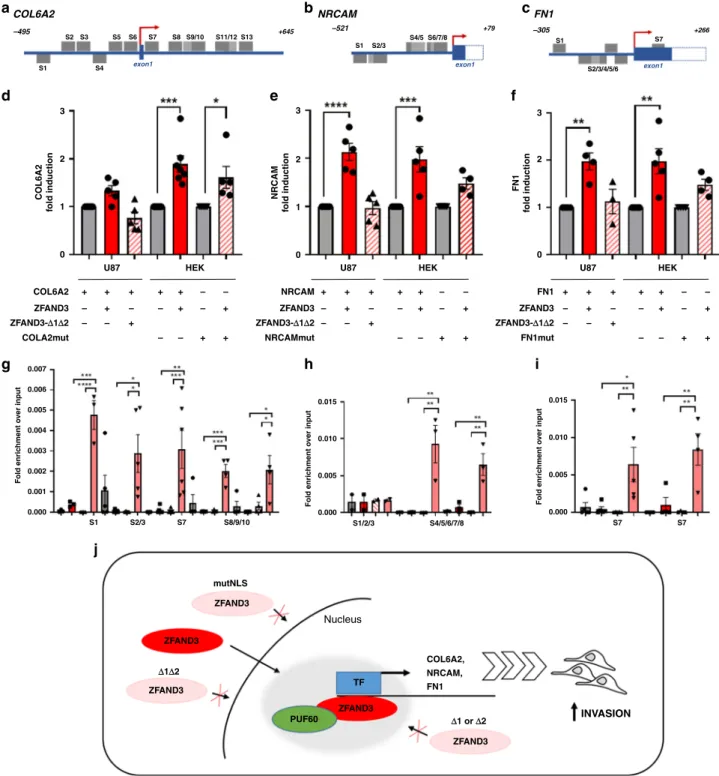
Next, we aimed to relate these
findings to events taking place at
the promoter regions of potential target genes. We in-silico
analysed the promoters of COL6A2, NRCAM and FN1 with the
Genomatix tool and identified a multitude of GC-rich target
sequences, preferentially recognized by ZF containing
DNA-binding proteins (Fig.
7
a–c). We thus performed dual-luciferase
reporter assays in U87 or HEK293T cells with the promoter
sequences of COL6A2, NRCAM or FN1 and detected an increased
luciferase signal upon ZFAND3 co-expression, demonstrating
that ZFAND3 was able to activate the promoter region of the
genes of interest and induce their transcription (Fig.
7
d–f). As
expected the effect was not seen with ZFAND3-Δ1Δ2 (lacking
both ZF domains). We also assessed expression of COL6A2,
NRCAM and FN1 genes in NI GSCs stably expressing ZFAND3
(Supplementary Fig. 8a–d) or ZFAND3 mutant constructs
(Supplementary Fig. 8e–j) with no marked change in expression
of target genes. Although unexpected, the latter might be related
to adaptation to long term overexpression. Finally, we performed
ChIP-qPCR experiments in NI GSCs overexpressing
FLAG-tagged ZFAND3 or FLAG-tag alone. We observed association of
ZFAND3 with in silico predicted ZF consensus sites in the
promoter regions of COL6A2, NRCAM, and FN1 in ZFAND3
overexpressing cells compared to controls (Fig.
7
g–i). In line,
point mutations introduced into ZF consensus sites contained
within respective promoter regions failed to comparably induce
luminescence in reporter assays for target genes (Fig.
7
d–f). In
summary, we propose that ZFAND3 induces the expression of
invasion-related genes through activation of a transcriptional
complex involving PUF60, ultimately boosting the invasive
behavior of GBM cells (Fig.
7
j).
Discussion
ZFAND3 is a member of the ZFAND family of proteins, which
contain a ZF domain of the AN1 type. ZF proteins ensure a
plethora of cellular functions in health and disease, such as DNA
recognition, RNA packaging, transcriptional regulation, and are
involved in many aspects of cancer progression
29. In humans,
there are eight ZFAND family members, of which only ZFAND2a
and ZFAND4 have recently been implicated in cancer
30–33.
Members of the ZFAND family are associated with stress response
and proteasomal degradation through recruitment of the 26 S
proteasome, e.g., ZFAND1
34, ZFAND2A/B
30,35, ZFAND5
36, and
ZFAND6
37. ZFAND3 has so far only been associated to type 2
diabetes susceptibility
15, but nothing is known about its cellular
function or its role in tumor biology. Here, we have identified and
validated ZFAND3 as a modulator of GBM cell invasion, and
demonstrate that it acts through regulation of transcriptional
activity. We
find that in patient samples ZFAND3 expression is
increased in infiltrative cells from the tumor margin.
At the mechanistic level, we show that ZFAND3-induced
invasion activity relies on its nuclear localization and requires
integral AN1 and A20 ZF domains. The prevention of nuclear
translocation and invasive phenotype through removal of the NLS
signal and rescue of localization and activity by addition of a new
NLS demonstrates that ZFAND3 acts in the nucleus. This is in
contrast to other ZFAND proteins that are primarily located in the
cytoplasm and associated to the ubiquitin-proteasome system
(UPS), which may also explain the differences observed with ZF
domain mutant constructs. While single deletion of either the
AN1 (ZFAND3
Δ1) or the A20 domain (ZFAND3 Δ2) did not
impair nuclear translocation, the invasion phenotype was lost.
This might be explained by a conformational change in the
pro-tein structure, interfering with DNA or propro-tein binding hence
affecting its activity. Functional studies of other members of the
ZFAND protein family employing similar deletions have shown
that proteins with deletion of one of the two domains retain
certain functions. e.g., in ZFAND5 the AN1 domain is required
for the stimulation of peptidase activity whereas the A20 domain
is needed for the binding of polyubiquitinated proteins
36and both
ZFAND5 AN1 and A20 domains were found to be essential for
RNA stabilization
38. Also, the AN1 domain and UBL domains of
ZFAND1 were found to be required for its binding to PSMD1 and
p97/Cdc48, respectively
34,39. In an attempt to further nail down
Fig. 5 ZFAND3-induced invasion requires nuclear localization and presence of zinc-finger domains. a Structural overview of ZFAND3 protein and
corresponding mutants with zincfinger domain deletions (Δ1, Δ2, Δ1Δ2), mutated nuclear localization signal (mutNLS) and NLS rescue with c-myc NLS
(mutNLS-NLS). HA-tag: hemagglutinin tag. N: N-terminus, C: C-terminus.b Expression of NLS constructs in NI GSCs as confirmed by qPCR (n = 3
biologically independent samples), results were analysed with a two-tailed, unpairedt test, and (c) by Western blot (n = 3). d IF staining showing that
ZFAND3-mutNLS does not translocate to the nucleus, while mutNLS-NLS rescue does (green: HA, blue: DAPI. Scale bars= 10 µm). (n = 2) e Proliferation
assay of cells with indicated constructs control (measurements done at day 3;n = 7 biologically independent experiments for Ctr, ZFAND3 and
ZFAND3-mutNLS,n = 3 biologically independent experiments for ZFAND3-mutNLS-NLS). f, g Boyden chamber invasion assay showing loss of invasion phenotype
with ZFAND3-mutNLS and rescue with ZFAND3-mutNLS-NLS in NI GSC (n = 6 biologically independent experiments for Ctrl, ZFAND3 and
ZFAND3-mutNLS,n = 3 biologically independent experiments for ZFAND3-mutNLS-NLS) (Scale bar = 100 µm). Results were analysed with a two-tailed, unpaired
t test. h Expression of deletion constructs in NI GSCs by qPCR (n = 3 biologically independent samples). Results were analysed with one-way ANOVA (h)
Western blot (i) (n = 3). j Proliferation of cells overexpressing respective constructs (n = 3 biologically independent experiments). Results were
analysed with a two-way ANOVA.k, l Boyden chamber invasion assay indicating loss of invasion induction with deletion constructs (n = 4 biologically
independent experiments) (Scale bar= 100 µm). Results were analysed with one-way ANOVA. m IF staining showing that ZFAND3 Δ1 and ZFAND3 Δ2
mutants localize to the nucleus, whereas ZFAND3Δ1Δ2 does not (red: ZFAND3, blue: DAPI. Scale bars = 20 µm) (n = 2) All results are displayed as
Log2 (ZFAND3/control)
b
c
GO term Fold
enrichment p-Value
Integrin complex 47.37 7.63E–05
Leukocyte migration 17.2 2.82E–06 Extracellular matrix
organization 15.3 1.34E–08 Cell adhesion 8.49 2.28E–08
Extracellular matrix 7.56 2.86E–04
i
k
j
shCtrl shZFAND3-1shZFAND3-2 shCtrl shZFAND3-1shZFAND3-2 shCtrl shZFAND3-1shZFAND3-2 shCtrl shZFAND3-1shZFAND3-2 0.0 0.5 1.0 1.5 COL6A2 relative expression 0.0 100 80 –10log10( p -value) 60 40 20 –5 0 5 0.5 1.0 1.5 EGFR relative expression 0.0 0.5 1.0 1.5 FN1 relative expression 0.0 0.5 1.0 1.5 NRCAM relative expression ** * * *d
l
e
f
g
h
–2 –1 0 1 2 1 × 10–30 1 × 10–20 1 × 10⁻¹⁰ 1 × 100 log2 (foldchange) log10 (FDR) ZFAND3 Selected targetsa
shZFAND3-1 shZFAND3-2 –2 –1 0 1 2 ZFAND3 BioID ZFAND3 FLAG IP ZFAND3 FLNA RBM26 RUVBL1 KPNA3 TMPO SF1 PUF60 PSMD1 TP53 TCOF1 DDX46 NELFE PSMC3 PSMD8 KPNA4 CDK12 PPIL4 RIF1 EPB41L2 MAP4 SRSF11 22 407 121 shCtrl shZFAND3-1shZFAND3-2 0.0 0.5 1.0 1.5 NRP1 relative expressionBirA Biotin ligase Biotin Biotinylated proteins Non-biotinylated proteins Labelling area (–10nm) BirA Cell lysis Streptavidin purification Trypsin digestion Mass spectrometry ZFAND3
RNA metabolic process
0.2 0.4 GeneRatio p.adjust Count 0.6 20 0.005 0.010 0.015 40 60 Regulation of nitrogen compound metabolic process
Regulation of cellular metabolic process
Regulation of cellular biosynthetic process
mRNA processing
Transcription initiation from RNA polymerase ll promoter Regulation of transcription, DNA–templated
Regulation of transcription by RNA polymerase ll Regulation of gene expression
Nucleobase–containing compound biosynthetic process
Fig. 6 ZFAND3 regulates gene expression and is part of a nucleus-specific protein interactome involved in RNA metabolism, processing, and
transcription. a RNAseq analysis of HI GSCs (n = 3 per condition) identified 58 common DEGs from two KD clones (shZFAND3-1 and shZFAND3-2) vs
shCtrl cells (FDR≤ 0.05, log2FC ≤ −0.5 and ≥ 0.5). b Volcano plot showing DEGs in shZFAND3-2 compared to Ctrl. Among these, 5 downregulated DEGs
were selected for further investigation.c Gene ontology analysis (David database) associated the 58 DEGs to invasion-related GO terms. qPCR confirmed
reduced expression ofCOL6A2 (d), EGFR (e), FN1 (f), NRCAM (g) and NRP1 (h) in HI GSCs with shZFAND3-1 or shZFAND3-2 compared to shCtrl (n = 3
biologically independent samples). Results are displayed as average ± SEM. Results were analysed with one-way ANOVA.i Bio-ID approach applied to
unveil the interactome of ZFAND3 (adapted from Vernaite et al.59) (n = 4). j Volcano plot showing 143 proteins significantly enriched in ZFAND3-BirA
expressing cells. Two-sample t test was performed with a Benjamini-Hodgberg based FDR < 0.01.k Gene ontology analysis demonstrated that these 143
proteins are involved in RNA metabolism, processing, and transcription.l Co-IP/MS in ZFAND3-FLAG expressing cells confirming 22 proteins from the
Bio-ID experiment as candidate ZFAND3 interactors. Gene names of identified proteins are indicated, with Pontin (RUVBL1), PUF60 (PUF60) and Treacle
the active residues, we introduced missense mutations in the
zinc-complexing amino acids of both domains (constructs M1, M2,
M1-M2) similar to what was reported for ZFAND5
36. The
equivalent mutation in the A20 domain of ZFAND5 (M1)
abolished its ubiquitin-binding activity
36,40, whereas the missense
mutations in the AN1 domain (M2) resulted in a loss of its ability
to stimulate the proteasome
36. In our hands ZFAND3 with either
mutated domain (M1 or M2) or both (M1-M2) did not diminish
a
d
e
f
g
j
h
i
b
c
COL6A2 NRCAM FN1 –495 –521 –305 S2 3 2 1 0 0.007 0.015 0.010 0.005 0.000 0.006 0.005 0.004 0.003 0.002 0.001 0.000 S1 S2/3 S7 S8/9/10 S1/2/3 S4/5/6/7/8 S7 S7 mutNLS ZFAND3 COL6A2, INVASION FN1 TF PUF60 NRCAM, Nucleus ZFAND3 ZFAND3 ZFAND3 ZFAND3 ΔΔ1Δ2 Δ1 or Δ2 COL6A2ZFAND3 ZFAND3 ZFAND3
FN1
FN1mut NRCAM
NRCAMmut COLA2mut
ZFAND3-Δ1Δ2 ZFAND3-Δ1Δ2 ZFAND3-Δ1Δ2
U87 + + + + – – – – – – – – – – + + + + + + + HEK COL6A2 fold induction Fold enric hment o v er input Fold enric hment o v er input 0.015 0.010 0.005 0.000 Fold enric hment o v er input 3 2 1 0 NRCAM fold induction 3 2 1 0 FN1 fold induction S1 S1 S1 S7 +266 S2/3 S4/5 S6/7/8
S4 exon1 exon1 S2/3/4/5/6 exon1
S3 S5 S6 S7 +645 +79 S8 S9/10 S11/12 S13 U87 + + + + – – – – – – – – – – + + + + + + + HEK U87 + + + + – – – – – – – – – – + + + + + + + HEK
Fig. 7 ZFAND3 binds to and induces promoter activity on COL6A2, NRCAM and FN1 genes. Transcription factor consensus site analysis (via Genomatix)
identified several putative ZF binding sites (GC-rich regions, hereafter named S1-S13) in the promoter regions of COL6A2 (a), NRCAM (b) and FN1 (c).
Dual-luciferase reporter assays carried out in U87 or HEK293T cells showed that transiently coexpressed ZFAND3 binds to the promoter regions of COL6A2 (n ≥ 5) (d), NRCAM (n ≥ 4) (e) and FN1 (n ≥ 4) (f) inducing luciferase expression, whereas deletion mutant ZFAND3-Δ1Δ2 did not. Luciferase
activation was compromised on promoters with mutated GC-rich regions (COLA2mut, NRCAMmut, FN1mut) (n ≥ 4 biologically independent experiments
*pvalue< 0.05, **pvalue< 0.01, ***pvalue< 0.001, ****pvalue< 0.0001). ZFAND3 binding to GC-rich regions in the promoter regions ofCOL6A2 (n ≥ 3) (g),
NRCAM (n ≥ 2) (h) and FN1 (n ≥ 4) (i) in HI cells overexpressing ZFAND3 as determined by ChIP qPCR (n ≥ 2 biologically independent experiments *pvalue< 0.05, **pvalue< 0.01, ***pvalue< 0.001, ****pvalue< 0.0001).j Proposed model of ZFAND3 activity in a nuclear protein complex that regulates a gene
its ability to promote invasion (Supplementary Fig. 5b–f),
sug-gesting that these specific residues are not relevant for the
observed nuclear ZFAND3 activity.
In line with its nuclear activity, we identify a nucleus-specific
ZFAND3 interactome, including DNA/RNA binding proteins,
splicing factors and helicases generally involved in RNA
meta-bolic processes and transcription. Based on our proteomics data
and on available database-knowledge, we propose a ZFAND3
containing protein complex including PUF60 (PUF60) and
pos-sibly Pontin (RUVBL1) and Treacle (TCOF1) that regulates gene
transcription (Fig.
7
j). Of interest, these three proteins have been
previously involved in cell motility in cancer or during
develop-ment
41–43. Binding sites for ZF containing DNA-binding proteins
are enriched in the promoter regions of COL6A2, NRCAM, or
FN1, which were previously described in specific invasive
sig-natures in GBM
44,45. We demonstrate binding of ZFAND3 to the
promoter regions of these genes and confirm ZFAND3-induced
transcription by dual-reporter gene assays, indicating a role for
ZFAND3 in a transcriptional invasion program. In analogy to
other ZFAND members, several UPS-associated proteins i.e.,
PSMD1, PSMC3, and PSMD8, were also identified in our
ZFAND3 interactome, which may point to additional cellular
functions in the cytoplasm. In this context, it has been reported
that the UPS plays an essential role in transcription by
main-taining a
fine-tuned equilibrium of protein synthesis and
degra-dation
46. Whether ZFAND3’s transcriptional activity is linked to
a proteasomal function remains to be determined.
Collectively, these studies identify ZFAND3 as a transcriptional
regulator of invasion-related genes, thereby boosting the
infil-trative phenotype of GBM cells. We show that ZFAND3 requires
nuclear translocation and functional ZF domains for displaying
gene regulatory activity. The specific ZFAND3 interactome points
to a role in transcriptional complex regulation, although an
involvement in proteolysis cannot be excluded. These data
expand our knowledge on the cellular functions and tumorigenic
potential of ZFAND family members thus far largely known for
their role in protein degradation. Further elucidation of the
molecular determinants of ZFAND3 activity in oncogenic
path-ways may provide opportunities for targeting cancers, including
GBM, prone to locoregional invasion or metastasis.
Methods
Cell culture. Patient-derived GSC lines were generated in the laboratories of Christel Herold-Mende and Rolf Bjerkvig. They were characterized as non invasive (NI: NCH644; NI-2: GG6), low invasive (LI: NCH421k), and highly invasive (HI:
NCH601; HI-2: NCH465; HI-3: NCH660h and HI-4: BG7) (Fig.1and
Supple-mentary Fig. 1). NCH421k, NCH601, NCH465 and NCH660h were cultured as nonadherent spheres in DMEM-F12 medium (Lonza) containing 1x BIT100 (Provitro), 2 mM Ultraglutamine, 30 U/ml Pen-Strep, 1 U/ml Heparin (Sigma), 20 ng/ml bFGF (Miltenyi, 130-093-841) and 20 ng/ml EGF (Provitro, 1325950500). NCH644, BG7 and GG6 were grown in Neurobasal base medium (Life Technol-ogies) supplemented with 1x B27 without vitamine A (Life TechnolTechnol-ogies) 2mM L-Glutamine, 30 U/ml Pen-Strep, 1 U/ml heparin, 20 ng/ml bFGF and 20 ng/ml EGF. Human embryonic kidney 293 (HEK293T) cells and U87 GBM cells were cultured in DMEM (Lonza) supplemented with 10% fetal bovine serum (FBS), 2 mM Ultraglutamine, and 30 U/ml Pen-Strep. Since GSCs were exposed to 7%
FBS in the Boyden chamber assay, we verified expression of ZFAND3 and stem cell
markers under these conditions (Supplementary Fig. 4f–i). No significant change in ZFAND3 expression was observed, except for HI cells (NCH601) where expression was slightly increased. Stem cell markers showed variable expression across cell
lines and in response to FBS, in line with previous reports47(Supplementary
Fig. 4f–i).
GBM intracranial xenografts in mice. GSCs were implanted in the brain of NOD/ SCID mice (3 mice/group) (Charles River). Mice were anesthetized with a mixture of ketamine (100 mg/kg) and xylazine (10 mg/kg) and placed in a stereotactic frame (Narishige Group, Tokyo, Japan). Tumor cells were implanted into the right frontal cortex using a Hamilton syringe (Hamilton, Reno, NV, USA) (NI, LI, NI ctrl, NI
ZFAND3: 50’000 cells, HI, HI-2, HI shCtrl, HI shZFAND3: 300’000 cells). All
tumor cells were GFP-labeled. Mice were sacrified at defined time points and brains
were extracted and either frozen for cryosections or embedded in paraffin. All
procedures were in accordance with national legislation and the European Direc-tive on animal experimentation (2010/63/EU) and were approved by the respon-sible authorities in Luxembourg (protocol: LUPA2017/15).
Invasion assays
In vitro. For Boyden chamber assays, GSCs were plated on transwell chambers
(1500 or 3000 cells/mm2) (Thincert, Greiner), previously coated with a 1:1 mixture
of 0.05 mg/ml collagen type I (Sigma-Aldrich) and 0.5 mg/ml protein of ECM gel (Sigma-Aldrich) in 1:1 PBS-DMEM-F12, for 2 h at 37 °C. Medium with 10% FBS
was added as a chemoattractant to the lower chamber. After 3 days, cells werefixed
with 4% PFA and stained with 0.05% crystal violet solution for 15 min. Non-invading cells were removed, and invasion was evaluated by counting the cells on the lower side of the membrane under light microscope and ×20 magnification
(5 representativefields per membrane). Experiments were conducted in at least 3
biological replicates (each with 2 technical replicates). To account for the variability between separate assays, the data are represented as number of invaded cells relative to the global mean (total number of invading cells) of each experiment, allowing to combine biological replicates and apply appropriate statistics. The effect of Boyden chamber conditions on ZFAND3 expression and stem cell markers were
verified by qPCR (Supplementary Fig. 4f–i). For the sprouting assay, 5 × 10³cells/
well were plated in an agar-coated well for 3 days to form a sphere. The sphere was transferred to an ECM/collagen-coated well, and covered with ECM. Pictures were taken using EVOS microscope, and invasion was calculated by the ratio of the sphere area at 48 h to 0 h. Analysis was corrected for the expansion of the sphere core.
Ex vivo. Brain slices were prepared from adult NOD/SCID mice. Briefly, mice were
sacrificed by cervical dislocation, and brains were rapidly harvested and placed in
ice-cold cutting solution (0.1% GlutaMax, 25 mM HEPES, 50U/ml Pen-Strep in
DMEM). Brain slices (400μm thick) were generated with a McIlwain Tissue
Chopper and cultured on transwell chambers (1μm pore size) in a 1:1 mixture of
HibernateTM-A medium (ThermoFisher) supplemented with 20% BIT-100 and
100U/ml Pen-Strep with and DMEM-F12 supplemented with 20% BIT-100, 100U/ ml Pen-Strep, 200 mM ultraglutamine and 1U/ml heparin.
Brain slices were cultured 4 days prior to GSC implantation. For this, 5 × 10⁴
GFP-labeled cells in 1μl of ECM were injected in the cortex, above the corpus
callosum, by gently punching a hole in the tissue and slowly releasing the cell/gel
mixture. For the quantification of colonized area, pictures were taken every 2–3
days using the EVOS microscope and analysed with ImageJ. After 9 days, live cell imaging using Incucyte was performed, and the velocity of GFP positive invading cells in the brain slices were assessed with ImageJ (15 cells per condition and 10 replicates per cell line).
In vivo. For invasion analysis of HI and NI cells in orthotopic xenografts (n= 3),
8 µm cryosections were used. For each xenograft 3 sections were counted (in total 9 per condition). Sections at the level of the injection side were choosen and all GFP positive HI cells were counted manually in the contralateral hemisphere as shown in Supplementary Fig. 4j. For invasion analysis of NI cells, all GFP positive NI cells escaping the tumor mass were manually marked and counted (example shown in Supplementary Fig. 4k, l). Imaging was performed on a Ni-E microscope (Nikon) with the NIS Elements Software.
For invasion assays, data were analyzed using the GraphPad Prism 8 software. Results are reported as mean ± standard error of the mean, and n is described as the number of biological replicates. Data were analyzed with two-tailed Student t
test. Statistical significance was set at p < 0.05.
Genome-wide shRNA library screen. A lentiviral-based genome-wide shRNA pooled library contained 95’700 shRNAs targeting 18.205 human genes (5 shRNAs/gene) (RHS6083, Dharmacon). Loss-of-function screen was performed
in triplicates starting with 4 × 10⁷HI cells (MOI 0.3, fold representation of shRNAs
100x). After 3 days of puromycin selection (1.5μg/ml), a reference sample (baseline
control) was collected (2 × 10⁷cells). Next, 5 × 10⁵HI cells were plated per
transwell chambers (in total 24 transwell chambers per replicate to ensure 100x fold representation of shRNAs) (see protocol below) and after 3 days, invasion-deficient and invasion-competent cells were harvested, genomic DNA was extracted and shRNA sequencing libraries were prepared by PCR amplification according to the manufacturers protocol (RHS6083, Dharmacon). Libraries were pooled and 50 bp single-end sequencing was performed on an Illumina HiSeq 2500 platform (Illumina, Inc). The number of reads per sample were adapted according to the manufacturers protocol depending on the numbers of cells initially used for
library preparation (per 106cells, about 107reads were sequenced). The protocol
followed standard procedures and library representation rules of shRNA pooled
screens9. The comparison of shRNA representation in invasion-deficient and
invasion-competent cells was performed using the combination of four standard
analysis methods: redundant siRNA activity (RSA)19, RNAi gene enrichment
ranking (RIGER)20, Model-based Analysis of Genome-wide CRISPR-Cas9
Knockout21,22and HiTSelect23. The analysis focused on shRNAs significantly
enriched in invasion-deficient cells. Baseline reference was used to verify shRNA