A Computational Approach to Urban Economics
by
Shi Kai Chong
Submitted to the Center for Computational Engineering
in partial fulfillment of the requirements for the degree of
Master of Science in Computation for Design and Optimization
at the
MASSACHUSETTS INSTITUTE OF TECHNOLOGY
June 2018
@
Massachusetts Institute of Technology 2018. All rights reserved.
Signature redacted
Author ...
Center for Computational Engineering
May 23, 2018
Signature redacted
Certified by...
/
A /x (Sandy4 entland
Toshiba Professor of Media Arts and Sciences
Thesis Supervisor
Signature redacted
Accepted by ...
'constantinou
Co-Director, Computation for
esign and Optimization
MASISAC
SIS ITUE'
OF TECHNOLOGY
APR
10
2019
LIBRARIES
A Computational Approach to Urban Economics
by
Shi Kai Chong
Submitted to the Center for Computational Engineering on May 23, 2018, in partial fulfillment of the
requirements for the degree of
Master of Science in Computation for Design and Optimization
Abstract
Cities are home to more than half of the world population today and urbanization is one of this century's biggest drivers of global economic growth. The dynamics of the urban environment is thus an important question to investigate. In this thesis, techniques from statistical modeling, machine learning, data mining and economet-rics are utilized to study digital traces of people's everyday lives. In particular, we investigated how people influence the economic growth of cities, as well as how the urban environment affect the decisions made by people.
Focusing on the role of cities as centers of consumption, we found that a gravity model based on the availability of a large and diverse pool of amenities accurately explained human flows observed from credit card records. Investigation of the con-sumption patterns of individuals in Istanbul, Beijing and various metropolitan areas in the United States revealed a positive relationship between the diversity of urban amenities consumed and the city's economic growth. Taking the perspective of cities as hubs for information exchange, we modeled the interactions between individuals in the cities of Beijing and Istanbul using records of their home and work locations and demonstrated how cities which facilitate the mixing of diverse human capital are crucial to the flow of new ideas across communities and their productivity. This con-tributes to the body of evidence which supports the notion that efficient information exchange is the key factor that drives innovation. To investigate how urban environ-ments shape people's decisions, we study the social influence city dwellers have on each other and showed how face-to-face interaction and information exchange across different residential communities can shape their behavior and increase the similarity of their financial habits and political views in Istanbul.
Thesis Supervisor: Alex (Sandy) Pentland
Title: Toshiba Professor of Media Arts and Sciences
Acknowledgments
This could not have happened without so many people. First and foremost is my
research advisor, Professor Alex 'Sandy' Pentland. His encouraging leadership has
made every meeting inspiring and every day at the lab a joy. I am extremely grateful
for the opportunity to work in Human Dynamics and could not have asked for a
better advisor.
Next are my unofficial mentors and collaborators at Human Dynamics: Xiaowen,
Yan, Dhaval, Mohsen, and Yuan. The work that we have done together inspired this
thesis and I have learned so much from just watching you guys be awesome.
Other than my mentors and colleagues, there is an amazing group of friends and
family who have supported me in many ways. Mom, the toughest person I know.
My proofreaders Bryan and Jeslyn who have kindly volunteered hours of their lives
to correct my fourth-grade spelling mistakes. Countless others including Pann, Leo,
Jazmin, Sharon, Seth, and Louis who have in their own unique ways made the cold
of Boston a little warmer.
Contents
1 Introduction 15
1.1 O verview . . . . 15
1.2 Thesis Contributions . . . . 16
2 Good cities are goods 19 2.1 Introduction . . . . 19
2.2 Related Works . . . . 20
2.3 Data and Amenities Studied . . . . 21
2.4 A Model of Human Flow . . . . 22
2.4.1 The Huff Model . . . . 22
2.4.2 Attractiveness of a Region . . . . 23
2.4.3 Results of Model Fitting . . . . 23
2.5 Effects of City Amenities on Growth . . . . 26
2.5.1 Inferring Amenities Diversity from Consumption Data . . . . 26
2.5.2 Measuring Growth in Urban Environments . . . . 27
2.5.3 Mathematical Formulation . . . . 29
2.6 Conclusion . . . . 33
3 Interaction and Innovation 35 3.1 Introduction . . . . 35
3.2 Related Works . . . . 36
3.3 Data and Descriptive Statistics . . . . 37
3.4 Measuring Interaction Diversity . . . . 42 7
3.4.1 Modelling individual interactions . . . .
3.4.2 Individual Interaction Diversity at Work . . . . 3.4.3 District Level Diversity . . . .
3.5 Effect of Interaction Diversity on Productivity . . . .
3.5.1 Relationship between Diversity and Economic Output . .
3.5.2 Estimating the Effects of Diversity on Economic Output
3.6 Generalized Propensity Score and Robustness . . . .
3.6.1 Framework . . . . 3.6.2 R esults . . . .
3.7 Application to Urban Transportation Planning . . . . 3.7.1 B eijing . . . .
3.7.2 Istanbul . . . .
3.8 Conclusion . . . .
4 Social Interaction and Preferences
4.1 Introduction . . . . 4.2 Related Works . . . . 4.3 Social Interactions and Financial Decisions
4.3.1 Methodology . . . .
4.3.2 Results . . . . 4.3.3 Conclusion . . . . 4.4 Social Interactions and Election Outcomes
4.4.1 Methodology . . . .
4.4.2 Results . . . . 4.4.3 Predicting Voting Outcomes . . . .
4.4.4 Conclusion. . . . . 4.5 Conclusion . . . . 5 Conclusion A Appendix 8 42 . . . 43 . . . 44 . . . 44 . . . 44 . . . 46 . . . 53 . 53 . . . 55 . . . 60 . . . 60 . . . 61 . . . 64 67 . . . . 67 . . . . 68 . . . . 68 . . . . 69 . . . . 70 . . . . 72 . . . . 72 . . . . 73 . . . . 77 . . . . 78 . . . . 79 . . . . 80 81 85
List of Figures
2-1 Correlation between actual flow and flow predicted by Huff model. Each data point corresponds to the correlation between the predicted outflow and actual outflow from a district. . . . . 24 2-2 Graph of City GDP vs Total Insurance Valuations in log scale. The
high correlation suggests that insurance sales can be used as a valid proxy for GDP . . . . 29 2-3 Graph of growth vs diversity of goods consumed. Each data point
corresponds to a district in Beijing. Left - Full correlation. Right
-Partial correlation after controlling for other variables. . . . . 31
2-4 Graph of growth vs diversity of goods consumed. Each data point corresponds to a district in Istanbul. Left - Full correlation. Right
-Partial correlation after controlling for other variables. . . . . 31 2-5 Graph of growth vs diversity of goods consumed. Each data point
corresponds to a county in United States. Left - Full correlation. Right
- Partial correlation after controlling for other variables. . . . . 32
3-1 Distributions of age and gender of the sampled residents of Istanbul 38 3-2 Heat map of work districts for resident of Istanbul . . . . 38 3-3 Heat map of work districts for resident of Istanbul . . . ... 39
3-4 Heat map of home districts for residents of Beijing (log scale) . . . 40
3-5 Heat map of work districts for residents of Beijing (log scale) . . . . . 41
3-6 Interaction Diversity (Left) and Economic Output (Right) for the city of Istanbul. . . . . 45
3-7 Interaction Diversity (Left) and Economic Output (Right) for the city
of B eijing. . . . . 45
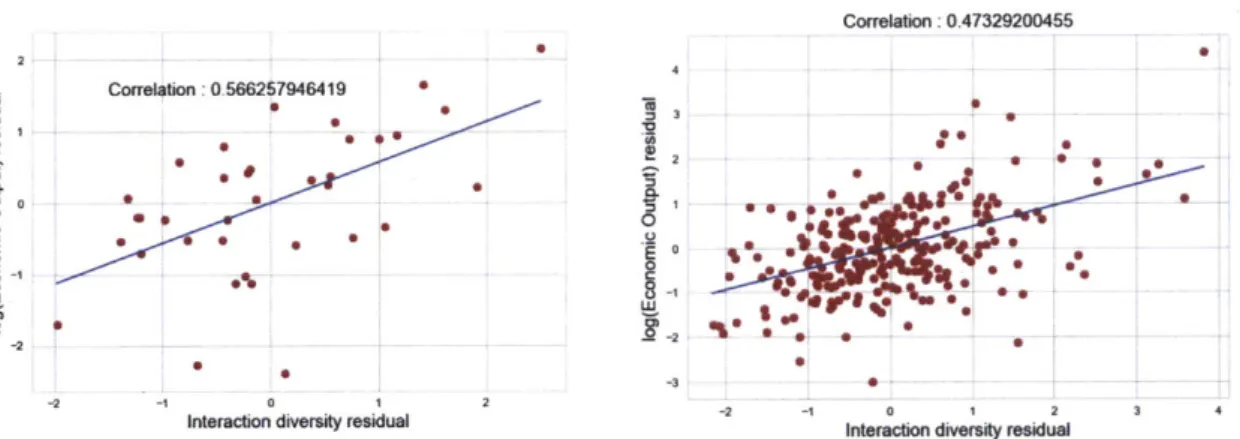
3-8 Interaction Diversity vs Economic Output. Left plot shows the results for Istanbul, and the right plot shows the results for Beijing. . . . . . 46
3-9 Interaction Diversity vs Economic Output, after controlling for popu-lation density . . . . 48
3-10 Average treatment effect estimated using propensity score method - Is-tanbul. Points indicate actual data. Black line depicts the relationship obtained using a univariate regression, while coloured lines represent the independent effect of diversity after account for other variables. 56 3-11 Average treatment effect estimated using propensity score method
-Beijing. Points indicate actual data. Black line depicts the relationship obtained using a univariate regression, while coloured lines represent the independent effect of diversity after account for other variables. . 56 3-12 Projected impact of bridging a peripheral district with a central district
in Beijing. Left - Linear scale, Right - Log scale . . . . 61
3-13 Projected impact of bridging two districts in Istanbul . . . . 62
3-14 Istanbul subway line in 2015. Potential extensions are marked by dot-ted circles . . . . 63 3-15 Projected impact of subway line extension to Pendik . . . . 63
4-1 Percentage of churners in peer group characterized by Age . . . . 71
4-2 Percentage of churners in peer group characterized by Income . . . . 71
4-3 Percentage of churners in peer group characterized by Work
Neighbor-hood ... ... 71
4-4 Percentage of churners in peer group characterized by Home
Neighbor-hood ... ... 72
4-5 Scatter plot of average KL Divergence between pairs of voting outcome and the social bridge index between the two neighborhoods. . . . . . 74
4-6 Distribution of election results projected on the 3 dimensional proba-bility simplex. X marks the election outcome of a particular district. The left plot shows the distribution of results for other districts with relatively low bridge index, the right shows that for districts with
rel-atively high index. . . . . 75
4-7 Posterior probability distributions of parameters co and ci, obtained via MCMC sampling method. The mode of the distribution (MAP estimate) is marked by the red dotted line. . . . . 77
4-8 Distributions of synthetic samples of Pk generated using parameters obtained from MAP estimation. Left, center and right plot corresponds to voting outcomes of neighborhoods with social bridge index of Bik =
0 ,Bjk = 0.45 and Bik = 0.90 respectively. X marks the spot for P. . 78
4-9 Performance of predictors using different metrics of similarity . . . . . 79
List of Tables
2.1 Fitting Results for Huff Model . . . . 25
2.2 Regression Table for consumption diversity . . . . 33
3.1 Regression Table for City of Istanbul . . . . 50
3.2 Regression Table for City of Beijing . . . . 51
3.3 Explanatory Strength of Variables . . . . 52
3.4 Regression table for estimating effects of covariates on treatment . . . 57
3.5 Regression Table for E[Yls] using polynomial approximations - Istanbul 58 3.6 Models of Economic Productivity . . . . 59 3.7 Regression Table for E[Y~s using polynomial approximations - Beijing 59
Chapter 1
Introduction
1.1
Overview
Urbanization is one of the leading trends in the 21st century. As recent as 100 years ago, only 2 out of 10 people lived in cities, but more than half of the world's population today live in urban areas [151. According to the World Health Organization, this proportion will increase to 70% by 2050 [1].
It is therefore important to understand how our behaviors shape these cities, and how cities influence us, as understanding the dynamics of people in an urban environment can help us better plan our cities and improve our standard of living
[11.
The advent of the digital age has enabled us to record and track our daily activities on an unprecedented level. Digitized financial systems, ubiquitous mobile electronic devices and wireless communication technologies all come together to allow us to study human activity not only in a non-intrusive manner but also at an unprecedented level of granularity.
In this thesis, we investigate how people influence the economic growth of cities, as well as how the urban environment affect the decisions made by people. Combining techniques from statistical modeling, machine learning, data mining and economet-rics, a computational approach that focuses on the behaviors of the agents in the community is adapted to better understand urban behavior.
1.2
Thesis Contributions
This thesis is divided into 3 parts. First, we develop a consumption-based theory of cities to explain the movement of people into cities and how the attractiveness of a city as a commodity to individuals can be a factor in determining its economic growth. Secondly, we take the perspective of cities as a nexus for information exchange and look at the relationship between diversity of interactions and the economic produc-tivity in different regions of the cities. Finally, we utilize location data to estimate social influence between communities. We then look at how social influence can help explain financial decisions and political preferences. Overviews of the contributions each chapter are given below.
Chapter 2 : Good cities are goods
Cities have become more than just economic centers that boost production due to the low cost of compatible labor and raw materials. As rent increases at a faster rate than wages [23] , there is evidence to suggest that the growth of cities is not entirely motivated by better productivity (and the resulting increase in income), but there is something inherent in living in cities that is worthwhile to the individuals. The desirability of urban amenities gives rise to the idea that the city acts as a nexus for the consumption of a large variety of goods and services, and this is the primary allure of urban life.
While the idea of the 'consumer city' has been used to explain population growth in previous literature, little has been done to study economic growth from this per-spective. In this chapter, we propose a dynamic relationship between the inflow of people into the cities and the attractiveness of the urban amenities. Good urban amenities lead to the inflow of people and growth of cities. The resulting increase in urban density, in turn, facilitates investments and the creation of even more diverse amenities. Specialized shops that require larger pools of the population in order to reach satisfactory levels of demand are economically viable only in bustling cities. We provide evidence of this dynamic relationship by first showing that the flow between
districts of Istanbul can be accurately modeled by a gravity model that takes into account diversity of amenities in the region. Next, we show that the diversity of goods and services consumed by individuals in each district is positively correlated to its growth in the future.
Chapter 3 : Interaction and Innovation
According to the Solow model of economic growth, the long-term growth of the econ-omy is based on the rate of technological change [43]. When labor and capital reaches an equilibrium, it is innovation and new ideas that help increase productivity. Ideas are not created in a vacuum, and innovation, most of all, is driven by collaboration. Different people, working on different things, colliding together in unexpected ways is what brings about important new ideas. Cities provide an environment in which connections and information exchange can take place rapidly and easily.
Existing literature that supports this idea largely focuses on how the number of social ties facilitates information. In this chapter, we investigate how the diversity of these ties relate to the flow of ideas across communities. We test the hypothesis that vibrant cities which facilitates the mixing of diverse human capital are crucial to the flow of new ideas and our continued ability to innovate and remain productive. We begin by modeling interactions between individual by creating a network where people are joined based on their geolocation data. A metric of the diversity of their interactions based on Shannon entropy was then be computed from this interaction network. We investigated the effect of interaction diversity on the productivity of the region via multivariate Ordinary Least Squares (OLS) regression and general propensity score matching and found a positive marginal effect of diversity, which supports our claim that heterogeneous interactions and information exchange is the key to innovations in cities.
Chapter 4 : Social Interaction and Preferences
Having focused on how people can shape the city's productivity in the previous chap-ter, we turn our attention to how the urban environment can shape peoples' decisions. While we think of ourselves as independent, rational economic agents, social influence plays a large part in determining the decisions we make. Studies have shown that people with similar music preferences and choice of physical activities tend to have more face-to-face interactions with each other [44, 29]. We investigate how work and social interactions in an urban environment lead to a similarity in preferences.
Dong et al. have shown that consumption similarity between pairs of residential communities can be predicted by the extent of overlap between the work locations of people in these communities [17]. Community behaviors become similar through face-to-face exchanges of people at work, and this effect on co-purchase behavior is shown to be significantly stronger than effects of demographics like age, income, and gender, or even the geographical proximity between the two residential communities. Our work in this chapter further develops this idea of how living communities are connected via social bridges by providing evidence on how communities which are connected in the same fashion can have financial behavior and political preferences that are similar to each other. We show that churners (people who stopped using their credit cards) exist in higher concentrations in certain work and living communities than we expect at random, indicating that. In addition, we showed that voting outcomes are more similar between regions that have high social bridge index, and that knowledge of the voting outcome in one district greatly reduces the uncertainty of the outcome of another district that has high interaction rates with that district.
Chapter 2
Good cities are goods
2.1
Introduction
Why do people live in cities? Cities, with its high population density, aid in
productiv-ity for firms, which in turn passes down these benefits via higher wages to individuals
125]. But high population density also leads to problems. With their dirty streets and polluted air, global hubs like London, Hong Kong, and New York were plagued with infectious diseases in their early days. Today, they are faced with a new set of issues
- inequality [14]. Social segregation is prominent, and advantaged and disadvantaged neighborhoods can exist right next to each other. Why then do people still flock to cities?
Economists largely take the view of the city as a production center where people move into cities for work. Much of economic literature focuses on the role that reducing transport costs play in attracting firms and increasing their productivity
[42, 16, 21].
However, as Glaeser et al. has pointed out, cost of living in cities has risen more than proportionately compared to the premium of city wages, providing evidence that cities must also be looked at as a good that provides utility to the individual other than just increases in urban productivity
[23].
If there is an opportunity cost in terms of disposable income for working in cities, there must be something of inherent valuefor city dwellers to continue to work, live, and play in these area. The role that cities play outside of work can be just as important. Just as the elimination of transport costs between firms improves productivity, the high density of people in cities can offer a social life and commodities that are unavailable in other environments.
We review the existing literature that takes the perspective of the city as a com-modity in Section 2.2. Section 2.3 outlines the datasets utilized and the amenities studied in this chapter. In section 2.4, we show how the flow of human traffic between districts of a city can be explained by the diversity of urban amenities in each region
by fitting a gravity model to a set of geo-tagged credit card records from Istanbul.
Finally, in Section 2.5, we explain the dynamic relationship between amenities and economic growth and provide evidence of this relationship by showing that consump-tion diversity of amenities in different regions of the city can be used to explain the difference in growth rates.
2.2
Related Works
Following the basic framework, if the prevalence of urban living has been based on consumer amenities, then wages after controlling for the local cost of living should have fallen in these big cities. Past work
1231
that investigated the consumption-based theory of urban economics used the difference between the increase in wages and increase in cost of living as a proxy of the strength of 'urban amenities' in the area and found strong correlation between the degree of this wage-living cost gap and the growth of the city in subsequent years. More recently, to directly investigate whether cities actually facilitate different forms of entertainment, Glaeser and Gottlieb utilized the 1998 DDB Needham Life Style Survey and investigated the connection between city growth and different forms of leisure consumption.[22]With detailed transaction data available, the consumption habits of the residence can be investigated directly. In this chapter, data collected on expenditures will be utilized to study the relationship between consumption patterns of people and growth
of cities in China, United States, and Turkey. Specifically, under the framework of looking at cities as commodities, the hypothesis that a rich variety of services and consumer goods acts as a catalyst that promotes growth in the region will be investigated.
2.3
Data and Amenities Studied
3 datasets are utilized in this chapter to study urban environments in 3 different
countries - Turkey, China, and the United States. The first data set is a set of
geo-tagged credit card transactions of Istanbul that covers the expenditure of 60,000 people over a period of 1 year, from June 2014 to June 2015. It contains in total roughly 22 million transactions.
Secondly, to study the consumption patterns of individuals in the United States, the publicly available Yelp Data Challenge dataset is used. The dataset includes data on 26149 businesses, 654135 users across 42 different counties in the United States from 2009 to 2015.
Thirdly, data on consumer behavior for people in Beijing, China was collected from the Chinese phone apps Meituan and Dianping. These phone apps are similar to Groupon and Yelp respectively, where users can purchase discount coupons and look up reviews for various amenities in the city. A total of 136 thousand deals offered
by 6500 food businesses during four months, ( November and December 2016, and
April and May 2017) are considered. A total of two million customers are in this dataset.
The Internet prompted improvements in logistics and supply chain operation, and the ubiquitousness of online business models means that manufactured goods are na-tional goods that are easily transported. However, cultural goods such as restaurants and theaters are confined to a locality and are representative of the attractiveness of a region as commodities. As such, the scope of goods studied in this section is limited
to restaurants, public spaces such as parks, and entertainment venues such as clubs and theatres.
2.4
A Model of Human Flow
In this section, preliminary evidence that urban environments can be thought of as a consumer good is presented. Using the Istanbul credit card data set mentioned in section 2.3, we begin by building a directed network of human flows between districts of Istanbul, where nodes are districts. Let the set of individuals hat reside in district i be Si. Let the set of transactions by person k that occurs in district
j
be Tkj. The network edge weight is then given byWij=
I
ITkI (2.1)kESi
In other words, an edge is established from district i to j if a consumer that lives in district i conducts an in-person transaction in district j. The weight of this edge is the sum of the number of such transactions.
2.4.1
The Huff Model
Next, the Huff Model [30] is fitted to the network to predict the flows between districts. The Huff model is a theory in spatial analysis that is based on the principle that the probability that consumers in district i will visit and purchase something at district
j
is a function of the relative distance Dij and attractiveness Aj to that district.Wj f(AjDi) (2.2)
Pi Ej Wij Ej f (Aj , Dij)(2)
where
As
f(A,
Dij) = D7 (2.3)2.4.2
Attractiveness of a Region
We consider the attractiveness as proportional to the number of points of interests
(#POI) and the diversity of these POIs (D[POI]) (raised to powers)
Ai
=
#PO~jD[PO1
3]'
3(2.4)
Let the distribution of types of POIs (denoted by k) in a district
j
be P(i. In
other words, the fraction of POIs of type k in district j is P(i. Data on the POIs are
obtained from the geojson database of the Istanbul city. The breakdown of categories
of POIs in this model can be found in the appendix, under 'POIs studied in Istanbul'.
The metric for the diversity of the POIs is then defined to be the Shannon Entropy
[41] of the distribution P(A.
D[POI]
-P() log (Pj))
(2.5)
k
In statistical physics, Shannon entropy of a system is a measure of the number of
permutations of the states of the system
[321.
In the context of urban amenities, it
measures the number of different ways to combine these amenities together, therefore
giving us a metric of the variety of experiences that city dwellers obtain from this
mix of amenities.
2.4.3
Results of Model Fitting
Putting equations 2.3 to 2.5 together gives us the following equation for modelling of
inter-regional flow:
fA.
#POID[POIj
3#P017
kp)
log(26)
We independently optimized the parameters a, /3and -y for each district i by
exe-cuting a grid search to maximize the Pearson correlation between the predicted flow
Pi and actual flow
W-ifor all
j
5 i. Table 2.1 summarizes the optimal value of
zj
W"
these parameters for each of the 37 districts in Istanbul, as well as the optimal values
of the correlation. Figure 2-1 show the distribution of the correlation for different
districts. The median correlation between the actual and predicted values of flows is
0.965 . This shows that a simple model that only takes into account the attractiveness
of the urban amenities and physical distance can accurately account for the difference
in the flows to the different districts of Istanbul.
Huff model
performance
0.95
0.9
0.85
0.8
Pearson Correlation between Huff model results and real data
Figure 2-1: Correlation between actual flow and flow predicted by Huff model. Each
data point corresponds to the correlation between the predicted outflow and actual
outflow from a district.
distid I alpha [beta
I
gamma [correlationGUNGOREN
ATASEHIR BEYKOZ ZEYTINBURNU CATALCA BEYOGLU SILIVRI BESIKTAS. BAKIRKOY SANCAKTEPE ESENYURT KADIKOY BASAKSEHIR SARIYER BUYUKCEKMECE USKUDAR UMRANIYE PENDIK BAYRAMPASA BAGCILAR ESENLER BAHCELIEVLER EYUP FATIH SULTANGAZI TUZLA AVCILAR KARTAL SULTANBEYLI GAZIOSMANPASA SISLI BEYLIKDUZU KUCUKCEKMECE KAGITHANE CEKMEKOY MALTEPE 0.1 2 2.1 0.1 7.8 0.5 0.8 1.5 0.9 3.2 0.1 0.9 0.3 0.5 0.1 1.7 1 0.9 0.1 0.3 0.1 0.1 0.5 0.7 0.1 1 0.1 0.6. 0.7 0.1 0.2 0.1 1 9.6 10 8.7 1 1 1 1 1 1 1 1 1 1 1 1 1 1 1 1 1 1 1 0.65 0.01 1 1 1 0.01 1 1 0.01 0.79 1 1 0.52 1 1 1 1 Table 2.1: Fitting Results1.3 1.5 2.8 1.5 4.5 1 1.7 1.3 2 2.5 1.2 1.2 0.8 1 0.9 1.2 1.2 1.1 3.9 1.3 0.9 1.3 1.3 1.2 0.5 0.8 1.2 1 1.7 1.2 3 0.8 1.5 5.2 6.7 3.8 I I
for Huff Model
0.937147632 0.978274656 0.962100308 0.938162609 0.97298094 0.927952872 0.997879839 0.910566208 0.994207467 0.969306363 0.991810813 0.979354292 0.95752516 0.956966486 0.960407806 0.970851893 0.990459117 0.989295554 0.99282278 0.984578566 0.849068355 0.953233422 0.974188064 0.952227554 0.851402823 0.7717083 0.970743573 0.973212598 0.984048174 0.975509769 0.982715353 0.959181481 0.995161832 0.990837253 0.947143437 0.956963904 25 . - . . -, -1 - N., . -., .- _- - - ., . I - 409a""WAL
|
|
2.5
Effects of City Amenities on Growth
In the previous section, we presented evidence that the flows between different dis-tricts in the city of Istanbul can be explained by the attractiveness of the local goods found in each of the different districts. How then can the flow of people into attractive areas of the cities help explain its growth?
The flow of people and resources catalyzes the production of even more diverse goods and services. Cities provide a critical mass of consumers for industries that benefit from economies of scaling such as sports teams, museums, and even niche restaurants. This makes it likely for business owners to pump money into these urban areas, which can support a large variety of specialized businesses, such as restaurants that specialize in a wide range of cuisines.
This sets up a dynamic process in which entrepreneurs respond to the flow of people by offering diverse amenities, and amenities provide the conditions, both in terms of their inherent utility and new work opportunities, to continuously attract a flow of people and allow the economy to expand.
If the above mentioned dynamic model holds, information on the availability of a large set of local goods and services should help inform us of the growth of cities in the near future. In this section, we explore how detailed records of consumption for residents in urban areas can be utilized as signals about the growth of the area.
2.5.1
Inferring Amenities Diversity from Consumption Data
We begin by obtaining the set of local businesses that exist within each regional unit
j,
SW . The regional unit defined in these studies are districts (and in the case ofUnited States, the units are counties). These sets of local businesses are divided based on their categories k into subsets Sj. These categories include types of restaurant, like Japanese, Mexican etc., or types of facilities like park, movie theatres etc., based on the nature of the businesses. Additional information about the categories can be found in the appendix.
From credit card expenditures in Istanbul and Dianping/Meituan dataset in China, the consumption of a good or service is directly obtainable. For the Yelp data set in the United States the rate of consumption of a good or service i, Ci is estimated
by adding up the total number of customers who have either checked in, rated, left a
review, or posted a picture about the amenity. Thus, for each district
j,
we are able to obtain the proportion of consumption in a particular category k , Pfj)P(A ZESk(2.
k Ek EiS~i 0 (.7
Similar in Section 2.4 ,we define a metric of diversity of urban amenities consumed
by people in the area
j
as the Shannon entropy of P)A3 = -Pf log (PO) (2.8)
k
By obtaining different sets of amenities that were consumed by users across
dif-ferent time periods, we are able to investigate the effects of the attractiveness of local goods on growth across different years.
2.5.2
Measuring Growth in Urban Environments
There are various definitions of growth of a city. In one definition, city growth is the increase in population over time. For emergent, low-density cities that have recently boomed due to the decentralization of businesses from central capitals, this is indeed a good measure of growth
[351.
For other cities that have achieved a level of.maturity, such as Beijing and Istanbul, growth would arguably be measured better using another indicator. While populations have not grown sharply in these cities in the last 5 years, the existing density of housing and local regulations governing construction mean that growth results in more renewals and renovation of older districts into middle-class regions (gentrification) than in population growth.Beijing
As such, we measure the economic development in different regions of Beijing by the total capital asset of secondary and tertiary sectors in each Beijing district. Capital accumulation is a key determinant of positive economic growth in many established economic models, and thus we take this metric as an indicator of future economic growth.
Gjte ~Capital accumulation of businesses in district
j
at time t (2.9)Istanbul
We measure growth of Istanbul via changes in its economic output between 2014 and
2016.
GD P,to - GDP,t
Gjt
GD 1,
(2.10)'
GDP,,
Since official GDP records from Turkey are only published with granularity at a city level, another data set was used as a proxy for GDP at a finer district level. The proxy used is the sum of insurance sales in each district provided by the Aksigorta Insurance Company.
Among all the insurance categories, only four categories were considered : Home, Workplace, Vehicle liability, and Vehicle Collision insurances. The reason why these insurance types were chosen is that all of them are based on physical assets like buildings or vehicles, which is a more direct measure of economic output. In order to test whether the chosen insurance types can be used as proxy for GDP, the district-level insurance sales in the chosen four categories for 80 cities in Turkey for the year 2014 was summed up and compared with published GDP of those 80 cities in the same year. The evaluation metric used was Pearson correlation, which was found to be 0.99249 between two sets (see figure 2-2 below). The result shows that insurance valuations published by Aksigorta could serve as a via proxy for GDP at the district level.
log(City
GDP)
22 24
Figure 2-2: Graph of City GDP vs Total Insurance Valuations in log scale. The high
correlation suggests that insurance sales can be used as a valid proxy for GDP
United States
Similar to Turkey, we measured the growth of counties via changes in its economic
output. Again, since official GDP records are only published at a state level, we
approximated it via the sum of personal incomes in each county
j,
which is obtained
via the United States census bureau.
Gjt
~
Total Personal Incomej,t+i
-
Total Personal Incomej,'
Total Personal Incomej,t
(2.11)
2.5.3
Mathematical Formulation
The relationship between economic growth, G and consumption diversity, H is
mod-elled with the following equation:
Gjt
=
3 +
1Hj,t +
!2pj,t+ f3Ij,t + 3
4Dj,t + cj,t
(2.12)
0 19 18 17 15 15 15 1 40* ^0 14 twhere G,,
,Pp,
,Ij, ,D,,t is the growth rate, consumption diversity, population
density, housing index and eigenvalue centrality of the district
j
at time t respectively. The control variables are explained below.Population Density
The population density pj,t is defined as the number of people per unit area (in
1000/kM
2).
Housing Index
Rental prices act as a buffer that regulates investment into the region. Increase in
rental prices may discourage businesses to be physically set up in the region, or reduce
the supply of labor as individuals are reluctant to move into the area. To account for the effects of property prices on growth, Ij,t is included as a covariate, which is defined as the ratio of the current rental price (per unit area) to the cheapest rental
in the first time period to
Rent=,t
(2.13)
Rent*,t)
where
j*
arg min Rentj,to3
Eigenvalue Centrality in a Geographical Network
The success of a district is highly dependent on its location in the city. Generally speaking, the more central the location, the easier the access to the business, and
therefore the more likely it would attract customers. To control for the location factor, we first computed a geographical network of districts with the edges between districts
i and
j
weighted by the reciprocal of the travel distance (in measured in minutes)between them. We then computed the eigenvalue centrality of each business in this geographical network
[36].
12 10Correlation 0.5410297.'78856 U~ 4 0 S o , -41- -00 05 10 15 20 25
Local goods and service consumption diversity, H
Correlation 0.4195160668 3 0 S 0 S '0 0 0 -3 -- _----2 -10
H residual, after control
Figure 2-3: Graph of growth vs diversity of goods consumed. Each data point
cor-responds to a district in Beijing. Left
-
Full correlation. Right
-
Partial correlation
after controlling for other variables.
-Correlat on 0 710495864548
14 1B 1A 11 10 19 20 21
Local goods and service consumption diversity, H
S
. 3
2
Partial Correla on 0.123609(34336
-2.0 -15 -10 -0. o Q5 10 15 2
H residual, after control
Figure 2-4: Graph of growth vs diversity of goods consumed. Each data point
cor-responds to a district in Istanbul. Left
-
Full correlation. Right
-
Partial correlation
after controlling for other variables.
Making the assumption that noise E is homogeneous, we can fit an ordinary least
squares (OLS) regression to obtain the optimal parameters of the model. Figures 2-3
through 2-5 shows the relationships between the two variables in question. In all 3
cases, we see that the diversity of consumption exhibits significant statistical positive
correlations with the growth in the region in the following year at 0.54 (Beijing, Fig
2-3)
,
0.71 (Istanbul, Fig 2-4), and 0.52 (US, Fig 2-5). Even after controlling for
the above mentioned covariates, the two variables still exhibit significant statistical
Results
0 020 40 -0 a(11 Correlation Q523t6O1O4176 Partial Correlation: 0.572012755694 *
-410
00
S%
05 10 15 20 2.5 2.5 -3 -2 -1 0
Local goods and service consumption diversity, H H residual, after control
Figure 2-5: Graph of growth vs diversity of goods consumed. Each data point
corre-sponds to a county in United States. Left
-
Full correlation. Right
-
Partial correlation
after controlling for other variables.
partial correlations at 0.41 (Beijing, Fig 2-3), 0.72 (Istanbul, Fig 2-4), and 0.57 (US,
Fig 2-5), providing evidence of how the attractiveness of local goods and services can
be a determinant of growth in the future via the dynamic process described above.
The model is also observed to have a poorer fit for the study conducted in the
counties of United States, with an R
2of 0.357 (Table 2.2). This might be attributed
to the geographically sparse, and possibly biased, data sample. The Yelp data set
obtained only contained data on a subset of metropolitan areas and states that were
geographically distributed across different areas of the United States, as opposed to
the districts studied in China and Turkey, which were all contained within the same
city and provided a complete picture of Beijing and Istanbul respectively. In addition,
the counties sampled differed across time periods t.
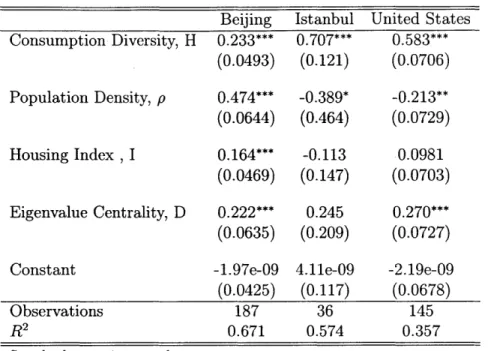
Beijing Istanbul United States Consumption Diversity, H 0.233*** 0.707*** 0.583*** (0.0493) (0.121) (0.0706) Population Density, p 0.474*** -0.389* -0.213** (0.0644) (0.464) (0.0729) Housing Index , I 0.164*** -0.113 0.0981 (0.0469) (0.147) (0.0703) Eigenvalue Centrality, D 0.222*** 0.245 0.270*** (0.0635) (0.209) (0.0727)
Constant -1.97e-09 4.11e-09 -2.19e-09
(0.0425) (0.117) (0.0678)
Observations 187 36 145
R2 0.671 0.574 0.357
Standard errors in parentheses
p < 0.05, ** p < 0.01, *** p < 0.001
Table 2.2: Regression Table for consumption diversity
2.6
Conclusion
In this chapter, we have shown that data from 3 different countries provided evidence of a consumption-based model of city growth. Within the city, the movement to different districts can be accurately described by a gravity model that takes into account the availability and diversity of points of interests such as shops and other public facilities. In addition, quantitative evidence is presented to show that cities with a higher diversity of consumption have, on average, attracted more people and investments, and have grown faster than regions with lower diversity. In spite of the use of noisy, open sourced public data from Yelp etc., there is still significant predictive power, indicating robust results.
As such, city officials should look into making their cities a more vibrant place to live in. The success of cities hinges more and more on cities' role as centers of consumption. As cities become more attractive as a commodity and grow, the inflow of people catalyzes the establishment of businesses, leading to even more diverse goods and services. In addition to providing benefit to consumers, the inflow of people from
different geographical regions will also benefit the economic productivity of the region. In the next chapter, work on how the diversity of interactions between individuals can lead to better information exchange and economic opportunities will be presented.
Chapter 3
Interaction and Innovation
3.1
Introduction
Cites are major production centers of society, but how exactly do they achieve that? It is easy to see that high population density means that there is reduced cost of transportation for labor, which allows labor-intensive industries to thrive.
Perhaps more importantly is the urban advantage in transporting ideas. Long-term economic growth is primarily driven by innovation in the society, and cities facilitate the human interaction and idea exchange needed for good ideas and true innovation.
Jane Jacobs is a great proponent of this role of cities
1311.
These ideas range from changes in means of production or product types to the most up-to-the-minute news. For example, success on Wall Street often involves knowing new events minutes before anyone else. In this environment, the informational advantages of extreme spatial proximity become very high. This may explain why Wall Street remains in a tiny physical area in the tip of Manhattan. The spatial concentration of economic actors increases productivity at the firm level by increasing the flow of new ideas, both within and across firms.What can be said about the nature of information exchanged then? Do we benefit from a dense network of people who share similar sentiments, or do we benefit from
35 Alw"hle _
interactions with people different from us? On one hand, too much of the same opinion creates echo chambers that reinforce biases and limit creativity. This school of thought calls for a diverse mix of people in the workplace. People originating from different communities may trade different sets of information that could alleviate biases and possibly lead to innovative outputs. On the other hand, establishing a group consensus is fundamental for productive activity, and diversity can make it difficult to agree on a particular strategy. This chapter investigates this question.
This chapter begins with a discussion of existing literature which investigates how the rate of information flow affects the level of innovation and productivity in cities. In Section 3.3, we give an overview of the data used in this chapter. We then discuss the techniques used to model the interaction diversity of individuals in Section 3.4 and investigate its. effects on economic productivity in Sections 3.5 and 3.6. Finally, we illustrate the potential applications of our findings in the field of urban transportation planning in Section 3.7.
3.2
Related Works
Studies of urban scaling focus on how the urban characteristics of the region, such as economic productivity, relate to population density [7, 8], and superlinear scaling of characteristics such as GDP with population density has been consistently ob-served. More recently, Pan et al. argues that the underlying mechanism behind the superlinear scaling phenomena is the establishment of more network ties in denser populations [38]. As the density of population increases, so does the average number of people each resident personally interacts with. The increased rate of information exchange results in more ideas and opportunities, which then lead to the increase in productivity observed. Building on this, Sim et al. included transportation time as a factor that determines the number of social ties established in a city [42].
While most work have focused on how the number of ties facilitates information
flow, there has been some recent studies that investigated the effect of the diversity
of these ties on economic well being. Brummitt et al. investigated the diversity of
occupations of residents in cities of United States and found no relationship between
diversity and productivity after accounting for population [12]. Instead of measuring
diversity on a city level, Eagle et. al. [181, utilized highly granular call detail records
(CDRs) of individuals to directly compute interaction diversity on a personal level and
found a positive correlation between personal income and balance of social contact.
In other words, the more interaction is spread evenly across different individuals, the
more an individual is well-off financially.
In this chapter, we test the hypothesis that diverse interactions at work leads to
greater levels of innovation and output. Building on top of these previous studies,
a study of the diversity of interaction was conducted on an individual level and its
effect on regional productivity is investigated. In addition, controlling for confounding
variables was done to get a better sense of the causal effect of diversity.
3.3
Data and Descriptive Statistics
Two cities were investigated, Istanbul and Beijing.
Istanbul
The same dataset from chapter 2 was used. Specifically, work and home location,
as well as demographic information like age, gender, income, and education levels of
60000 users in Istanbul were utilized in this study. The work and home locations
will be used to model the interactions between individuals, and the demographic
information provide information on communities that the individuals belong to. This
will be elaborated upon in Section 3.4. Figure 3-1 summarizes the distribution of
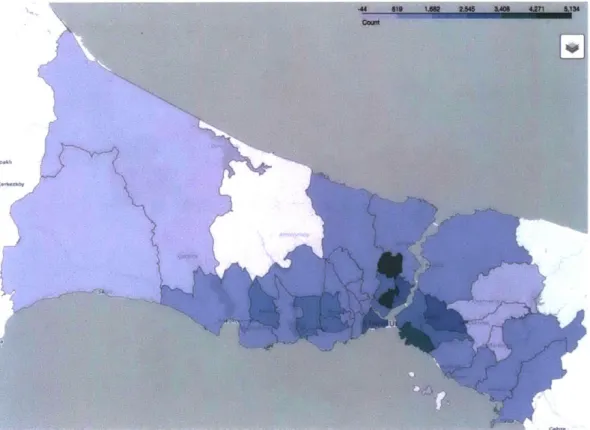
demographics for these users. Figure 3-2 and 3-3 illustrates the distribution of work
and home location throughout Istanbul.
~h1
40000 000W"
25M0 10000 U 3D V0 W3 eo 70 OD Age GenderFigure 3-1: Distributions of age and gender of the sampled residents of Istanbul
-6 531 11088 1.6" 2.2 2.72 3,317
COWS
r(J~
7
V.
'4
Figure 3-2: Heat map of work districts for resident of Istanbul
200 2D00 1500 LA =0 WO0 0
I
IN
All
2D 0 1 Ce"EMY -Jsit I= 18 2.54 SAS 4.271 5134
Opp"s
Beijing
A dataset containing home and work locations of 200000 individuals were utilized.
These work and home locations were inferred from GPS signals from their cellphones
that pinpoint an individual's latitude and longitude. Home locations are defined to
be the most frequented location visited between the hours of 9 pm to 6 am. Work
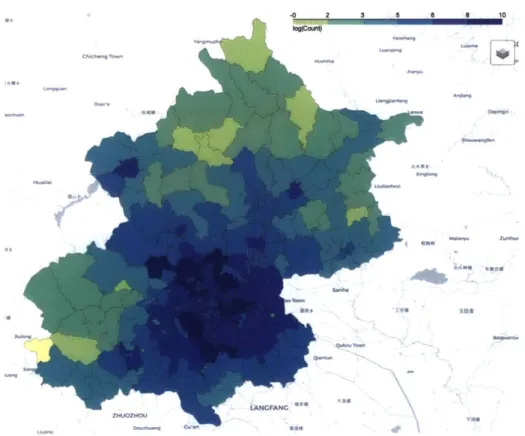
locations are defined in a similar fashion between 9 am and 6 pm. Figures 3-4 and
3-5 illustrates the distribution of home and work location throughout Beijing.
-0 1 3 5 6 a 9
WAN CC
-0 2 3 5 6 8 10
-*as
3.4
Measuring Interaction Diversity
3.4.1
Modelling individual interactions
While there has been a sharp increase in remote communications in modern times,
physical interactions between people are the key medium of information exchange[45,
19, 29, 44]. These social interactions between people include social learning through
observation (e.g., what clothes to wear or what food to order) and through
intermedi-ary interactions (e.g., word of mouth, mutual friends). To infer interactions between
people, a network of interaction was first obtained based on the individual's
prox-imity. Physical proximity has been shown to increase the likelihood of face-to-face
conversations [46, 13] and gravity models, where the interaction strength between
users decreases with increasing distance between the two, has been shown to model
interaction strength between individuals in urban environments
[?,
101. As such, we
estimate the interaction of an individual i with another person
j
by considering their
geographical proximity Lij at work. In particular, define the edge weight between
individuals i and
j
as
W= f(Lij)
(3.1)
where f(Lij) is a function of the effective distance (or travel time) between them.
A choice of
f
=
1would mean that the weight is inversely proportional to the
effective distance between individuals.
In this study, a hard threshold function is selected to reduce computation
com-plexity. An edge is defined between individuals i and
j
if the distance between their
work location is within r = 500 meters.
Weij = I if Lij < T
(3.2)
This differs from the regular gravity model in that there is a sharp threshold cut off
where people will not interact with others outside of the threshold and interactions
between users within the radius are equally probable. It has been shown that social influence between individuals decays rapidly after a distance of 500 meters.
[]
3.4.2
Individual Interaction Diversity at Work
Let the set of people that individual i is connected to be Si. We can then consider the probability that i interact with a person of a particular demographic x be
Pi) = ESiX=xWi (33)
Xj = x indicates that individual
j
has a particular demographic x. In other words, the probability of interacting with a particular demographic x is proportional to the sum of interaction strength of individuals in Si that has demographic x . Note that x can possibly be a multidimensional vector. For the study of Istanbul, x E R3, where the vector x contains information on home district, age category, gender. For the study of Beijing, x E R', where the x is home district.1. Home district:. The city of Istanbul is divided into 39 districts and the city
of Beijing is divided into 263 districts. Using the latitude and longitude of the home addresses, a home district was assigned to each individual.
2. Age category: Instead of considering the age (in years) of the individuals, categorical variables are generated by rounding the age upwards to the nearest ten : 10-19, 20-29 and so on.
3. Gender: Gender is a binary variable of either male (1) or female (0).
Based on the probabilities of interaction, the diversity of an individual's egocen-tric network can be computed. The meegocen-tric used is the Shannon entropy, which is computed via
x
Di= - PWi log(Pfi)) (3.4)
x=1
This is similar to the formulation in the work of Eagle et al. on individual cell-phone network diversity [181, but instead of measuring diversity based on different
individuals, the diversity of the attributes of different people are computed. The idea is that x represents different communities that an individual belongs to. Home districts represent a direct physical community, and individuals commonly identify themselves as part of a community based on their age and gender. This metric of diversity would therefore represent how distributed interactions of an individual are across communities, each of which may have access to different pools of information, opportunities, or offer certain perspectives. Diverse interactions should then increase the population's access to key resources required for productive activity.
3.4.3
District Level Diversity
To get the district-level diversity of district j, we compute the average individual
diversity across set Gj, which consist of people who share the same home district
j.
(Dj)
= EiEG(3.5)
|Gj|
Aggregating the customers based on their home district allows us to measure the diversity of information flow that residents obtain at work and then bring back into their home communities. The relationship between district level economic well being and the average work interaction diversity of the residents in that region can then be investigated.
3.5
Effect of Interaction Diversity on Productivity
3.5.1
Relationship between Diversity and Economic Output
The same proxies for the economic output from chapter 2 are used. Specifically, district GDP in Istanbul is approximated by the sum of insurance valuations in each district. To account for the different sizes of the districts, the economic output was normalized by taking the output per unit area, E.
FE.
=Sum of insurance valuations in district
j
(3.6)
Area of district
j
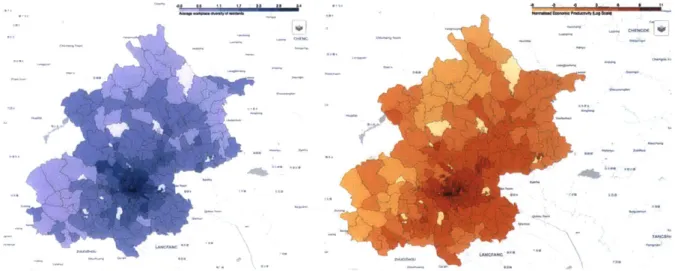
Figure 3-6 and Figure 3-7 are choropleth maps that show the average diversity of
work interactions (D), (in blue) and economic output of the district in log scale (in
red) of Istanbul and Beijing respectively. The maps illustrate a strong exponential
relationship between the (D) and E for both cities in the study. This relationship is
also demonstrated in the scatter plots in figure 3-8.
Figure 3-6: Interaction Diversity (Left) and Economic Output (Right) for the city of
Istanbul.
Figure 3-7: Interaction Diversity (Left) and Economic Output (Right) for the city of
Beijing.
15 1 0 * 1 Correlation 0.541029778856 * Correlation 0.812258492453 * 14D -V 14 4 0 0* * 10 1 4 8 I 2020 5g 0 2
Interaction Diversity, <D> Local goods and service consumption diversity, H


![[PDF] Manuel de formation pour apprendre les outils de developpement avec Ajax | Cours ajax](data:image/gif;base64,R0lGODlhAQABAIAAAP///wAAACH5BAEAAAAALAAAAAABAAEAAAICRAEAOw==)