Vol.:(0123456789)
https://doi.org/10.1007/s40273-020-00965-9 SYSTEMATIC REVIEW
An Updated Systematic Review of Cost‑Effectiveness Analyses of Drugs
for Osteoporosis
Nannan Li1 · Dennis Cornelissen1 · Stuart Silverman2 · Daniel Pinto3 · Lei Si4,5 · Ingrid Kremer1 · Sandrine Bours6 ·
Robin de Bot1,7 · Annelies Boonen6 · Silvia Evers1 · Joop van den Bergh8,9,10 · Jean‑Yves Reginster11 ·
Mickaël Hiligsmann1
Accepted: 19 September 2020 © The Author(s) 2020
Abstract
Background Considering the heavy economic burden of osteoporotic fractures, the limits of healthcare resources, and the recent availability of new anti-osteoporosis drugs, there is continuing interest in economic evaluation studies of osteoporosis management strategies.
Objectives This study aims to (1) systematically review recent economic evaluations of drugs for osteoporosis and (2) to apply an osteoporosis-specific guideline to critically appraise them.
Methods A literature search was undertaken using PubMed, EMBASE, National Health Service Economic Evaluation database, and the Cost-Effectiveness Analysis Registry to identify original articles containing economic evaluations of anti-osteoporosis drugs, published between 1 July, 2013 and 31 December, 2019. A recent European Society for Clinical and Economic Aspects of Osteoporosis, Osteoarthritis and Musculoskeletal Diseases-International Osteoporosis Founda-tion (ESCEO-IOF) guideline for the conduct and reporting of economic evaluaFounda-tions in osteoporosis was used to assess the quality of included articles.
Results The database search retrieved 3860 records, of which 27 studies fulfilled the inclusion criteria. These studies were conducted in 15 countries; 12 active drugs were assessed, including various traditional pharmacological treatments such as bisphosphonates, raloxifene, strontium ranelate, denosumab, and teriparatide, and new agents such as abaloparatide, romo-sozumab, and gastro-resistant risedronate. Eight out of 12 studies that compared traditional oral bisphosphonates to other active interventions (denosumab, zoledronic acid, gastro-resistant risedronate, and teriparatide) suggested that the other active agents were generally cost-effective or dominant. Additionally, the cost-effectiveness of sequential therapy has recently been assessed and indications are that it can lead to extra health benefits (larger gains in quality-adjusted life-year). The key drivers of cost effectiveness included baseline fracture risk, drug effect on the risk of fractures, drug cost, and medication adherence/persistence. The current average score for quality assessment was 17 out of 25 (range 2–15); room for improve-ment was observed for most studies, which could potentially be explained by the fact that most studies were published prior to the osteoporosis-specific guideline. Greater adherence to guideline recommendations was expected for future studies. The quality of reporting was also suboptimal, especially with regard to treatment side effects, treatment effect after discontinu-ation, and medication adherence.
Conclusions This updated review provides an overview of recently published cost-effectiveness analyses. In comparison with a previous review, recent economic evaluations of anti-osteoporosis drugs were conducted in more countries and included more active drugs and sequential therapy as interventions/comparators. The updated economic evidence could help decision makers prioritize health interventions and the unmet/unreported quality issues indicated by the osteoporosis-specific guideline could be useful in improving the transparency, quality, and comparability of future economic evaluations in osteoporosis.
Electronic supplementary material The online version of this article (https ://doi.org/10.1007/s4027 3-020-00965 -9) contains supplementary material, which is available to authorized users. Extended author information available on the last page of the article
Key Points for Decision Makers
In comparison with oral bisphosphonates (including generic forms), other active interventions (such as deno-sumab, zoledronic acid, gastro-resistant risedronate, or teriparatide) were generally cost effective or dominant Sequential therapy has the potential to generate extra health benefits and to be cost effective in comparison with monotherapy, although more clinical and economic data are needed
Although several studies partially followed the European Society for Clinical and Economic Aspects of Osteo-porosis, Osteoarthritis and Musculoskeletal Diseases-International Osteoporosis Foundation guideline, quality was largely insufficient for most articles. Our study highlighted that insufficiently implemented and/or reported recommendations should be included in future studies; this could be useful in improving the transpar-ency, quality, and comparability of economic evaluations in osteoporosis
1 Introduction
Osteoporosis is a skeletal disease associated with a sig-nificant health and economic burden, which has become an increasing global health problem considering the aging population characterized by multi-morbidity. The morbidity and mortality imposed by osteoporotic fractures along with the negative impact on patients’ quality of life are important clinical considerations [1]. Worldwide, osteoporosis causes more than 8.9 million fractures annually, resulting in an osteoporotic fracture every 3 s [2]. In the European Union, 22 million women and 5.5 million men had osteoporosis in 2010 [3]. As a result of changes in population demography, the annual number of fragility fractures was expected to rise from 3.5 million in 2010 to 4.5 million in 2025, correspond-ing to an increase of 28% [4]. In the USA, over 1.5 million fractures per year were attributable to osteoporosis, resulting in direct healthcare costs of 12–18 billion US dollars [5]. Improving osteoporosis care and reducing spiraling fracture-related costs pose worldwide challenges.
Health economic evaluations have become increasingly important to support the setting of priorities in healthcare and to help decision makers allocate healthcare resources efficiently in the context of limited healthcare resources, the ongoing aging of the population, and the heavy
economic burden of osteoporotic fractures, as well as the recent availability of new agents for osteoporosis manage-ment (e.g., abaloparatide, romosozumab, gastro-resistant risedronate). In 2015, a study systematically reviewed all economic evaluations of anti-osteoporosis drugs pub-lished up to 31 June, 2013 and suggested that anti-osteo-porosis drugs were generally cost effective in comparison with no treatment in postmenopausal women aged over 60–65 years with low bone mass, especially those with prior vertebral fractures. However, given the heterogene-ity of fracture risk, comparators, country setting, model structure, and incorporation of medication adherence, as well as the lack of head-to-head comparisons, it remained challenging to make comparisons between studies [6]. In addition, the quality of reporting was largely insufficient for most studies, despite the fact that guidelines for con-ducting health economic evaluations have been widely available for many years.
Recently, a guideline for the conduct and reporting of economic evaluations in the field of osteoporosis has been designed by a working group convened by the European Society for Clinical and Economic Aspects of Osteo-porosis, Osteoarthritis and Musculoskeletal Diseases (ESCEO) and the US branch of the International Osteo-porosis Foundation (IOF) [7]. Although several disease-specific recommendations for economic evaluations have been developed, this guideline is the first that provides a list of recommendations and minimum requirements for the design, conduct, and reporting of an osteoporosis-specific economic evaluation. Osteoporosis-osteoporosis-specific recommendations in this guideline, which supplement general and national guidelines, could guide research-ers in designing appropriate and high-quality economic evaluations and help decision makers and reviewers to assess the quality of these studies, and further to improve the transparency and comparability of these studies and maintain methodologic standards [7]. Therefore, assess-ing how recent studies adhere to the osteoporosis-specific guideline is important in identifying the main limitations of these studies, and further to indicate some of the most important recommendations that should be taken into account in future studies.
An overview of currently available studies regard-ing cost-effectiveness analyses of drugs for osteoporosis would thus be useful to guide researchers in designing and conducting high-quality economic evaluations, in identifying gaps in current evidence, and to help admin-istrators make decisions based on high-quality evidence. We therefore updated and undertook this review to (1) systematically identify and review economic evaluations published between 2013 and 2019 on drugs for osteopo-rosis and (2) to critically appraise their quality using the
recent osteoporosis-specific guideline, and also to provide insight into key drivers of cost-effectiveness ratios.
2 Methods
2.1 Literature Search
A systematic literature search was undertaken to identify recent cost-effectiveness analyses of drugs for osteopo-rosis according to the Preferred Reporting Items for Sys-tematic Reviews and Meta-Analyses (PRISMA) guideline [8]. The search was conducted using several databases including PubMed, EMBASE (Ovid), National Health Service Economic Evaluation Database (NHS EED) [the database ceased to be updated after March 2015] and the Cost-Effectiveness Analysis (CEA) Registry (the database can serve as an archive only until 2018). We restricted our analysis to articles published between 1 July, 2013 and 31 December, 2019, as prior articles were covered in the previous review [6]. An initial search was conducted in PubMed and EMBASE using a search strategy (see Appendix 1 in the Electronic Supplementary Material [ESM]) designed according to the Population, Interven-tion, Comparator, Outcome (PICO) criteria with the help of an expert library specialist. The key word ‘osteopo-rosis’ was used in the NHS EED and the CEA Registry database.
2.2 Study Selection
First, duplicates were identified and removed. Second, two reviewers (NL, DC) independently applied inclusion and exclusion criteria to screen titles and abstracts of the remaining articles. Third, full-text versions of eligible arti-cles were screened in-depth by two independent reviewers (NL and DC, LS, DP, SS, or RB). A consensus meeting with a third reviewer (MH) was used to resolve discrepan-cies. Finally, reference lists and citations of eligible arti-cles were checked manually for additional relevant studies. Studies were included if they were published in Eng-lish between July 2013 and December 2019 and contained a full economic evaluation (the comparative analysis of alternative interventions in terms of both costs and conse-quences) of anti-osteoporosis drugs. Non-original articles (e.g., editorials, reviews, conference proceedings), partial economic evaluations, and non-specific drug studies (e.g., only use vitamin D and/or calcium as interventions, stud-ies regarding screening strategstud-ies, intervention thresholds, medication adherence, nutrition, model of care, fracture liaison services, and lifestyle) were excluded.
2.3 Data Extraction and Quality Assessment
A standardized data-extraction form was developed to col-lect data from eligible studies. Study characteristics regard-ing publication (author, year of publication, journal), study design (country, population, perspective, model type, out-come measure, time horizon, comparators, intervention duration, cost type, discount rates, year of valuation), study outcomes (results and sensitivity analysis), and funding source were extracted by one reviewer (NL) and checked by another reviewer (DC, LS, DP, SS, RB, or IK). Incremen-tal cost-effectiveness ratios (ICERs) were reported as pro-vided in the articles. Afterwards, for comparability reasons, all ICERs were converted into 2019 US dollars using the Organisation for Economic Cooperation and Development exchange rate and inflation rate [9]. We then synthetized and analyzed ICERs of active agents compared to traditional oral bisphosphonates (first-line treatments in most countries), and of sequential therapies (e.g., abaloparatide/teriparatide followed by alendronate) by using US$100,000 per quality-adjusted life-year (QALY) gained as the willingness-to-pay (WTP) threshold. Other information such as country, treat-ment duration, and annual drug cost was also extracted. In addition, we checked included studies, especially one-way sensitivity analyses, to identify key drivers of cost effective-ness; these were eventually chosen through team discussion. The conduct and reporting quality of included articles were then appraised using the ESCEO-IOF guideline for economic evaluations in osteoporosis by two independent reviewers (NL with DC, LS, DP, SS, RB, or IK). The whole assessment consisted of two parts. Part one included recom-mendations for the design and conduct of an economic eval-uation in osteoporosis; 29 recommendations were addressed in nine categories (type of economic evaluation, method for the conduct of economic evaluation, modeling technique, base-case analysis and population, mortality, fracture costs and utility, treatment characteristics, sensitivity analyses, and outcomes). Part two was an osteoporosis-specific check-list with nine recommendations for reporting, including the reporting and justification of key modeling aspects (choice of model, transition probabilities, effect of fracture on costs, mortality, and utility) and key treatment characteristics (the effect of treatment per fracture site, the effect of treatment after discontinuation, the inclusion and approach used to model medication adherence, therapy costs, and side effects) [7].
Each recommendation of these two parts was scored using ‘Yes’ (fulfilled the requirement of reporting), ‘No’ (did not fulfill the requirement), ‘Part’ (partially fulfilled the requirement), or ‘Not Applicable’ according to the opera-tionalization of the guideline (Appendix 2 in the ESM). To estimate a score for reporting, we assigned a score of 1 for ‘Yes’, 0.5 for ‘Part’, and 0 for ‘No’. Discrepancies in rating
were resolved by consensus and consultation with a third reviewer (MH). It is worth noting that in the scoring sys-tem we excluded recommendations that were not directly connected to the quality level of studies (i.e., ‘use ICUROS data’, ‘use FRAX® or GARVAN® tools’, ‘consider sequential
therapy as intervention’, and ‘in the absence of hip/wrist specific efficacy data, use non-vertebral or clinical fracture efficacy data as replacement’).
3 Results
3.1 Results of Study Selection
Figure 1 shows the PRISMA flowchart for the identification of studies. The database search retrieved 3860 records, of which 620 were found to be duplicates and removed. We
reviewed all titles and abstracts of the remaining 3240 stud-ies and subsequently excluded 3188 articles that did not meet our inclusion criteria. Upon review of the full text of the remaining 52 studies, 25 articles were excluded for reasons such as being non-original articles (n = 2), partial-economic evaluations (n = 4), reporting on non-specific drugs (n = 13), and studies included in previous review (n = 6). A total of 27 articles were included in our study for data extraction and quality assessment.
3.2 Overview of Included Studies
The characteristics of included studies are reported in Table 1. These studies were conducted in 15 different coun-tries. The USA accounted for the largest number (n = 7); 12 studies were conducted in Asia, i.e., three each in Japan (n = 3), China (n = 3), and Iran (n = 3). Five studies were
Screening Include d Eligib ility Iden fica on
Records identified through database searching (n =3860)
PubMed:1893 Embase:1898 CEA registry:44 NHS EED:25
Records after duplicates removed (n =3240)
Abstract and title screened
(n = 3240) Records excluded (n =3188)
Full-text articles assessed for eligibility
(n =52)
Full-text articles excluded, with reasons
(n =25) Non-original articles:2 Partial-economic evaluations:4 Non-specific drugs:13 Articles included in previous systematic review:6
Studies included in qualitative synthesis
(n = 27)
Fig. 1 Preferred Reporting Items for Systematic Reviews and Meta-Analyses (PRISMA) flowchart of study selection. CEA cost-effectiveness analysis, NHS EED National Health Service Economic Evaluation database
Table 1 Char acter istics of published ar ticles assessing t he cos t effectiv eness of dr ugs f or os teopor osis Ref er ences Jour nal Countr y Study perspectiv e a Model type Outcome meas -ure Time hor izon Cos t type Discount r ates (cos ts, QAL Y) Funding sour ce A ctiv e dr ug(s) v s no tr eatment/cal -cium + vit amin D Golmohamdi et al. [ 12 ] Electr onic Ph ysi -cian Iran Healt hcar e No BMD 12 and 36 mont hs Dir ect cos ts NR NR Kw on e t al. [ 32 ] Jour nal of Bone Me tabolism Kor ea Socie tal Mar ko v cohor t model QAL Y Lif etime Dir ect cos ts 5%, 5% Tak eda Phar ma -ceutical Com -pan y Limited, Kor ea It o e t al. [ 36 ] BMJ Open U SA Healt hcar e Mar ko v cohor t model QAL Y Lif etime Dir ect cos ts 3%, 3% NR Mohd-Tahir et al. [ 17 ] Inter national Jour nal of Rheumatic Diseases Mala ysia Healt hcar e No Fr actur e e vents 0–15 y ears Dir ect cos ts NR NR Cui e t al. [ 34 ] Os teopor osis Inter national China Healt hcar e Mar ko v micr o-simulation model QAL Y Lif etime Dir ect cos ts 3%, 3% China P os tdoct or al Science F ounda -tion Gr ant, NSFC, Bei jing Natur al Science Foundation T aher i e t al. [ 33 ] Iranian Jour nal of Phar maceu -tical R esear ch Iran Healt hcar e Mar ko v cohor t model QAL Y Lif etime Dir ect cos ts 7.2%, 5% CinnaGen Cor po -ration A ctiv e dr ug(s) v s activ e dr ug(s) P ar than e t al. [ 21 ] Bone Sw eden Healt hcar e Mar ko v cohor t model QAL Y Lif etime Dir ect cos ts 3%, 3% NR V enice e t al. [ 10 ] Jour nal of Clini -cal Densit om -et ry Me xico Healt hcar e No All cos ts ar e com par ed 12 mont hs Dir ect cos ts NR NR W aur e e t al. [ 26 ] BioMed Resear ch Inter -national Ital y Healt hcar e Mar ko v cohor t model QAL Y Lif etime Dir ect cos ts 3%, 3% Amg en Inc Darbà e t al. [ 25 ] ClinicoEco
-nomics and Outcomes Resear
ch Spain Healt hcar e Mar ko v cohor t model QAL Y Lif etime Dir ect cos ts 3%, 3% Amg en S A Bar ce
-lona, Spain, and GSK
Mir aci e t al. [ 11 ] Inter national Jour nal of Phar macy and Phar maceutical Sciences Albania Healt hcar e No Av er ag e per cent -ag e of c hang e in BMD 12 mont hs Dir ect cos ts NR NR
Table 1 (continued) Ref er ences Jour nal Countr y Study perspectiv e a Model type Outcome meas -ure Time hor izon Cos t type Discount r ates (cos ts, QAL Y) Funding sour ce Sil ver man e t al. [ 22 ] Jour nal of Os teo -por osis U SA Healt hcar e Mar ko v cohor t model QAL Y Lif etime Dir ect cos ts 3%, 3% Amg en Inc Chen e t al. [ 31 ] Patient Pr ef er
-ence and Adher
ence China Healt hcar e Mar ko v micr o-simulation model QAL Y Lif etime Dir ect cos ts 3%, 3%
NSFC and Jiangsu Resear
ch on Philosoph y and Social Science in U niv ersity of Education Depar tment of Jiangsu Pr ovince K ar non e t al. [ 14 ] Cos t Effectiv
e-ness and Resour
ce Allocation Aus tralia Healt hcar e Mar ko v cohor t model QAL Y 10 y ears Dir ect cos ts 5%, 5% No funding Azar e t al. [ 13 ] Medical jour nal of t he Islamic Republic of Iran Iran Healt hcar e Decision tr ee model QAL Y 2 y ears Dir ect cos ts 3%, 3% NR Mor i e t al. [ 18 ] Os teopor osis Inter national Japan Healt hcar e, socie tal and go ver nment al Mar ko v micr o-simulation model QAL Y Lif etime Dir
ect and indi
-rect cos ts 3%, 3% NR Mor i e t al. [ 19 ] Os teopor osis Inter national U SA Socie tal Mar ko v micr o-simulation model QAL Y Lif etime Dir ect cos ts 3%, 3% Ve ter ans Affairs
Special Fellowship in Adv
anced Ger i-atr ics Mor iw aki e t al. [ 30 ] Os teopor osis Inter national Japan Healt hcar e Mar ko v micr o-simulation model QAL Y Lif etime Dir ect cos ts 2%, 2% Asahi K asei Phar ma Cor por a-tion O’Hanlon e t al. [ 35 ] Clinical Ther a-peutics U SA Healt hcar e Mar ko v cohor t model QAL Y 1.5 y ears; Lif e-time Dir ect cos ts 3%, 3% NR Y oshiza wa et al. [ 29 ] Ar chiv es of Os teopor osis Japan Socie tal Mar ko v cohor t model QAL Y Lif etime Dir ect cos ts 3%, 3% NR Chokc haler -m wong e t al. [ 23 ] Jour nal of
the Medical Association of Thailand
Thailand Socie tal Mar ko v micr o-simulation model QAL Y Lif etime Dir ect cos ts 3%, 3% NR Co yle e t al. [ 24 ] Medical Deci
-sion Making Policy & Practice
Canada Healt hcar e Mar ko v cohor t model QAL Y Lif etime Dir ect cos ts 1.5%, 1.5% NR
Table 1 (continued) Ref er ences Jour nal Countr y Study perspectiv e a Model type Outcome meas -ure Time hor izon Cos t type Discount r ates (cos ts, QAL Y) Funding sour ce Hiligsmann et al. [ 27 ] Os teopor osis Inter national Fr ance Healt hcar e Mar ko v micr o-simulation model QAL Y Lif etime Dir ect cos ts 3%, 3% Te va and Ther -ame x Li e t al. [ 15 ] The Jour nal of t he N or th Amer ican Menopause Socie ty China Healt hcar e Mar ko v cohor t model QAL Y 40 y ears Dir
ect and indi
-rect cos ts 3%, 3% NSFC, Science and T ec hnology Depar tment of Fujian Pr ovince of China Seq uential t her apies Hiligsmann et al. [ 28 ] Seminars in Ar thr itis and Rheumatism U SA Healt hcar e Mar ko v micr o-simulation model QAL Y Lif etime Dir ect cos ts 3%, 3% Radius Healt h, Inc., W alt ham MA Le e t al. [ 16 ] Annals of Phar -maco ther ap y U SA Healt hcar e Discr ete-e vent simulation model QAL Y 10 y ears Dir ect cos ts 3%, 3% Radius Healt h, Inc Mor i e t al. [ 20 ] JBMR PL US U SA Healt hcar e and socie tal Mar ko v micr o-simulation model QAL Y Lif etime Dir
ect and indi
-rect cos ts 3%, 3% JMDC Inc., SMS CO. and L TD BMD bone miner al density , NR no t r epor ted, NSFC N ational N atur al Science F oundation of China, QAL Y q uality -adjus ted lif e-y ear a As s tated b y t he aut hors
performed in five different European countries. Twelve of the 27 studies were published in osteoporosis journals, par-ticularly in Osteoporosis International (n = 5).
Most studies used the healthcare perspective (n = 21), some with a societal perspective (n = 4), while one study used both societal and healthcare perspectives, and another study reported societal, healthcare, and governmental per-spectives. All studies included direct costs and only three also considered indirect costs [15, 18, 20]. However, we found that some studies including both direct and indirect costs were not defined as having a societal perspective, although this was the original information stated by authors reported in Table 1; no adjustment and correction were made for this. Nineteen studies applied a lifetime horizon while others considered truncated time horizons [10–15]. A Markov model was used in 21 studies, consisting of a Markov cohort model (n = 12) or a Markov microsimulation model (n = 9). One study applied a discrete-event simula-tion model [16], another a decision-tree model [13]. Quality-adjusted life-years (QALYs) were used as the outcome in these 23 studies with a model. The remaining four studies used no model [10–12, 17]. One out of the four conducted a cost-minimization analysis [10], in which costs were compared. Another two studies [11, 12] used bone mineral density (BMD) as the final outcome and ICER was calcu-lated based on the differences of costs and BMD of different interventions. Furthermore, the number of fracture events was regarded as the outcome in the fourth study [17], ICER was calculated based on the differences of average annual costs divided by the difference of numbers of hip fractures prevented between bisphosphonates and the combination of calcium and vitamin D. Fourteen studies were funded by pharmaceutical companies or national public funds, while 13 studies did not mention the source of funding or had no funding.
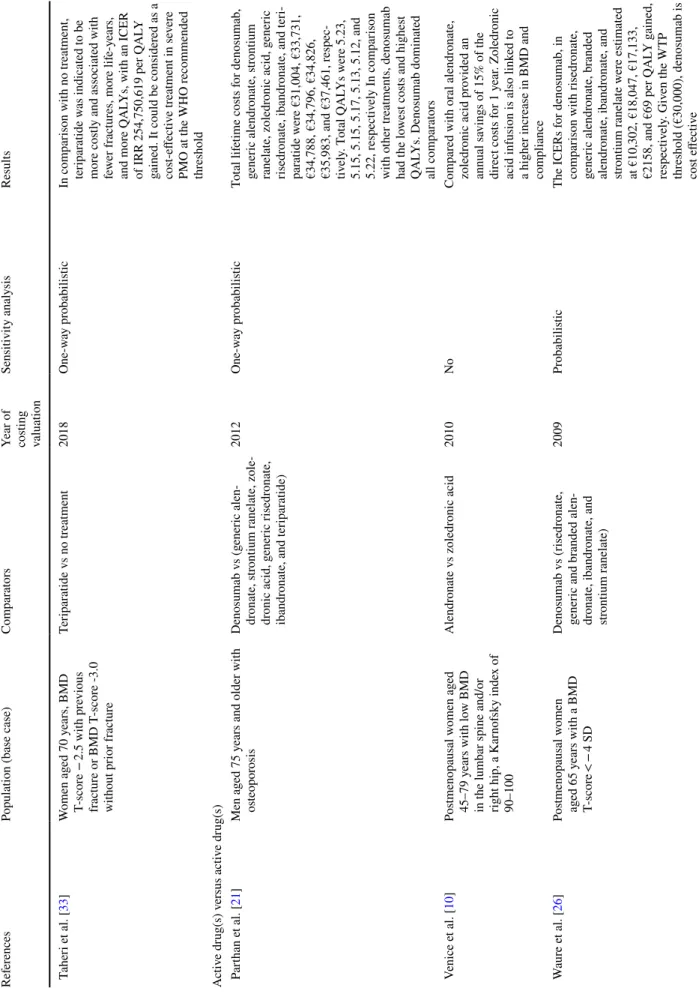
Table 2 presents characteristics of the studied popula-tion, the active intervention and comparator, year of costing valuation, sensitivity analysis, and the main results of the articles. Study populations differed between studies in BMD T-score, mean age, history of fracture, or even tolerance of oral bisphosphonates. Some studies included patients strati-fied for age and two studies included only a male population [21, 22].
Twelve active drugs were assessed in the studies, includ-ing various pharmacological treatments such as bisphospho-nates (alendronate, etidronate, risedronate, ibandronate, and zoledronic acid), raloxifene, strontium ranelate, denosumab, and teriparatide, and including new agents such as abalo-paratide, romosozumab, and gastro-resistant risedronate. Twelve studies included two or more active drugs in their analysis [13, 15–17, 21–28]. Oral bisphosphonates were included in 11 studies [13–15, 18, 21, 22, 24–26, 29, 30] and compared with other active interventions. There were
three studies [16, 20, 28] considering sequential therapies as comparators, while six studies [15, 17, 30–32, 36] made the comparison between active osteoporotic drugs and calcium/ vitamin D3 and ten studies [12, 18, 19, 23–25, 27–29, 33, 34] included no treatment as the comparator. Treatment duration in most studies was similar to randomized controlled trials, indications, or guidelines (e.g., 3 or 5 years for anti-resoptive agents, 12–24 months for anabolic agents). Both a deter-ministic sensitivity analysis (e.g., one-way, multivariate) and a probabilistic sensitivity analysis were conducted in 17 studies. Two studies [24, 26] applied only a probabilistic sensitivity analysis and three studies applied only a one-way sensitivity analysis [13, 32, 34]. Sensitivity analysis was not conducted in five studies [10–12, 17, 35]. We presented the WTP threshold in Table 2 as stated by the authors and no adjustment was made. The WTP threshold was shown to be different even through studies had been conducted in the context of the same country.
Table 3 summarizes the results of the cost-effectiveness analysis between traditional oral bisphosphonates and other active drugs in 2019 US dollars. Annual drug costs for branded oral bisphosphonates had a range from US$123 to US$1874; the cost for generic oral bisphosphonates was much lower, from US$7 to US$458. The annual cost of den-osumab differed steeply between countries, from US$608 to US$1811. Several studies made comparisons between denosumab and oral bisphosphonates.
Specifically, eight studies [14, 18, 21, 22, 24–26, 29] made comparisons between denosumab and oral alen-dronate, of which five studies [18, 22, 25, 26, 29] demon-strated that denosumab was cost effective, and one study [21] showed that denosumab was a dominant option if we applied US$100,000 per QALY gained as the WTP thresh-old. In addition, when compared with risedronate and iban-dronate, denosumab was also shown to be cost effective [25, 26] or dominant [21, 22]. However, two studies [14, 24] showed that denosumab was not cost effective with large ICERs when compared with alendronate; this was caused by minimal incremental QALYs. In addition, comparisons between oral and non-oral bisphosphonates were performed in some studies. Three studies [15, 20, 24] were conducted between zoledronic acid and oral alendronate, with one study indicating that zoledronic acid was dominant [15]; in the other two studies, zoledronic acid was not cost effec-tive or was dominated by alendronate [20, 24]. As a new formulation of bisphosphonates, gastro-resistant risedronate was cost effective in comparison with alendronate and rise-dronate in one study [27]. Furthermore, another study com-pared teriparatide with risedronate, showing that teriparatide was not cost effective. Overall, 67% studies (eight of a total 12 studies) or 82% of comparisons (23 of a total 28 studies) suggested that active interventions (denosumab, zoledronic acid, gastro-resistant risedronate, or teriparatide) were cost
Table 2 R esults of cos t-effectiv eness anal yses of dr ugs f or os teopor osis Ref er ences
Population (base case)
Com
par
at
ors
Year of costing valuation
Sensitivity anal ysis Results A ctiv e dr ug(s) v s no tr eatment/calcium + vit amin D Golmohamdi e t al. [ 12 ] Pos tmenopausal w omen wit h os teopor osis Zoledr onic acid v s placebo 2013 No One per cent incr ease of BMD on femor al nec k, hip tr oc hanter , to
tal hip, and lumbar spine
req
uir
es fur
ther cos
t of US$386,
US$264, US$388, and US$347, respectiv
ely . Zoledr onic acid is a cheaper and be tter appr oac h and can be consider ed as a dominant appr oac h Kw on e t al. [ 32 ] Pos tmenopausal w omen ag ed 55, 60, or 65 y ears wit h BMD T-scor es fr om − 2.0 t o − 2.4 at the f emor al nec k, and wit hout pr evious os teopor otic fr actur es Calcium/ vit amin D v s (r alo x-ifene + calcium/ vit amin D) or (risedr onate + calcium/vit amin D) 2014 One-w ay In com par ison wit h calcium/vit a-min D supplements, dr ug t her ap y (ralo xif ene or risedr onate + cal -cium/vit
amin D) had an ICER
of US$16,472 and US$6741 per QAL
Y g ained f or tr eatment s tar ted at t he ag e of 55 and 60 y ears, respectiv ely . Giv en t he W TP thr
eshold (US$25,700), phar
-maceutical tr eatment w as cos t effectiv e. F or older w omen s tar
t-ing medication at 65 y
ears of ag e, phar maceutical inter vention w as a dominant s trategy It o e t al. [ 36 ] W omen ag ed 85 y ears wit h BMD T-scor e ≤ − 2.0 at t he spine, hip, or r adius who r esided in nursing homes (Zoledr onic acid + calcium/vit a-min D) v s usual car e (calcium/ vit amin D) 2017 One-w ay pr obabilis tic In com par ison wit h usual car e, zoledr
onic acid had an ICER of
US$207,400 per QAL
Y g ained. Giv en t he W TP t hr eshold (US$100,000), zoledr onic acid was no t cos t effectiv e
Table 2 (continued) Ref er ences
Population (base case)
Com
par
at
ors
Year of costing valuation
Sensitivity anal ysis Results Mohd-Tahir e t al. [ 17 ]
Adult patients diagnosed wit
h os teopor osis r elated t o g lucocor -ticoid dr ugs use Or al bisphosphonates (alen -dr onate, r isedr onate or iban -dr onate) v s calcium/vit amin D 2014 No Ov er all, in com par ison wit h cal -cium/vit amin D, t he use of bispho -sphonates could no t be consider ed cos t effectiv e f or tr eatment of all patients wit h GIO. Bisphospho -nates w er e consider ed cos t effec -tiv e if s tar
ted in patients mor
e t han 60 y ears old. Ho we ver , bisphos -phonates w er e no t cos t effectiv e in patients wit h GIOP second -ar y os teopor
osis. The ICERs of
bisphosphonates in patients wit
h pr evious fr actur e or wit h r heu -mat oid ar thr itis w er e es timated at
MYR 108,603 and MYR 25,699 per QAL
Y g ained, r espectiv ely . Giv en t he W TP t hr eshold (MYR 26,317), bisphosphonates w er e cos t effectiv e in patients wit h rheumat oid ar thr itis Cui e t al. [ 34 ] Pos tmenopausal os teopor otic women Zoledr onic acid v s no tr eatment 2019 One-w ay In com par ison wit h no tr eatment, zoledr
onic acid had ICERs
of US$26,637, US$22,129, US$20,338, US$19,285, US$18,181, US$16,680, US$15,047, and US$14,447 per QAL
Y at FRAX t hr eshold 0.02, 0.06, 0.07,0.08, 0.09, 0.1, 0.5, and 1, r espectiv ely . Zoledr onic acid w as cos t effectiv e when the 10-y ear pr obability of ma jor os teopor otic fr actur e based on FRAX w as abo ve 7%
Table 2 (continued) Ref er ences
Population (base case)
Com
par
at
ors
Year of costing valuation
Sensitivity anal ysis Results T aher i e t al. [ 33 ] W omen ag ed 70 y ears, BMD T-scor e − 2.5 wit h pr evious fractur e or BMD T -scor e -3.0 wit hout pr ior fr actur e Ter ipar atide v s no tr eatment 2018 One-w ay pr obabilis tic In com par ison wit h no tr eatment, ter ipar atide w as indicated t o be mor e cos
tly and associated wit
h fe wer fr actur es, mor e lif e-y ears, and mor e QAL Ys, wit h an ICER
of IRR 254,750,619 per QAL
Y
gained. It could be consider
ed as a cos t-effectiv e tr eatment in se ver e PMO at t he WHO r ecommended thr eshold A ctiv e dr ug(s) v ersus activ e dr ug(s) P ar than e t al. [ 21 ] Men ag ed 75 y
ears and older wit
h os teopor osis Denosumab v s (g ener ic alen -dr onate, s trontium r anelate, zole -dr onic acid, g ener ic r isedr onate, ibandr
onate, and ter
ipar atide) 2012 One-w ay pr obabilis tic To tal lif etime cos ts f or denosumab, gener ic alendr onate, s trontium ranelate, zoledr onic acid, g ener ic risedr onate, ibandr
onate, and ter
i-par atide w er e €31,004, €33,731, €34,788, €34,796, €34,826, €35,983, and €37,461, r espec -tiv ely . T ot al QAL Ys w er e 5.23, 5.15, 5.15, 5.17, 5.13, 5.12, and 5.22, r espectiv ely In com par ison wit h o ther tr eatments, denosumab had t he lo wes t cos ts and highes t QAL
Ys. Denosumab dominated
all com par at ors V enice e t al. [ 10 ] Pos tmenopausal w omen ag ed 45–79 y ears wit h lo w BMD in t
he lumbar spine and/or
right hip, a K ar nof sky inde x of 90–100 Alendr onate v s zoledr onic acid 2010 No Com par ed wit h or al alendr onate, zoledr onic acid pr ovided an annual sa vings of 15% of t he dir ect cos ts f or 1 y ear . Zoledr onic
acid infusion is also link
ed t o a higher incr ease in BMD and com pliance W aur e e t al. [ 26 ] Pos tmenopausal w omen ag ed 65 y ears wit h a BMD T-scor e < − 4 SD Denosumab v s (r isedr onate, gener ic and br anded alen -dr onate, ibandr onate, and str ontium r anelate) 2009 Pr obabilis tic The ICERs f or denosumab, in com par ison wit h r isedr onate, gener ic alendr onate, br anded alendr onate, ibandr onate, and str ontium r anelate w er e es timated
at €10,302, €18,047, €17,133, €2158, and €69 per QAL
Y g ained, respectiv ely . Giv en t he W TP thr eshold (€30,000), denosumab is cos t effectiv e
Table 2 (continued) Ref er ences
Population (base case)
Com
par
at
ors
Year of costing valuation
Sensitivity anal ysis Results Darbà e t al. [ 25 ] Pos tmenopausal w omen ag e 65 y ears wit h BMD T-scor e ≤ 2.5 or less Denosumab v s (alendr onate, iban -dr onate, r isedr onate, s trontium ranelate, and no tr eatment) 2013 Pr obabilis tic, multiv ar iate, uni -var iate The ICER f or denosumab com par ed wit h no tr eatment, alendr onate, risedr
onate, and ibandr
onate w
er
e
es
timated at €6823, €16,294,
€4895, and €2205 per QAL
Y gained, r espectiv ely . Giv en the W TP t hr eshold (€20,000), denosumab is cos t effectiv e. Denosumab is a dominant tr eat -ment op tion in com par ison wit h str ontium r anelate Mir aci e t al. [ 11 ] Menopausal or pos tmenopausal women ag ed 50 y ears wit h T-scor e − 1 t o -6, diagnosed f or the firs t time Ibandr onate v s alendr onate NR No The cos t/efficacy r atio (1% c hang e of BMD) w as 13.434 units f or ibandr
onate and 31.677 units f
or
alendr
onate type A1. Ibandr
onate is mor e effectiv e and cos t effectiv e than alendr onate in t he tr eatment of os teopor osis Sil ver man e t al. [ 22 ] Men wit h a mean ag e of 78 y ears wit h BMD T -scor e of − 2.12 and a v er tebr al fr actur e pr ev alence of 23% Denosumab v s (g ener ic alen -dr onate, r isedr onate, iban -dr onate, ter ipar atide, and zoledr onic acid) 2013 One-w ay pr obabilis tic Com par ed wit h g ener ic alendr onate,
denosumab had an ICER of US $16,888 per QAL
Y g ained. Giv en t he W TP t hr eshold (US $100,000), denosumab is cos t effectiv e. Com par ed wit h r ise -dr onate, ibandr onate, ter ipar atide, and zoledr
onic acid, denosumab is
a dominant op tion Chen e t al. [ 31 ] Pos tmenopausal w omen ag ed 65 y ears wit h BMD T-scor e ≤ -2.5 at t he f emor al nec k and wit hout pr evious fr ac -tur es (initial population) Ralo xif ene v s con ventional tr eat -ment (calcit onin or alendr onate or calcium/vit amin D) 2015 One-w ay pr obabilis tic Com par ed wit h con ventional tr eat -ment, tr eatment wit h r alo xif ene
had an ICER of US$36,891 per QAL
Y g ained. Giv en t he W TP thr eshold of US$20,000), r alo x-ifene w as no t cos t effectiv e K ar non e t al. [ 14 ] W omen wit h a mean ag e of 72 y ears (r ang e 60–90 y ears) wit h a mean BMD T -scor e at t he femor al nec k of − 2.15, and wit h 24% of w omen ha ving e xper i-enced a pr evious fr actur e Patented denosumab v s g ener ic alendr onate 2012 De ter minis tic pr obabilis tic Com par ed wit h alendr onate,
denosumab had an ICER of AUD$246,749 per QAL
Y gained. Giv en t he W TP t hr eshold (A UD$100,000), denosumab is no t cos t effectiv e
Table 2 (continued) Ref er ences
Population (base case)
Com
par
at
ors
Year of costing valuation
Sensitivity anal ysis Results Azar e t al. [ 13 ] Pos tmenopausal w omen ag ed ov er 60 y ears wit h BMD T-scor e ≤ 2.5 and wit h at leas t a pr evious spine, wr ist, or hip fractur e caused b y os teopor osis Risedr onate v s (alendr onate and ter ipar atide) 2014 One-w ay Com par ed wit h r isedr onate, alendr
onate and ter
ipar
atide
had ICERs of US$-2178 and US$483,783 per QAL
Y g ained. Giv en t he W TP t hr eshold (US$14,010), alendr onate is
the dominant and cos
t-effectiv e treatment op tion. The tr eatment str ategy of ter ipar atide is mor e expensiv e t han r isedr onate and alendr
onate and is associated wit
h ver y little incr ease in QAL Ys Mor i e t al. [ 18 ] Pos tmenopausal os teopor otic women wit hout pr evious hip or ver tebr al fr actur es at v ar ious ag es of t her ap y initiation (65, 70, 75, and 80 y ears) Alendr onate v s denosumab v s no treatment 2016 One-w ay pr obabilis tic For patients ag ed 75 and 80 y ears, denosumab w as cos t sa ving fr om an y of t he t hr ee perspectiv es, in com par ison wit h alendr onate F or patients ag ed 65 and 70 y ears,
denosumab had an ICER of US$25,700 and US$5000 per QAL
Y g ained, fr om a socie tal perspectiv e, and did no t e xceed a W TP t hr eshold (US$50,000). Ther ef or e, denosumab w as a cos t-effectiv e op tion Mor i e t al. [ 19 ] Community -dw elling non-His -panic white w omen at differ ent star ting ag es (65, 70, 75, and 80 y
ears) and wit
hout pr evious hip, v er tebr al, or wr ist fr actur es Or al bisphosphonate v s no tr eat -ment, combined s trategy (bis -phosphonate + falls pr ev ention ex er cise) and (f alls pr ev ention ex er cise onl y) 2014 One-w ay pr obabilis tic Com par ed wit h an or al bisphospho -nate alone, t he combined s trategy
had ICERs of US$202,020, US$118,460, US$46,870, and US$17,640 per QAL
Y f or patients ag ed 65, 70, 75, and 80 y ears, respectiv ely . Giv en t he W TP thr eshold (US $100,000), t he com -bined s trategy f or patients ag es 75 and 80 y ears w as cos t effectiv e. The combined s trategy pr ovided be tter healt h at lo wer cos t t han t he falls pr ev ention e xer cise alone at ag es 70, 75, and 80 y ears
Table 2 (continued) Ref er ences
Population (base case)
Com
par
at
ors
Year of costing valuation
Sensitivity anal ysis Results Mor iw aki e t al. [ 30 ] W omen of 70 y ears wit h BMD T-scor e of − 2.5 and a pr evious ver tebr al fr actur e Alendr onate + basic treatment (placebo + calcium + vit amin D) vs basic tr eatment ; (zoledr onic acid + basic tr eatment) v s (alen -dr onate + basic treatment) 2016 De ter minis tic pr obabilis tic
For patients 70 y
ears of ag e, zoledr onic acid w as dominated b y alendr onate. Ho we ver , t he incr e-ment al QAL Y is q uite small in extent. Consider ing t he adv ant ag e of annual zoledr onic acid tr eat -ment in com
pliance and persis
-tence, zoledr onic acid ma y be a cos t-effectiv e tr eatment op tion com par ed t o alendr onate O’Hanlon e t al. [ 35 ] W omen of 70 y ears wit h BMD T-scor es < − 2.5 and a pr evious ver tebr al fr actur e Alter nativ e bone-f or ming ag ent pr ofiles v s t he ter ipar atide ref er
ence case; alter
nativ e bone-f or ming ag ent pr ofiles v s (seq uential ter ipar atide + deno -sumab) 2016 No In com par ison wit h ter ipar atide, alter nativ e bone-f or ming ag ent pr ofiles pr oduced a ne t mone tar y
benefit of US$17,000,000 per 10,000 tr
eated patients dur
ing t
he
1.5 y
ears and US$80,000,000 o
ver a lif etime hor izon t hat included 3.5 y ears of maintenance tr eat -ment wit h denosumab Y oshiza wa e t al. [ 29 ] W omen ag ed 75 y ears wit h BMD T-scor e − 2.87 and wit h a pr evi -ous v er tebr al body fr actur e Denosumab v s alendr onate; alen -dr onate v s no tr eatment 2016 De ter minis tic pr obabilis tic Com par ed wit h alendr onate, deno
-sumab had an ICER of US$40,241 per QAL
Y g ained. Assuming a W TP t hr eshold (US$50,000), denosumab w as cos t effectiv e Chokc haler m wong e t al. [ 23 ] Pos tmenopausal w omen ag ed ≥ 50 y ears wit h os teo -por
osis and wit
hout pr evious fractur es (Or al bisphosphonates, r alo xif ene, str ontium r
anelate, and deno
-sumab) v s no tr eatment 2015 One-w ay pr obabilis tic In com par ison wit h no tr eatment, none of t he alter nativ e dr ugs w er e cos t effectiv e at baseline case. F or women fr om t he ag e of 65 y ears, wit h a BMD T -scor e ≤ -2.5, or al bisphosphonates w er e t he onl y dr ugs cos t effectiv e (t he ICER was THB130,049), f ollo wed b y denosumab and r alo xif ene, r espec -tiv ely . S trontium r anelate w as dominated b y no tr eatment
Table 2 (continued) Ref er ences
Population (base case)
Com
par
at
ors
Year of costing valuation
Sensitivity anal ysis Results Co yle e t al. [ 24 ] W omen ag ed 70–74 y ears wit h os teopor
osis and wit
hout pr evi -ous fr actur es who ar e able t o toler ate or al bisphosphonates Alendr onate v s e tidr onate v s risedr onate v s zoledr onic acid v s denosumab v s no tr eatment 2017 Pr obabilis tic
For patients who can t
oler ate or al bisphosphonates, in com par ison wit h no tr eatment, alendr onate, risedr onate, zoledr onic acid,
and denosumab had ICERs of C
AN$3751, C AN$85,557, CAN$83,503, and C AN$238,523 per QAL Y g ained, r espectiv ely . Giv en t he W TP t hr eshold (C AN$50,000), alendr onate w as the onl y cos t-effectiv e dr ug. In com par ison wit h alendr onate, risedr onate and e tidr onate w er e
dominated, and zoledr
onic acid and denosumab w er e associated wit h a high ICER. F or patients who ar e unable t o t oler ate or al
bisphosphonates, dependent on age and fr
actur e his tor y, com par ed wit h no tr eatment, t he ICER f or zoledr
onic acid had a r
ang e fr om CAN$17,770 t o C AN$94,365 per QAL Y. Denosumab w as dominated b y zoledr onate or had an ICER g reater t han C AN$3.0 million Hiligsmann e t al. [ 27 ] Pos tmenopausal w omen ag ed 60–80 y ears wit h BMD T-scor e ≤ -2.5 and/or pr ev alent ver tebr al fr actur es Gas tro-r esis tant r isedr onate v s (g ener ic r isedr onate, alendr onate and no tr eatment) 2017 One-w ay pr obabilis tic The ICER f or GR r isedr onate, com -par ed wit h alendr onate, g ener ic risedr onate and no tr eatment, rang ed fr om €2037 t o €21,875 per QAL Y g ained. Giv en t he W TP t hr eshold (€60,000), GR risedr onate w as cos t effectiv e In women ag ed 75 y
ears and older
, GR r isedr onate w as e ven sho wn t o be dominant
Table 2 (continued) Ref er ences
Population (base case)
Com
par
at
ors
Year of costing valuation
Sensitivity anal ysis Results Li e t al. [ 15 ] W omen ag ed o ver 60 y ears wit h BMD T -scor e ≤ 2.5 in t he lum -bar spine or f emor al nec k and wit hout pr evious fr actur es (Alendr onate, zoledr onic acid, ralo xif
ene and ter
ipar atide) v s calcium/vit amin D; (alendr onate, ralo xif
ene and ter
ipar atide) v s zoledr onic acid 2018 Univ ar iate pr obabilis tic Com par ed wit h calcium/vit a-min D, zoledr
onic acid had an
ICER of US$7864 per QAL
Y gained. Giv en t he W TP t hr eshold (US$28,624), zoledr onic acid was cos t-effectiv e. The ICER of ter ipar atide v ersus zoledr onic acid w as US$470,797 per QAL Y g ained, whic h e xceeded the t hr eshold. Alendr onate and ralo xif ene w er e dominated b y zoledr onic acid Seq uential t her apies Hiligsmann e t al. [ 28 ] W omen ag ed 50–80 y ears wit h a BMD T -scor e ≤ -3.5 and wit hout fractur e his tor y or wit h a BMD T-scor e − 2.5 t o − 3.5 and a his -tor y of at leas t one os teopor otic fractur e (Seq uential abalopar atide + alen -dr onate) v s (seq uential ter i-par atide + alendr onate) and no treatment 2017 One-w ay pr obabilis tic In com par ison wit h seq uential TPTD/ALN t her ap y, seq uential ABL/ALN t her ap y w as dominant
in all simulated populations. Com
-par ed wit h no tr eatment, in w omen wit h BMD T -scor e ≤ 3.5 (ag e o ver 70 y ears), t he seq uential ABL/ ALN t her ap y w as cos t sa ving; and in w omen wit h a BMD T -scor e -2.5 t o -3.5 and his tor y of one os teopor otic fr actur e, t he ICER was es timated at US$125,493,
US$91,394, US$81,865, US$51,906, US$38,763, US$31,390, and US$28,086 f
or patients ag ed 50 y ears, 55 y ears, 60 y ears, 65 y ears, 70 y ears, 75 y
ears, and 80 y
ears, r espec -tiv ely . Giv en t he W TP t hr eshold (US$100,000), seq uential ABL/ ALN t her ap y w as cos t effectiv e f or patients ag ed o ver 55 y ears
Table 2 (continued) Ref er ences
Population (base case)
Com
par
at
ors
Year of costing valuation
Sensitivity anal ysis Results Le e t al. [ 16 ] Pos tmenopausal w omen ag ed 68.8 y ears wit h os teopor osis (Seq uential abalopar atide + alen -dr onate) v s (seq uential ter ipar atide + alendr onate) and (placebo + alendr onate) 2017 One-w ay pr obabilis tic Com par ed wit h TPTD/ALN o ver a 10-y
ear time hor
izon, ABL/ALN
was dominant. In com
par ison wit h PB O/ALN , ABL/ALN had an
ICER of US$333,266 per QAL
Y gained. In high-r isk w omen, ABL/ ALN w as also cos t effectiv e in com par ison wit h TPTD/ALN , and
had an ICER of US$188,891 per QAL
Y g ained r elativ e t o PB O/ ALN Mor i e t al. [ 20 ] Community -dw elling white os teopor otic w omen ag ed 65, 70, 75, and 80 y ears wit h pr evious ver tebr al fr actur e (Seq uential ter ipar atide + alen -dr onate) v s alendr onate alone 2018 One-w ay pr obabilis tic Com par ed wit h alendr onate alone from t he socie tal perspectiv e, seq uential ter ipar atide/alendr onate
had an ICER of US$434,400, US$330,000, US$280,100, and US$290,800 per QAL
Y f or women ag ed 65, 70, 75, and 80 y ears, r espectiv ely . F rom a healt hcar e perspectiv e, t he ICERs wer e US$441,700, US$336,700,
US$288,200, and US$299,100 per QAL
Y, r espectiv ely , Giv en t he W TP t hr eshold (US$150,000), seq uential ter ipar atide/alendr onate was no t cos t effectiv e unless t he cos ts of g ener ic/biosimilar ter i-par atide w er e hea vil y discounted wit h r espect t o t he cur rent br and cos t ABL abalopar atide, ALN alendr onate, AU D A us tralian Dollar , BMD bone miner al density , GIOP g lucocor ticoid-induced os teopor osis, GR g as tro-r esis tant, ICER incr ement al cos t-effectiv eness ratio, IRR Ir anian Rial, NR no t r epor ted, PBO placebo, PMO pos tmenopausal os teopor osis, PTH par at hyr oid hor mone, QAL Y q uality -adjus ted lif e-y ear , MYR Mala ysian Ringgit, THB Thai Baht, TPTD ter ipar atide, W TP willingness t o pa y, WHO W or ld Healt h Or ganization
effective when compared with traditional oral bisphospho-nates. Additionally, comparisons between active interven-tions were also made in some studies; two studies showed that denosumab was cost effective [26] or dominant [21] when compared with strontium ranelate. Zoledronate acid and teriparatide were dominated by denosumab in another two studies [21, 22].
Table 4 presents three studies [16, 20, 28] that estimated the cost effectiveness of sequential therapies from the US perspective. Hiligsmann et al. [28] analyzed populations with different BMD T-scores at baseline, and the study of Mori et al. [20] assessed women at different ages and from both healthcare and societal perspectives. Hiligsmann et al. [28] and Le et al. [16] assessed sequential therapies start-ing with 1.5 years of abaloparatide or teriparatide, followed by 5 years of alendronate as the treatment duration. In the study of Mori et al. [20], 2 years of initial treatment with
teriparatide was followed by 10 years of alendronate. The monthly drug costs for abaloparatide were similar between studies, at approximately US$1700; the cost of teriparatide was from US$1711 to US$3722 per month. Abaloparatide followed by alendronate was shown to be dominant when compared with teriparatide followed by alendronate in two studies [16, 28]. In addition, when compared with a pla-cebo or no treatment, Hiligsmann et al. [28] showed that abaloparatide followed by alendronate was cost saving or cost effective in different populations. In the study of Le et al. abaloparatide or teriparatide followed by alendronate was not cost effective when compared with a placebo fol-lowed by alendronate [16]. Furthermore, Mori et al. [20] compared sequential therapy (teriparatide followed by alen-dronate) with alendronate alone at different ages and eco-nomic perspectives, indicating that sequential therapy was not cost effective. The high drug costs of abaloparatide and
Table 3 Cost-effective analyses between oral bisphosphonates and other active drugs for osteoporosis
GP governmental perspective, GR gastro-resistant, HP healthcare perspective, ICER incremental cost-effectiveness ratio, SP societal perspective
References Country Intervention and comparator Treatment
duration (years)
Annual drug costs
(intervention/comparator) ICER
Coyle et al. [24] Canada Denosumab vs alendronate 2 US$663/US$123 US$2,376,812
Darbà et al. [25] Spain Denosumab vs alendronate 5 US$608/US$237 US$23,746
Waure et al. [26] Italy Denosumab vs generic alendronate 4 US$842/US$458 US$29,980
Denosumab vs branded alendronate 4 US$842/US$502–528 US$28,462
Karnon et al. [14] Australia Patented denosumab vs generic alendronate 5 US$624/US$230 US$284,397
Mori et al. [18] Japan Denosumab vs alendronate (SP, 65 years) 5 US$799/US$246 US$27,375
Denosumab vs alendronate (SP, 70 years) US$5326
Denosumab vs alendronate (HP, 65 years) US$32,061
Denosumab vs alendronate (HP, 70 years) US$7137
Denosumab vs alendronate (GP, 65 years) US$28,546
Denosumab vs alendronate (GP, 70 years) US$6178
Parthan et al. [21] Sweden Denosumab vs generic alendronate 5 US$733/US$49 Dominant
Silverman et al. [22] USA Denosumab vs generic alendronate 5 US$1811/US$33 US$18,532
Yoshizawa et al. [29] Japan Denosumab vs alendronate 5 US$743/US$289 US$40,969
Darbà et al. [25] Spain Denosumab vs risedronate 5 US$608/US$414 US$7134
Waure et al. [26] Italy Denosumab vs risedronate 4 US$842/US$455 US$17,114
Parthan et al. [21] Sweden Denosumab vs generic risedronate 5 US$733/US$64 Dominant
Silverman et al. [22] USA Denosumab vs risedronate 5 US$1811/US$1874 Dominant
Darbà et al. [25] Spain Denosumab vs ibandronate 5 US$608/US$227 US$3213
Waure et al. [26] Italy Denosumab vs ibandronate 4 US$842/US$819 US$3585
Parthan et al. [21] Sweden Denosumab vs ibandronate 5 US$733/US$544 Dominant
Silverman et al. [22] USA Denosumab vs ibandronate 5 US$1811/US$1462 Dominant
Coyle et al. [24] Canada Zoledronic acid vs alendronate 2 US$298/US$123 US$535,359
Li et al. [15] China Zoledronic acid vs alendronate 3/5 US$536/US$555 Dominant
Moriwaki et al. [30] Japan Zoledronic acid vs alendronate 3 US$350/US$273 Dominant
Hiligsmann et al. [27] France GR risedronate vs alendronate 3 US$58/US$55 US$2401
Azar et al. [13] Iran Teriparatide vs generic risedronate 2 US$1757/US$7 US$522,424
teriparatide largely affected ICERs when compared with no treatment, a placebo, and with alendronate alone.
3.3 Critical Appraisal
Table 5 presents the results of the quality assessment of the design and conduct of economic evaluations in osteoporo-sis using the ESCEO-IOF guideline. Substantial differences were observed between studies with an average score of 17 out of 25 (range 2–25). Although some studies followed sev-eral recommendations of the guideline, room for improve-ment was observed for most studies.
Figure 2 shows the percentage of studies that fully, partially, or did not report the individual recommenda-tions in the guideline. The most frequently unreported recommendations were ‘an additional effect after multiple fractures’ (i.e., an additional effect on costs and/or util-ity should be modeled), ‘adverse events’ (i.e., important
side effects that have an impact on costs and/or utility need to be included), and ‘proportion attributed to the fracture’ (i.e., a proportion of excess mortality attributed to the fracture should be included). In addition, some rec-ommendations such as ‘avoid hierarchy of fractures and restrictions after fracture events’ (e.g., the absence of a non-hip fracture after a previous hip fracture or a limit to the number of fracture events) and ‘multiple scenarios’ (i.e., include age range and fracture risk levels) were fre-quently partially reported.
The results of reporting quality assessment are presented in Table 6; most recommendations were well reported with an average score of 6.8 out of 9 (range 0.5–9). The qual-ity of reporting was suboptimal for ‘treatment side effects’ (i.e., describing the approaches and data sources used for costs and utilities effects of adverse events). Furthermore, ‘medication adherence’ (i.e., describing approaches and data sources used for modeling medication adherence) was
Table 4 Cost-effective analyses of sequential therapy
ABL abaloparatide, ALN alendronate, BMD bone mineral density, HP healthcare perspective, ICER incremental cost-effectiveness ratio, SP soci-etal perspective, TPTD teriparatide, y years
References Country Population Comparator (treatment duration) Monthly drug costs ICER
Hiligsmann et al. [28] USA BMD T-score ≤ − 3.5, age 70 or
− 3.5 ≤ BMD T-score ≤ − 2.5 and history of one osteoporotic frac-ture, age 70 y
Sequential ABL(1.5y)/ALN(5y) vs
sequential TPTD(1.5)/ALN(5y) ABL US$1695TPTD US$3387
ALN US$10
Dominant
Le et al. [16] USA Aged ≥ 65 y with a prior vertebral
fracture Sequential ABL(1.5y)/ALN(5y) vs sequential TPTD(1.5)/ALN(5y) ABL US$1795TPTD US$3722
ALN US$10
Dominant
Hiligsmann et al. [28] USA BMD T-score ≤ − 3.5, age 70 y Sequential ABL(1.5y)/ALN(5y) vs
no treatment ABL US$1695ALN US$10 Cost saving
− 3.5 ≤ BMD T-score ≤ − 2.5 and history of one osteoporotic frac-ture, age 70 y
US$40,428
Le et al. [16] USA Aged ≥ 65 y with a prior vertebral
fracture Sequential ABL(1.5y)/ALN(5y) vs PBO/ALN(5y) ABL US$1795ALN US$10 US$347,577
Sequential TPTD(1.5y)/ALN(5y) vs
PBO/ALN(5y) TPTD US$3722 US$991,854
Mori et al. [20] USA Age 65 y (SP) Sequential TPTD(2y)/ALN(10y) vs
ALN(10y) TPTD US$1711ALN US$17 US$442,263
Age 70 y (SP) Sequential TPTD(2y)/ALN(10y) vs
ALN(10y) US$335,973
Age 75 y (SP) Sequential TPTD(2y)/ALN(10y) vs
ALN(10y) US$285,170
Age 80 y (SP) Sequential TPTD(2y)/ALN(10y) vs
ALN(10y) US$296,063
Age 65 y (HP) Sequential TPTD(2y)/ALN(10y) vs
ALN(10y) US$449,695
Age 70 y (HP) Sequential TPTD(2y)/ALN(10y) vs
ALN(10y) US$342,794
Age 75 y (HP) Sequential TPTD(2y)/ALN(10y) vs
ALN(10y) US$293,416
Age 80 y (HP) Sequential TPTD(2y)/ALN(10y) vs
Table 5 Quality appr aisal of cos t-effectiv eness anal yses of dr ugs f or os teopor osis using t he ESCEO-IOF guideline Item Recommendation Ar ticle r ef er ences [ 12 ] [ 32 ] [ 36 ] [ 17 ] [ 34 ] [ 33 ] [ 21 ] [ 10 ] [ 26 ] [ 25 ] [ 11 ] [ 22 ] [ 31 ] Type of economic e valuation Cos t-utility anal
ysis using QAL
Y as t he outcome No Ye s Ye s No Ye s Ye s Ye s No Ye s Ye s No Ye s Ye s Me thod f or t he conduct of an economic ev aluation A model-based economic e valuation No Ye s Ye s No Ye s Ye s Ye s No Ye s Ye s No Ye s Ye s Modeling tec hniq ue Lif etime hor izon No Ye s Ye s No Ye s Ye s Ye s No Ye s Ye s No Ye s Ye s Mar ko v model is appr opr iate (6-mont h/1-y ear cy cle lengt h) No Ye s Ye s No Ye s Ye s Ye s No Ye s Ye s No Ye s Ye s Av oid hier ar ch y of fr actur es and r es trictions af ter fr actur e e vents NA Pa rt Pa rt No Ye s Ye s Pa rt NA Pa rt No No Pa rt Ye s Hip, clinical v er tebr
al, and non-v
er tebr al non-hip fr actur e Ye s Ye s Ye s Ye s Ye s Pa rt Ye s Pa rt Ye s Ye s No Ye s Ye s Base-case anal
ysis and population
Multiple scenar ios: ag e r ang e, BMD, and fr actur e r isk scenar ios No Ye s Pa rt Pa rt Pa rt No No No No Ye s No No Pa rt The FRAX ® or GAR VAN
® tools can be used t
o model fr actur e Incr eased r isk af ter fr actur e e vents wit hin t he model No Ye s Ye s No Ye s No No No No Ye s No No Ye s Mor tality Ex cess mor tality af ter hip fr actur es and clinical v er tebr al fr actur es No Ye s Ye s No No Pa rt Ye s No No Ye s No Ye s Ye s Pr opor tion attr ibuted t o t he fr actur e (e.g., 25–30%) mor tality t hat is attr ibut able t o t he fr actur e ev ent No No No No No Ye s Ye s No No No No No No Fr actur e cos ts and utility Socie
tal and/or healt
hcar e pa yer perspectiv e Ye s Ye s Ye s Ye s Ye s Ye s Ye s Ye s Ye s Ye s No Ye s Ye s A cute fr actur e cos ts Ye s Ye s Ye s Ye s Ye s Ye s Ye s Ye s Ye s Ye s No Ye s Ye s Long-ter m cos ts af ter hip fr actur e (attr ibut able t o t he fr actur e) No Ye s Ye s No Ye s Ye s Ye s No No Ye s No Ye s Ye s Firs t y
ear and subseq
uent y ears ’ effects of fr actur es on disutility No Pa rt Ye s No Ye s Pa rt Ye s No Ye s Ye s No Ye s Ye s National ICUR OS dat a if a vailable
An additional effect (on cos
ts and/or utility) af ter multiple fr actur es No No No No No No No No No Ye s No No No Tr eatment c har acter istics Tr eatment dur ation similar t o guidelines or R CT s Ye s Ye s Ye s No Ye s NA Ye s No Ye s Ye s No Ye s Ye s Com par at ors: no tr eatment and r ele vant activ e os teopor otic ag ent(s) Ye s No Ye s No Ye s No No No No Ye s No No No Seq uential t her ap y ma y be consider ed as inter vention/com par at ors Efficacy dat a fr om R CT s, (ne tw or k) me ta-anal ysis No Ye s Ye s No Ye s Ye s Ye s No Ye s Ye s No Ye s Ye s In t he absence of hip/wr
ist specific efficacy dat
a, use of non-v er tebr al or clinical fr actur e efficacy dat a Tr eatment effects af
ter discontinuation depending on tr
eatment No Ye s Ye s No Ye s Ye s Ye s No Ye s Ye s No Ye s Ye s Medication adher
ence as base case or sensitivity
No Ye s No No Ye s No No No No No No No Ye s Dr ug cos ts and adminis tration/monit or ing cos ts Ye s Ye s Ye s Ye s Ye s Ye s Ye s Ye s Ye s Ye s Ye s Ye s Ye s Adv erse e vents No Ye s Ye s No No No No Ye s Ye s No No No No Sensitivity anal yses One-w ay sensitivity anal yses No Ye s Ye s No Ye s Ye s Ye s No No Ye s No Ye s Ye s Pr obabilis
tic sensitivity anal
yses No No Ye s No No Ye s Ye s No Ye s Ye s No Ye s Ye s Outcomes Pr esent ation of disagg reg
ated outcomes, incr
ement al cos ts, and outcomes f or eac h inter ven
-tion and incr
ement al cos t-effectiv eness r atios Ye s Ye s Ye s Ye s Ye s Ye s Ye s No Ye s Ye s Ye s Ye s Ye s Scor ing 7 20 21 5.5 19.5 16.5 18.5 4.5 15.5 21 2 17.5 20.5 Item Recommendation Ar ticle r ef er ences [ 14 ] [ 13 ] [ 18 ] [ 19 ] [ 30 ] [ 35 ] [ 29 ] [ 23 ] [ 24 ] [ 27 ] [ 15 ] [ 28 ] [ 16 ] [ 20 ] Type of economic e valuation Cos t-utility anal
ysis using QAL
Y as outcome Ye s Ye s Ye s Ye s Ye s Ye s Ye s Ye s Ye s Ye s Ye s Ye s Ye s Ye s Me thod f or t he conduct of economic ev aluation A model-based economic e valuation Ye s Ye s Ye s Ye s Ye s Ye s Ye s Ye s Ye s Ye s Ye s Ye s Ye s Ye s
Table 5 (continued) Item Recommendation Ar ticle r ef er ences [ 14 ] [ 13 ] [ 18 ] [ 19 ] [ 30 ] [ 35 ] [ 29 ] [ 23 ] [ 24 ] [ 27 ] [ 15 ] [ 28 ] [ 16 ] [ 20 ] Modeling tec hniq ue Lif etime hor izon No No Ye s Ye s Ye s Ye s Ye s Ye s Ye s Ye s No Ye s Ye s Ye s Mar ko v model is appr opr iate (6-mont h/1-y ear cy cle lengt h) Ye s No Ye s Ye s Ye s Ye s Ye s Ye s Ye s Ye s Ye s Ye s NA Ye s Av oid hier ar ch y of fr actur es and r es trictions af ter fr actur e e vents Ye s No Pa rt Pa rt Ye s Pa rt Pa rt Pa rt Pa rt Ye s Pa rt Ye s Pa rt Pa rt Hip, clinical v er tebr
al, and non-v
er tebr al non-hip fr actur e Ye s Ye s Pa rt Ye s Ye s Ye s Pa rt Ye s Ye s Ye s Pa rt Ye s Ye s Ye s Base-case anal
ysis and population
Multiple scenar ios: ag e r ang e, BMD, and fr actur e r isk scenar ios Pa rt No Pa rt Pa rt Ye s No Ye s Ye s Ye s Ye s No Ye s Pa rt Pa rt The FRAX ® or GAR VAN
® tools can be used t
o model fr actur e Incr eased r isk af ter fr actur e e vents wit hin t he model Ye s No Ye s Ye s Ye s No Ye s No Ye s Ye s Ye s Ye s Ye s Ye s Mor tality Ex cess mor tality af ter hip fr actur es and clinical v er tebr al fr actur es Pa rt No Pa rt Pa rt Pa rt Ye s Pa rt No Ye s Ye s Ye s Ye s Pa rt Pa rt Pr opor tion attr ibuted t o t he fr actur e (e.g., 25–30%) mor tality t hat is attr ibut able t o t he fractur e e vent No No Ye s Ye s No Ye s No No No Ye s No Ye s No Ye s Fr actur e cos ts and utility Socie
tal and/or healt
hcar e pa yer perspectiv e Ye s Ye s Ye s Ye s Ye s Ye s Ye s Ye s Ye s Ye s Ye s Ye s Ye s Ye s A cute fr actur e cos ts Ye s Ye s Ye s Ye s Ye s Ye s Ye s Ye s Ye s Ye s Ye s Ye s Ye s Ye s Long-ter m cos ts af ter hip fr actur e (attr ibut able t o t he fr actur e) Ye s No Ye s Ye s Ye s Ye s Ye s Ye s Ye s Ye s Ye s Ye s Ye s Ye s Firs t y
ear and subseq
uent y ears ’ effects of fr actur es on disutility Ye s Ye s Ye s Ye s Ye s Pa rt Ye s Ye s Pa rt Ye s Ye s Ye s Ye s Pa rt National ICUR OS dat a if a vailable
An additional effect (on cos
ts and/or utility) af ter multiple fr actur es Ye s No No No No No No Ye s No Ye s No Ye s No No Tr eatment c har acter istics Tr eatment dur ation similar t o guidelines or R CT s Ye s Ye s Ye s Ye s Ye s Ye s Ye s Ye s Ye s Ye s Ye s Ye s Ye s No Com par at ors: no tr eatment and r ele vant activ e os teopor otic ag ent(s) No No Ye s Ye s No No Ye s Ye s Ye s Ye s No Ye s Ye s Ye s Seq uential t her ap y ma y be consider ed as inter vention/com par at ors Efficacy dat a fr om R CT s, (ne tw or k) me ta-anal ysis Ye s Ye s Ye s Ye s Ye s Ye s Ye s Ye s Ye s Ye s Ye s Ye s Ye s Ye s In t he absence of hip/wr
ist specific efficacy dat
a, use of non-v er tebr al or clinical fractur e efficacy dat a Tr eatment effects af
ter discontinuation depending on tr
eatment Ye s No Ye s Ye s Ye s Ye s Ye s No No Ye s Pa rt Ye s Ye s Ye s Medication adher
ence as base case or sensitivity
Ye s No Ye s Ye s Ye s No Ye s No No Ye s No Ye s Ye s Ye s Dr ug cos ts and adminis tration/monit or ing cos ts Ye s Ye s Ye s Ye s Ye s Pa rt Ye s Ye s Ye s Ye s Ye s Ye s Pa rt Ye s Adv erse e vents No No No No No No No Ye s No No No Ye s Ye s No Sensitivity anal yses One-w ay sensitivity anal yses Ye s Ye s Ye s Ye s Ye s No Ye s Ye s No Ye s Ye s Ye s Ye s Ye s Pr obabilis
tic sensitivity anal
yses Ye s No Ye s Ye s Ye s No Ye s Ye s Ye s Ye s Ye s Ye s Ye s Ye s Outcomes Pr esent ation of disagg reg
ated outcomes, incr
ement al cos ts, and outcomes f or eac h inter
vention and incr
ement al cos t-effectiv eness r atios Ye s Ye s Ye s Ye s Ye s Ye s Ye s Ye s Ye s Ye s Ye s Ye s Ye s Ye s Scor ing 20 11 21 21.5 20.5 15.5 20.5 19.5 18 24 16.5 25 20 20 Scor
ing: ‘use ICUR
OS dat a’, ‘use FRAX ® or GAR VAN ® tools ’, ‘consider seq uential t her ap y as inter vention ’, and ‘in t he absence of hip/wr
ist specific efficacy dat
a, use of non-v er tebr al or clini -cal fr actur e efficacy dat a as r eplacement ’ w as no t included in t he scor ing sy stem BMD bone miner al density , NA no t applicable, QAL Y q uality -adjus ted lif e-y ear , R C Ts randomized contr olled tr ials
poorly reported in some articles [10–13, 15, 17, 23, 26, 33], as well as ‘treatment effect after discontinuation’ in six arti-cles (i.e., these studies did not assume a linear decrease of the effect after discontinuation for a period similar to the duration of treatment) [10–13, 23, 24].
3.4 Key Drivers of Cost Effectiveness
Several drivers of cost effectiveness were identified, includ-ing baseline fracture risk, drug effect on the risk of fractures, drug cost, and medication adherence/persistence.
3.4.1 Baseline Fracture Risk
Most studies indicated that the increase of baseline fracture risk and the age of patients were associated with favora-ble results of cost-effectiveness analyses of osteoporotic drugs. For instance, Moriwaki et al. [30] indicated that the incremental costs and incremental QALYs of zoledronic acid compared with alendronate tended to be small, with an increase of T-scores. Moreover, Chokchalermwong et al. [23] reported that, compared to no treatment, the ICER of bisphosphonates was 130,049 THB per QALY when starting the drug from the age of 65 years, with a BMD T-score ≤ − 2.5. However, denosumab was cost effective from the age of 80 years and over.
3.4.2 Drug Effect on the Risk of Fractures
Twelve studies [15, 18, 20–23, 25, 29–32, 36] reported that the cost effectiveness result of osteoporotic drugs is most sensitive to changes in the effect of osteoporotic drugs on the risk of fractures. Silverman et al. [22] indicated that when the relative risk of hip fracture with denosumab is lowered from 0.38 (baseline) to 0.18, denosumab still dominates the generic alendronate. However, when this relative risk is increased to 0.78, denosumab is no longer a cost-effective option. This finding is similar to the study of Parthan et al. [21] and Yoshizawa et al. [29]. In addition, Moriwaki et al. [30] reported that the relative risk of hip fracture with zole-dronic acid had a relatively strong effect on the estimated incremental net monetary benefit; compared to alendronate, zoledronic acid could be a cost-effective option if the rela-tive risk was equal to 0.34 (lower limit).
3.4.3 Drug Cost
Variation in drug costs could lead to different cost-effec-tiveness results of anti-osteoporosis drugs. The strong effect of drug cost was reported in several studies [13, 14, 20, 23, 27–30, 33, 34]. Mori et al. [20] compared sequen-tial therapy (teriparatide followed by alendronate) to alen-dronate alone and reported that results were most sensitive
to the changes in the estimated cost of teriparatide. If the cost of a generic/biosimilar was estimated to be 15% of the brand (i.e., 85% less), the annual cost of teriparatide would be $6490 for a 65-year-old cohort; or if the cost of a generic/biosimilar was estimated to be 35% of the brand (i.e., 65% less), the annual cost of teriparatide would be $11,461 for a 75-year-old cohort; the ICERs of sequential teriparatide/alendronate were below the WTP threshold of $150,000/QALY. Moriwaki et al. [30] also reported that if the cost of zoledronic acid was lowered by 30%, zoledronic acid could be a cost-effective option compared with alendronate. Additionally, Karnon et al. [14] indi-cated that there is a near-zero probability that denosumab is cost effective at a threshold of $100,000/QALY com-pared with alendronate at the current price; however, if the price of denosumab was reduced by 50%, the incremental cost per QALY gained falls to $50,068.
3.4.4 Medication Adherence/Persistence
Anti-osteoporosis medications have shown to be effective in reducing fracture risk; however, as a chronic disease, non-adherence to pharmacological treatment in osteoporosis is a well-recognized problem, which would result not only in deteriorating clinical outcomes, but also in decreased cost effectiveness of pharmacotherapy. Several studies [18, 20, 27, 29, 31, 34] reported that the persistence and adherence rates of osteoporosis medications have marked effects on the cost-effectiveness ratios. For instance, Mori et al. [18] indicated that denosumab was cost effective or even cost saving in comparison with weekly oral alendronate, mainly driven by the higher persistence rate of denosumab leading to higher efficacy. In addition, Hiligsmann et al. [27] also reported that the ICERs of gastro-resistant risedronate were markedly affected by the incremental difference in persis-tence between gastro-resistant risedronate and the active comparator treatment. Moreover, the study of Chen et al. [31] demonstrated that medication persistence and adher-ence had a great impact on clinical and cost effectiveness, high raloxifene persistence and adherence improved clini-cal effectiveness, but the costs were also higher. Raloxifene treatment became cost effective compared with a conven-tional treatment strategy if raloxifene persistence and adher-ence decreased by 30–50%.
4 Discussion
This updated review identified 27 economic evaluations of drugs for osteoporosis published between July 2013 and 2019. Twelve active drugs were assessed in the stud-ies, including bisphosphonates (alendronate, etidronate,