HAL Id: emse-03128237
https://hal-emse.ccsd.cnrs.fr/emse-03128237
Submitted on 2 Feb 2021
HAL is a multi-disciplinary open access archive for the deposit and dissemination of sci-entific research documents, whether they are pub-lished or not. The documents may come from teaching and research institutions in France or abroad, or from public or private research centers.
L’archive ouverte pluridisciplinaire HAL, est destinée au dépôt et à la diffusion de documents scientifiques de niveau recherche, publiés ou non, émanant des établissements d’enseignement et de recherche français ou étrangers, des laboratoires publics ou privés.
IMPROVE PATIENT PATHWAYS WITHIN A
HEALTHCARE NETWORK USING PROCESS
MINING AND DISCRETE-EVENT SIMULATION
Thomas Franck, Paolo Bercelli, Saber Aloui, Vincent Augusto
To cite this version:
Thomas Franck, Paolo Bercelli, Saber Aloui, Vincent Augusto. A GENERIC FRAMEWORK TO ANALYZE AND IMPROVE PATIENT PATHWAYS WITHIN A HEALTHCARE NETWORK US-ING PROCESS MINUS-ING AND DISCRETE-EVENT SIMULATION. Winter Simulation Conference, Dec 2020, Orlando, United States. �emse-03128237�
K.-H. Bae, B. Feng, S. Kim, S. Lazarova-Molnar, Z. Zheng, T. Roeder, and R. Thiesing, eds.
A GENERIC FRAMEWORK TO ANALYZE AND IMPROVE PATIENT PATHWAYS WITHIN A HEALTHCARE NETWORK USING PROCESS MINING AND DISCRETE-EVENT SIMULATION
Thomas Franck Paolo Bercelli
Saber Aloui
Department of Information Systems Groupe Hospitalier Bretagne Sud
5 avenue de Coiseul 56322 Lorient FRANCE
Vincent Augusto
Mines Saint-Etienne CNRS, UMR 6158 LIMOS,
Centre for Biomedical and Healhcare Engineering F - 42023 Saint-Etienne FRANCE
ABSTRACT
Congestion in the Emergency Department (ED) is one of the most important issues in healthcare systems. The lack of downstream beds can deteriorate the quality of care for patients who need hospitalization after an ED visit. We propose a generic simulation model in order to analyze patient pathways from the ED to hospital discharge. The model is adaptable for all pathologies and can include several hospitals within a healthcare network. A pathway analysis using Process Mining is done in order to identify relevant pathways. Then we propose several designs of experiments in order to test medical unit capacity variations taking into account real data and practitioners expertise. A practical case study on stroke patient pathways in the Southern Brittany Hospital is proposed to illustrate the approach. Results show that the best way to improve the number of optimal pathways is to increase the capacity of Rehabilitative Care units.
1 INTRODUCTION
1.1 Context
Congestion in the Emergency Department (ED) is one of the most important issues in healthcare systems. This situation leads to an increase in length of stay, a decrease in the quality of care and the burnout of nursing staff. Two major causes of this congestion are identified: (i) unjustified Emergency Department visits and (ii) a lack of downstream beds. An unjustified emergency visit concerns a patient who have no health problem or a non-emergency health problem. This situation creates a work overload for the medical staff. The lack of downstream beds increases the length of stay in the Emergency Department because patients have to wait for a bed in a relevant medical unit. Sometimes patients are admitted to a medical unit that is not adapted to their pathology in order to decrease the ED congestion. This situation is problematic because it reduces the quality of care.
The Southern Brittany Hospital (SBH) is a merger of two hospitals: the Lorient Hospital and the Quimperl´e hospital (since 2018). This fusion will lead to a major reorganization of the SBH in order to improve patient pathways from the admission in the emergency department to the discharge. Improving patient pathways can be done in two ways: (i) determining the most relevant pathways for a type of patients (e.g. pathology, age) and (ii) analyzing resource capacity requirements to avoid bottlenecks and queues. Business process modeling and process mining are relevant tools able to model patient pathways in hospitals and simulation allows a dynamic study. Simulation is one of the most suitable tools to test the impact on chosen indicators of any combination of changes (Jun and Jacobson 1999; Zhang 2018).
Many simulation studies focus on one type of pathology or a specific medical unit such as a geriatric care unit (Franck et al. 2015; El-Darzi et al. 1998), a stroke care unit (Augusto and Xie 2009; Chemweno et al. 2014), a cardiology care unit (De Bruin et al. 2007). The SBH needs a model able to adapt to each pathology so the model must be generic.
We propose a case study on stroke because this pathology has several interesting characteristics: it is the first cause of acquired handicap, the third cause of death, and with more than 1 case each 4 minutes, stroke is a major public health challenge in France. A recent study (Gabet et al. 2020) shows that stroke specialized medical units (in Neurology departments) reduce the lethality of patients by 2 after 1 month and after 1 year. In the SBH only 44% of stroke patients have access to such specialized units. For these reasons, improve stroke patient pathways is strategic for the SBH.
1.2 Scientific Contribution
In this paper we propose a generic simulation model in order to analyze all possible patient pathways from the Emergency Department to hospital discharge. The model can easily take into account several hospitals in order to be adaptable to the Southern Brittany Hospital situation (with two hospitals : Lorient and Quimperl´e) and can be extended to a regional area. We focus our study on stroke patients but the model can analyze all pathologies. The resulting tool is a decision aid for hospital managers and health regional decision makers.
The remainder of this paper is organized as follows. The framework of the model is described in Section 2. In Section 3, we propose the case study of stroke patients. We perform a pathway analysis using process mining (Section 3.1) and two designs of experiments are introduced (Section 3.2). Results are detailed in Section 3.2 and discussed in Section 4. Conclusions and perspectives are given in Section 5.
2 DESCRIPTION OF THE MODEL
In this section, we present the overall framework of the model. We first define the different elements used in our model, then we present the admission policies for each category of patients. Finally, we propose a global overview of the methodology.
2.1 Global Framework 2.1.1 Definitions
Definition 1 (Patient) We consider a set I of patients indexed by i ∈ {1 . . . i . . . |I|}. We consider only hospitalized patients (when a patient requires a bed in a medical unit). A patient have different characteristics such as his/her age, a pathology and a geographic location.
We consider 2 categories of patients, divided into 2 different subsets IX⊂ I and IY ⊂ I (IX+ IY= I) : • Unscheduled patients, i ∈ IX : these patients arrive at the hospital from the ED. Hospitalization
was not planned before. These patients contribute to ED congestion.
• Scheduled patients, i ∈ IY : these patients do not arrive at the hospital from the Emergency department. Their hospitalization is planned before their admission. They are not directly connected to the ED congestion problem but they must be included in the model to achieve actual hospital occupancy.
Definition 2 (Medical unit) We consider a set of Medical Units M indexed m ∈ {1 . . . m . . . |M|}. There are different types of medical units with different characteristics such as the speciality (geriatric, neurology) or the geographic location (e.g. Lorient or Quimperl´e in our case study). For each medical unit we consider a capacity Cm and a waiting queue Qm.
Definition 3 (Patient Pathway) A patient pathway is a sequence of Medical Units where the patient has been hospitalized. We consider Wi the pathway of the patient i where Wi=< Mi1. . . Mis. . . Mi|Si|>. Mis
is the Medical Unit of the patient i at the step s. A step is a stay in a medical unit (without duration consideration). We consider Si a set of steps of the patient i indexed s ∈ {1 . . . s . . . |Si|}.
Definition 4 (Phase Sequence) A phase models the activity performed by/on a patient during his/her clinical pathway. We note Histhe phase of patient i at step s. We consider a phase sequence Hi=< Hi1. . . His. . . Hi|S|> that complete the patient pathway sequence Wi. We consider 3 different phases:
• Waiting Phase (His= 1): the patient in a MU waits for a bed in a more relevant MU. The length of stay in this phase must be short (less than 1 day if possible).
• Acute Phase (His= 2) : the patient in a MU receives appropriate care. This phase is the core of the hospitalization. This phase can be composed of several steps. For example a patient can be admitted in an Intensive Care Unit in Neurology and then go in a General Neurology Unit. • Rehabilitative Phase (His= 3) : the patient recovers in a Rehabilitative Care Unit before discharge.
In the best pathway a patient should not go through any waiting phase. Rehabilitative phases are not mandatory.
2.1.2 Definitions for Specific Pathologies
In this section we extend the framework in order to analyze patient pathways for one or several specific pathologies.
Definition 5 (Types of patients) A type of patients is a group of Unscheduled patients who have the same characteristics. At least they must be treated for the same pathology z where Z is a set of specific pathologies indexed z ∈ {1 . . . z . . . |Z|} (i ∈ IPz⊂ IX). In addition a type of patients can include other parameters such as the age. For example elderly people can often require geriatric care. A relevant pathway for an elderly patient can be different than a young patient. Let G be the set of type of patients indexed by g ∈ {1 . . . g . . . |G|} and Ti the type of patients g of the patient i.
Definition 6 (Relevant Pathways) A relevant pathway is a pathway adapted to a type of patients g. Let Lg be a set of relevant pathways indexed by l ∈ {1 . . . l . . . |Lg|} and RWlg the Relevant Pathway l of the type of patients g.
Relevant pathways only consider the acute phase of pathways. We do not take the waiting phase into account because this phase does not depend on medical care but on the occupancy of the hospital.In addition the rehabilitative phase is also not considered in relevant pathways because this phase depends on the requirement of the patient i. We consider a binary parameter Ri, Ri= 1 when the patient i requires a Rehabilitative Phase, 0 otherwise. Relevant pathways RWlg are also ranked by relevancy from l = 1 (the most relevant pathway) to l = |Lg| (the worst relevant pathway).
In order to adapt our model to each situation we introduce the concept of substitution options. It happens that 2 different medical units can perform care for patients without major differences. In this case we consider a substitution option.
Definition 7 (Substitution Options) We consider SOlgs, the substitution option of the pathway l for the type of patients g at the step s. If there is a substitution option, SOlgs= m where m is the substitution medical unit, SOlgs= /0 if otherwise.
Example 1 RW1,2=< 2, 5, 7 > and SO1,2,2= 6 means that pathways < 2, 5, 7 > and < 2, 6, 7 > for patients belonging to type number 2.
2.2 Admission Policies
In this section we will present admission policies for Scheduled patients and unscheduled patients who are not concerned by a specific pathology (section 2.2.1) and patients concerned by a specific pathology z (section 2.2.2).
2.2.1 General Admission Policy
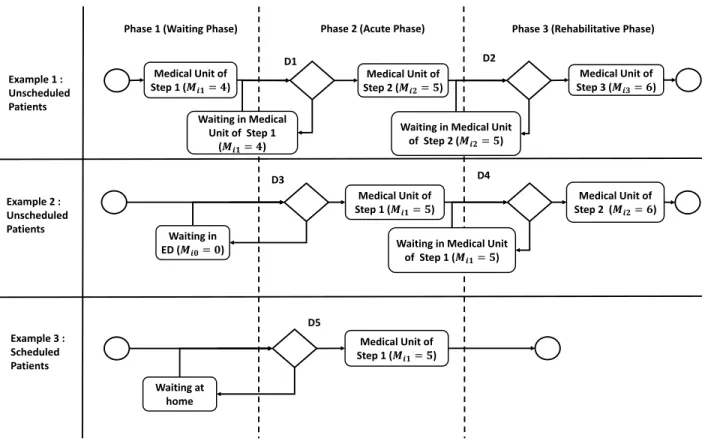
Definitions 1–4 allow us to describe all possible pathways in the hospital and to specify the nature of the phase based on the hospital dataset. The simulation model must include waiting policies according to the hospital occupancy. Three examples are presented in Figure 1 and commented below.
Medical Unit of
Step 1 (𝑴𝒊𝟏= 𝟒)
Phase 1 (Waiting Phase)
Medical Unit of
Step 2 (𝑴𝒊𝟐= 𝟓)
Phase 2 (Acute Phase) Phase 3 (Rehabilitative Phase)
Example 1 : Unscheduled Patients Example 3 : Scheduled Patients Medical Unit of Step 1 (𝑴𝒊𝟏= 𝟓) Waiting in Medical Unit of Step 1 (𝑴𝒊𝟏= 𝟒) Medical Unit of Step 3 (𝑴𝒊𝟑= 𝟔)
Waiting in Medical Unit
of Step 2 (𝑴𝒊𝟐= 𝟓) Medical Unit of Step 1 (𝑴𝒊𝟏= 𝟓) Example 2 : Unscheduled Patients Waiting in ED (𝑴𝒊𝟎= 𝟎) Medical Unit of Step 2 (𝑴𝒊𝟐= 𝟔)
Waiting in Medical Unit
of Step 1 (𝑴𝒊𝟏= 𝟓) Waiting at home D1 D2 D3 D4 D5
Figure 1: Examples of pathways for unscheduled and scheduled patients.
Example 2 We consider the pathway of an unscheduled patient composed of 3 steps (|Si| = 3). We consider medical units 4, 5 and 6 (respectively medical units of steps 1, 2 and 3). The pathway of the patient i is Wi=< 4, 5, 6 > and the phase sequence is Hi=< 1, 2, 3 >. The patient has first a waiting phase (Hi1= 1) in MU 4 (Very Short Stay Unit). Then the patient goes to MU 5 for the Acute Phase (Hi2= 2). At the decision point D1 we check if there is an available bed in the medical unit 5. If it is the case the patient is admitted in the medical unit 5. If it is not the case the patient remains in the previous medical unit (Mis−1= 4 in our case) and is added to the queue of his/her future medical unit : Q5. At step 3 the patient has a Rehabilitative phase (Hi3= 3), decision D2 is exactly the same way as decision D1.
Example 3 We consider the pathway of an unscheduled patient. In this case the database does not indicate that the patient performed a waiting phase. If we consider the same medical units than the previous example, the pathway of the patient i is Wi=< 5, 6 > and the sequence of phases is Hi=< 2, 3 >. The patient started his/her pathway by the acute phase (Hi1= 2) but in the simulation there is not necessarily an available bed
in medical unit 5. In this case the patient is placed in queue Q5 and in the Medical Unit that represents the ED (for example m = 0).
Example 4 We consider the pathway of a scheduled patient. For these patients the pathway is always Wi=< Mi1> and the phase sequence Hi=< 2 >. If the bed is not available the patient is placed in the queue of the medical unit and wait at home (because he/she did not go to ED).
2.2.2 Specific Pathologies Admission Policy
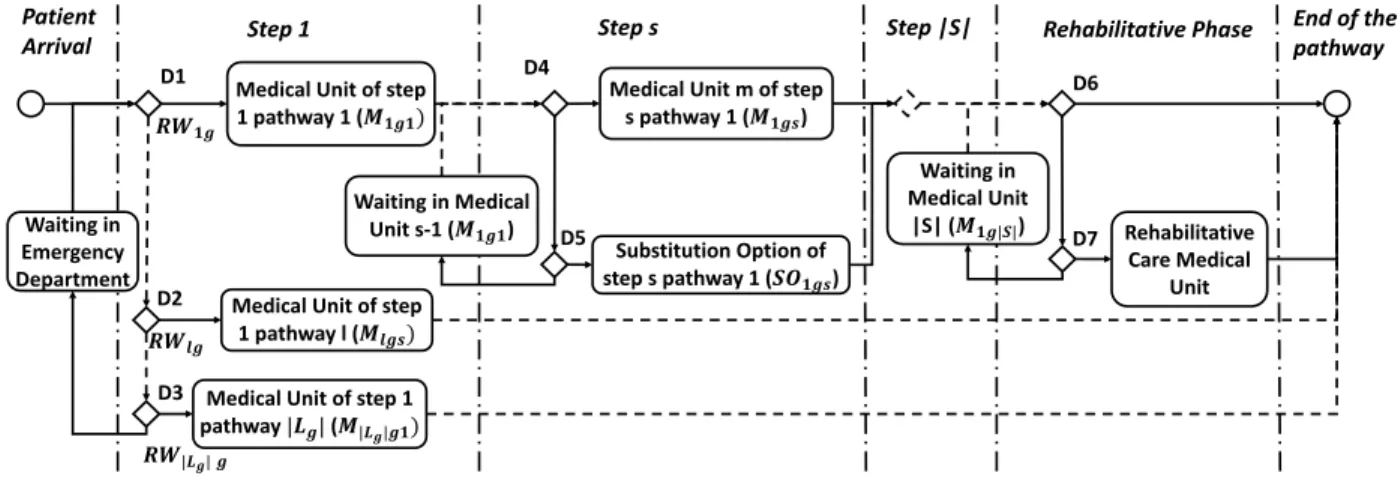
For patient who have a specific pathology, the admission policy must include the different relevant pathways and the possibility of substitution options. Figure 2 presents the admission policy when the patient i ∈ IPz. Example 5 First the patient arrives at an Emergency Department and requires a hospitalisation. At step 1 the patient must be assigned to a relevant pathway l for his/her type. First we check for RW1Ti if there is
an available bed in the structure M1g1. If this condition is verified (decision D1) the patient is assigned to the Relevant Pathway RW1g and is admitted to the medical unit M1g1. If D1 is false, the same operation is done for each Relevant pathway l (decision D2) until the pathway |Lg| (decision D3). If there is no possible option the patient waits in the ED (m = 0) until he/she can be assigned to a pathway. Then for each step s of the pathway RWlg we check if the medical unit Mlgshas an available bed. If the condition is verified the patient i is admitted to the unit (decision D4). Otherwise we check if there is a Substitution Option (SOlgs6= /0) and if there is an available bed in this medical unit. If the condition is true the patient is admitted to this alternative solution (decision D5), otherwise the patient remains in the medical unit Mlgs−1 and waits in queue QMlgs. After the last step |S| of pathway RWlg we check if the patient requires
a rehabilitative phase (decision D6). If it is not the case the patient has finished his/her pathway and can return home. If the condition is true the patient goes to a Rehabilitative Care medical unit as soon as a bed is available (decision D7). Otherwise the patient remains in the medical unit Mlg|S|.
Medical Unit of step
1 pathway 1 (𝑴𝟏𝒈𝟏)
Step 1 Step s Rehabilitative Phase Patient
Arrival
Medical Unit m of step
s pathway 1 (𝑴𝟏𝒈𝒔)
Medical Unit of step
1 pathway l (𝑴𝒍𝒈𝒔)
Medical Unit of step 1
pathway |𝑳𝒈| (𝑴|𝑳𝒈|𝒈𝟏) Step |S| Rehabilitative Care Medical Unit End of the pathway Waiting in Medical Unit s-1 (𝑴𝟏𝒈𝟏) Waiting in Emergency Department Waiting in Medical Unit |S| (𝑴𝟏𝒈|𝑺|) Substitution Option of step s pathway 1 (𝑺𝑶𝟏𝒈𝒔) D1 D2 D3 D4 D5 D6 D7 𝑹𝑾𝟏𝒈 𝑹𝑾𝒍𝒈 𝑹𝑾|𝑳𝒈| 𝒈
Figure 2: Admission policy for specific pathologies.
2.3 Methodology
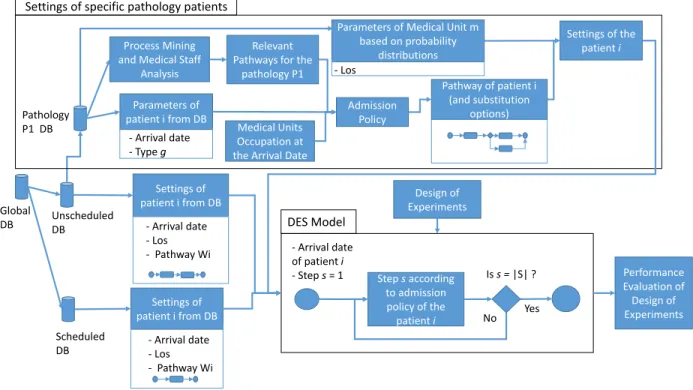
In this paper we propose a formal framework along with a methodology presented in Figure 3. It can be divided into 3 steps: (1) Data preparation, (2) Patient pathways setup and (3) Simulation model implementation.
In Step (1) data is extracted and prepared using national medico-administrative databases in order to use the framework in any hospital. For example, in our case study, we extract all hospitalizations of the Lorient and Quimperl´e hospitals. From this extraction, we build two databases: (i) the scheduled patients database and (ii) the unscheduled patient database.
In Step (2), for scheduled patients (i ∈ IY) and unscheduled patients who have not a specific pathology (i ∈ IX− IPz) all settings are extracted from the database: arrival date, pathway sequence, and the length of stay in each medical unit. For a specific pathology we use Process Mining to analyze pathways from the database and extract relevant and substitution pathways. Process Mining is a method to determine processes using data mining algorithms and filters.
In Step (3) the Discrete-Event Simulation model is implemented and allows the simulation taking into account the settings of patients and their admission policy. Each patient arrives in the system at a specified arrival date and is discharged when he/she has performed all steps of his/her pathway. The design of experiments proposes variations of medical unit capacities (e.g. number of beds) using design of experiments.
Process Mining and Medical Staff
Analysis
Relevant Pathways for the
pathology P1 Admission Policy Global DB Scheduled DB Unscheduled DB Pathology P1 DB Parameters of patient i from DB - Arrival date - Type g
Parameters of Medical Unit m based on probability
distributions - Los
Medical Units Occupation at the Arrival Date
Pathway of patient i (and substitution
options)
Settings of the patient i
Settings of specific pathology patients
Settings of patient i from DB - Arrival date - Los - Pathway Wi Settings of patient i from DB - Arrival date - Los - Pathway Wi Step s according to admission policy of the patient i - Arrival date of patient i - Step s = 1 Is s = |S| ? Yes No Performance Evaluation of Design of Experiments Design of Experiments DES Model
Figure 3: Global methodology.
3 CASE STUDY: STROKE PATIENT CARE PATHWAY
In this section we apply the methodology defined in Section 2.3 to analyze pathways of stroke patients (specific pathology) using Process Mining. Results have been reviewed by practitioners of the Southern Brittany Hospital.
3.1 Stroke Pathway Analysis 3.1.1 Data
We use a data-set extracted from the French National Data-Set of Hospitalizations. We included all ischemic strokes for the year 2018 in the South Brittany Hospital (Quimperl´e Hospital and Lorient Hospital). This set includes a total of 534 cases with 170 variants of pathways.
3.1.2 Set of Medical Units
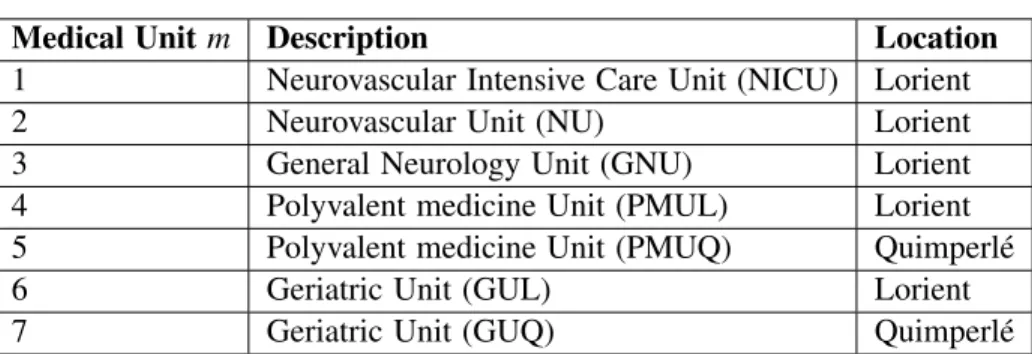
In order to reduce the model complexity we select the most used medical units as listed in Table 1. There are 3 medical units in the neurology department located in the Lorient hospital: (1) the Neurovascular Intensive Care Unit (NICU) is a medical unit dedicated to stroke and the very acute phase of this pathology; (2) the Neurovascular Unit (NU) is also specialized in stroke care; (3) the General Neurology Unit (GNU) concerns all neurological diseases. There are 2 Polyvalent Medicine Units we also considered: one located in the Lorient hospital (PMUL) and one located in the Quimperl´e hospital (PMUQ). Finally we also considered two Geriatric Units (GUL and GUQ).
Table 1: Medical units for stroke patients in SBH.
Medical Unit m Description Location
1 Neurovascular Intensive Care Unit (NICU) Lorient
2 Neurovascular Unit (NU) Lorient
3 General Neurology Unit (GNU) Lorient
4 Polyvalent medicine Unit (PMUL) Lorient
5 Polyvalent medicine Unit (PMUQ) Quimperl´e
6 Geriatric Unit (GUL) Lorient
7 Geriatric Unit (GUQ) Quimperl´e
3.1.3 Process Mining Analysis
We use the process mining software ProM to analyze the activity of stroke hospitalizations in the Southern Brittany Hospital. Such analysis is used to define optimal pathway for stroke patients and types of patients. The optimal pathway. We call “optimal pathway” the most adapted pathway for a stroke patient. This pathway is composed of the NICU and then the NU (RW =< 1, 2 >). The NU and the GNU are located in the same place at the Lorient hospital and the medical staff is common for both medical units. Thus the GNU can be considered as a substitution option (RW =< 1, 3 >). In 2018 those pathways account for 44% of stroke hospitalizations (235 cases). Among these 235 cases, 63 used the substitution option GNU (27% of the optimal pathway). A recent study (Gabet et al. 2020) confirms that these pathways should be used for all patients to improve the quality of care.
Elderly Patients We consider a patient as an elderly patient if he/she is aged of 80 years or more. The stroke data-set is composed of 52% elderly people (276). Among these patients, 32% (89) of followed optimal pathways. A suitable pathway for an elderly patient is to go to a geriatric medical unit. These patients have generally several chronic pathologies and geriatric units are able to handle these problems. This kind of pathways represents 28% of pathways (76 cases) of elderly pathways. Polyvalent Medicine Units can also take into account several pathologies but are less adaptable to elderly people issues. Such pathways represents 20% of elderly pathways (57 cases).
Geographic areas. There are two possible starts of pathways for stroke patients of the Lorient area: (i) the Qimperl´e ED and (ii) the Lorient ED. The number of patients coming from the Quimperl´e ED (resp. Lorient ED) is 94 (17%) (resp. 440 (83%)). The number of patients from Quimperl´e who performed an optimal pathway is 12 (13%) and 223 for patients from Lorient (51%). There is a strong difference of quality of care for stroke patients depending to the initial ED location.
3.1.4 Relevant Pathways for Stroke Patients
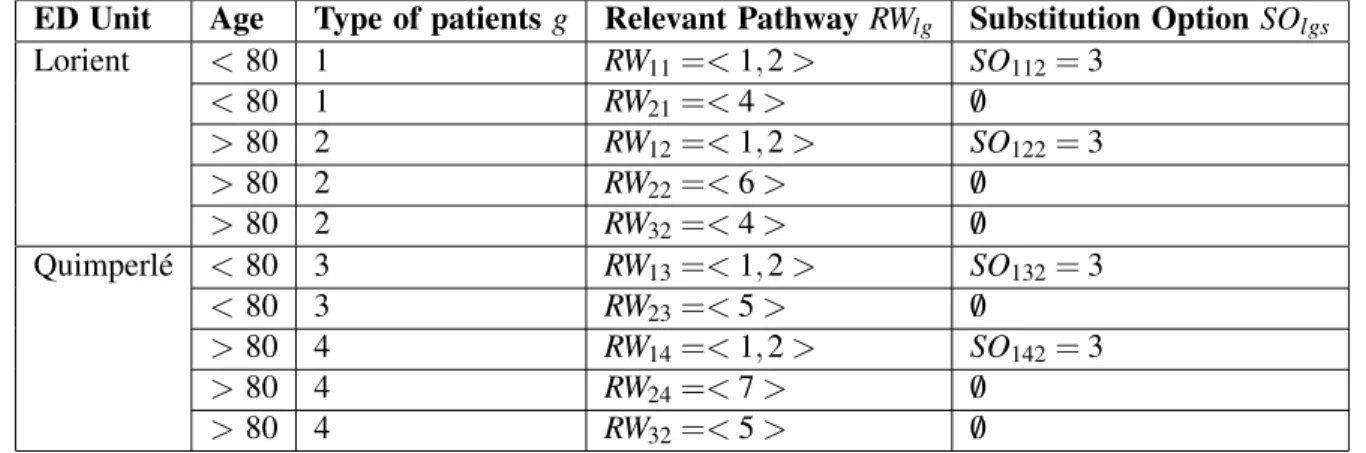
According to the pathway analysis proposed in Section 3.1.3 we define types of patients g and related sets of relevant pathways l. We consider 4 types of patients characterized by their age and the location of the initial ED, summarized in Table 2.
Table 2: Relevant pathways per type of patients for stroke patients.
ED Unit Age Type of patients g Relevant Pathway RWlg Substitution Option SOlgs
Lorient < 80 1 RW11=< 1, 2 > SO112= 3 < 80 1 RW21=< 4 > /0 > 80 2 RW12=< 1, 2 > SO122= 3 > 80 2 RW22=< 6 > /0 > 80 2 RW32=< 4 > /0 Quimperl´e < 80 3 RW13=< 1, 2 > SO132= 3 < 80 3 RW23=< 5 > /0 > 80 4 RW14=< 1, 2 > SO142= 3 > 80 4 RW24=< 7 > /0 > 80 4 RW32=< 5 > /0
Patients of type 1 are young patients (< 80 y.o.) arriving from the Lorient ED. Relevant pathway (RW11) is the optimal pathway: NICU then NU. A substitution option is possible at step 2 with GNU instead of NU. Second relevant pathway (RW21) is to go to the PMUL. Nevertheless this pathway is not specialized in Neurovascular issues so the quality of care is lower than the pathway 1.
Patients of the type 2 are elderly patients arriving from the Lorient ED. The most relevant pathway (RW12) is the optimal pathway because the Neurology Department remains the best option for stroke patients. The second relevant pathway (RW22) is composed of 1 step, the geriatric unit (GUL). In section 3.1.3, we saw that geriatric units are a good option to handle the problem of poly-pathology of elderly people. The third pathway for this type of patients (RW32) is the PUL.
We consider 2 other types of patients (3 and 4) when patients come from the Quinperl´e ED. Patients of type 3 (resp. 4) are young patients (resp. elderly patients).
3.2 Simulation
In this article we will consider two designs of experiments (DoE) to improve the quality of care for stroke patients (i.e. increase the number of patients following an optimal pathway as presented in Section 3.1.3 composed of the NICU and then the NU). We increase the number of of NICU and NU beds. In the DoE 1 all distributions are based on the data set. In DoE 2 we use theoretical distributions according to practitioners expertise.
To evaluate performances of scenarios we use 4 Key Performance Indicators (KPIs). KPI1 is the number of optimal pathways (best for stroke patients). KPI2 is the Average Queue in NU. KPI3 is the length of stay in NICU. KPI4 is the average demand of Rehabilitative Care Unit (RCU) per day. We use this KPI only in DoE 2.
We use AnyLogic Personal Learning Edition 8.5.1 to implement the model. The data set is composed of all hospitalized patients in the Southern Brittany Hospital from January 2018 to July 2018. It represents 6 months of hospitalizations with 1 month of Warm Up. We run 20 replications. The arrival date of each patient is based on the data set.
3.2.1 Design of Experiments 1
In this DoE we computed length of stay distributions of Stroke Patients (i ∈ IP1) on the data set (Table 3). To validate these distributions we simulated the model using real pathways of patients (Wi) without limitation of capacities. We compared with a 95% confidence interval different parameters between data set and the simulation. This parameters are the mean occupation, the maximum occupation and the average length of stay for each medical unit concerned by distributions.
According Neurology practitioners the length of stay of the NICU is often impacted by the lack of available beds in NU. In theory the length of stay in these units is at least 2 days and practitioners estimated
the average LOS at 2.5 days. We adjusted the distribution in order to respect the observed average length of stay with the current hospital capacity (3.7 days) and respect a theoretical length of stay for these units (around 2.5 days) when there is no capacity constraint. It allows us to measure the impact of scenarios on the NICU LOS.
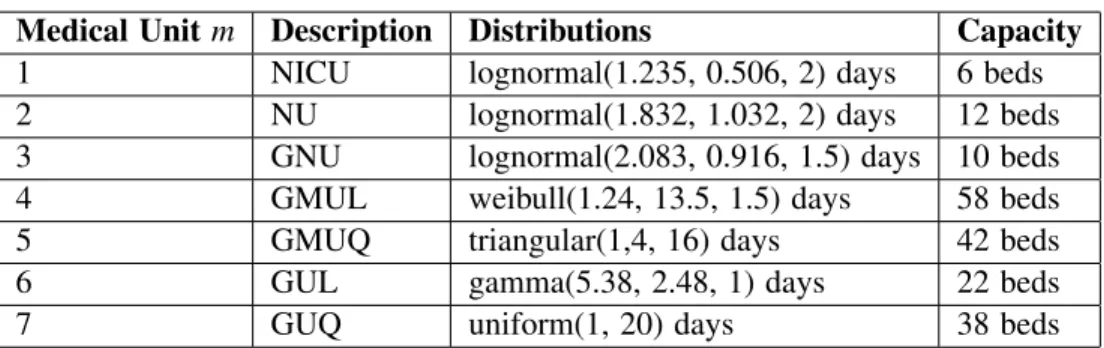
Table 3: Distributions per medical unit for stroke patients of DoE 1.
Medical Unit m Description Distributions Capacity
1 NICU lognormal(1.235, 0.506, 2) days 6 beds
2 NU lognormal(1.832, 1.032, 2) days 12 beds
3 GNU lognormal(2.083, 0.916, 1.5) days 10 beds
4 GMUL weibull(1.24, 13.5, 1.5) days 58 beds
5 GMUQ triangular(1,4, 16) days 42 beds
6 GUL gamma(5.38, 2.48, 1) days 22 beds
7 GUQ uniform(1, 20) days 38 beds
Table 4 shows scenarios of the design of experiments. We vary the number of NICU and NU beds from the current capacities to configuration with at most 10 additional beds (NU+NICU). We determined the number of NU beds according to the number of additional beds and the number of NICU beds. For example in the scenario with 4 additional beds and 8 NICU beds, the number of NU beds is 14.
Table 4: Scenarios for the DoE 1.
Number of additional beds 0 1 2 3 4 5 6 7 8 9 10
6 NICU beds 12 NU beds 13 14 15 16 17 18 19 20 21 22
7 NICU beds - 12 13 14 15 16 17 18 19 20 21 8 NICU beds - - 12 13 14 15 16 17 18 19 20 9 NICU beds - - - 12 13 14 15 16 17 18 19 10 NICU beds - - - - 12 13 14 15 16 17 18 11 NICU beds - - - 12 13 14 15 16 17 12 NICU beds - - - 12 13 14 15 16
For better readability we only represent scenarios with 6, 7, 8 and 10 NICU beds. Figure 4 shows the number of optimal pathways (KPI1) and Figure 5 the average number of patients in the NU queue (KPI2). Figure 4 shows that the average number of the optimal pathway increases in all scenarios. The current number of beds (6 NICU and 12 NU) allows 120.85 optimal pathways on average. If we add NU beds, the KPI1 improves significantly until 5 added beds (151.3).Then the curve follows an asymptotic trajectory. To improve these results it is necessary to increase the number of NICU beds. The number of optimal pathways for scenarios with 7 NICU beds is 184.8 with 10 added beds (21 NU beds). Scenarios with 8 and 10 NICU beds have no significant difference. The best average number of optimal pathways with 10 added beds is 212.5 (10 NICU beds and 16 NU beds). Figure 5 shows the average number of patients in the NU Queue. When we increase the number of NICU beds, the average number of patients in queue increases. There are more people in NICU but proportionally less available beds in NU and it creates a bottleneck. The amount of KPI2 strictly increases when there are 10 NICU beds (12,8 for for 4 additional beds). When we increase the number of NU beds the average number of patients in NU queue decreases in each situation. These results indicate that the number of NICU and NU beds must be balanced to avoid queues. When there are enough NU beds the average number of patients in queues tends to 0.
Figure 6 shows the LOS of patients in NICU. In the current situation the LOS is 3.56 days. When the number of NU beds increases, this duration of KPI3 decreases until 2.44. It is the lowest value possible because the length of stay in this medical unit is at least 2 days (average 2.5 days). When the number of NCIU beds increases the length of stay in NICU increases too (until 6.19 days for 10 NICU beds and 12
NU beds). In this situation there is an improvement of the quality of care (KPI1) but it creates a bottleneck. This bottleneck induces a raise in queues (KPI2) and a raise in the LOS (KPI3).
115 135 155 175 195 215 235 0 1 2 3 4 5 6 7 8 9 10 A ver ag e Numbe r of P ath w ay s
Number of additional beds (NICU+NU) 6 NICU
8 NICU 10 NICU
7 NICU
Figure 4: KPI1 Avg. number of optimal pathways.
0 2 4 6 8 10 12 14 16 0 1 2 3 4 5 6 7 8 9 10 A ver ag e Numbe r of pa tien ts
Number of additional beds (NICU+NU) 6 NICU
7 NICU 8 NICU
10 NICU
Figure 5: KPI2 Avg. number of patients in NU Queue.
0 1 2 3 4 5 6 7 0 1 2 3 4 5 6 7 8 9 10 A ver ag e Numbe r of Da ys
Number of additional beds (NICU+NU) 6 NICU
7 NICU 8 NICU
10 NICU
Figure 6: KPI3 Avg. LOS of NU patients.
3.2.2 Design of Experiments 2
In DoE 1 we adjusted the NICU distribution in order to improve the behavior of the model. The NU is also impacted by a lack of available places in rehabilitative care units. Often patients begin the rehabilitative phase in the NU and they become bed blockers. Neurology practitioners estimated theoretical LOS for NICU and NU without waitings due to Rehabilitative Care Units occupation. We used triangular distributions presented in Table 5. We consider that each patient with a length of stay of more than 7 days in NU requires a Rehabilitative Care Unit (Ri= 1). It represents 70% of stroke patients. We use a similar design of experiments than design of experiments 1 but we allow only 5 additional beds.
Table 5: Distributions per medical unit for stroke patients of DoE 2.
Medical Unit m Description Distributions
1 Neurovascular Intensive Care Unit (NICU) triangular(2,2.5, 4) days
2 Neurovascular Unit (NU) triangular(1, 4, 7) days
3 General Neurology Unit (GNU) triangular(1, 4, 7) days
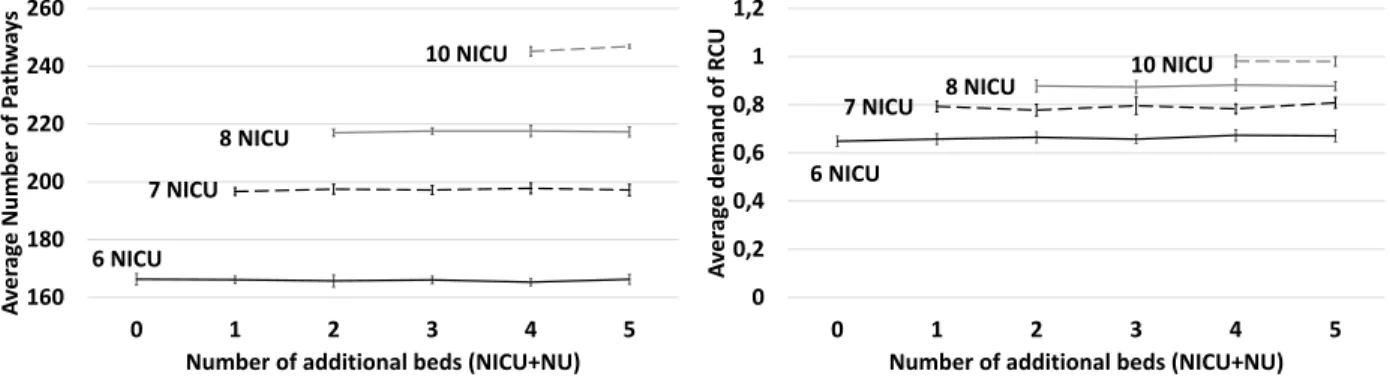
Figure 7 shows that the number of optimal pathways increases strongly compared to the design of experiments 1. In the current situation (6 NICU beds and 12 NU beds) the average number of optimal pathways is 166.3. In design of experiments 1 this result corresponds to scenarios with 4 additional beds (for example 8 NICU beds and 14 NU beds). In addition adding NU beds does not improve KPI1.
Increasing the number of NICU beds improve strongly this KPI. The scenario with 4 additional beds and 10 NICU beds allows 245.15 optimal pathways on average. There is 259 stroke patients in the data-set so it represents 94% of optimal pathways. The Figure 8 shows the average demand on Rehabilitative care per day. Scenarios with 6 NICU beds require on average 0.65 Rehabilitative care place per day to allow the new distributions. When the number of NICU bed increases the average number of demands increases too. Scenarios with 10 NICU beds require on average 0.98 rehabilitative care beds per day.
160 180 200 220 240 260 0 1 2 3 4 5 A ver ag e Number of P ath w ay s
Number of additional beds (NICU+NU) 6 NICU
7 NICU 8 NICU
10 NICU
Figure 7: KPI1 Avg. number of optimal pathways.
0 0,2 0,4 0,6 0,8 1 1,2 0 1 2 3 4 5 A ver ag e demand of R CU
Number of additional beds (NICU+NU) 6 NICU
7 NICU 8 NICU
10 NICU
Figure 8: KPI4 Avg. demand on RCU per day.
4 DISCUSSION
Many simulation models are specific medical unit (or department) based. G¨unal and Pidd (2010) explain this trend by the fact that decision-makers often need quick and targeted responses. Attempts to model an entire hospital are rare and require simplifications (Pidd 2003). Our model allows decision-makers to choose their simplifications and to define their study using a unique framework. We can also integrate several hospitals, (e.g., Lorient and Quimperl´e) and test different DoE.
Numerical results highlight differences between DoE 1 and 2. In DoE 1, increasing the number of optimal pathways (KPI1) requires to add a lot of beds. Adding NU beds increases slowly KPI1 but reduces the average number of patients in NU queue and improve the NICU LOS. Adding NICU beds has better results for KPI1 but it increases the NU queue and the LOS of NICU. In DoE 1, the NU is a bottleneck. It is possible to improve the quality of care but the the gain per added bed is limited.
In DoE 2 we have changed the length of stay distributions of the Neurology Department (NICU, NU and GNU). These new distributions are based on the expertise of practitioners. They consider that the lack of available beds in Rehabilitative Care Units forces them to begin the rehabilitative phase in NU or in GNU. We used theoretical length of stay to correct this problem. Results in this design of experiments are significantly better than results obtained in DoE 1. In DoE 2 the NICU becomes the bottleneck of the system and adding beds in this unit increases strongly the number of optimal pathways. Adding 4 NICU allows to reach 94% of optimal pathways. This configuration reduces the inequality between the Lorient ED and the Quimprel´e ED.
Such good results must be qualified because we made strong assumptions. New distributions of LOS have been determined according to estimations of doctors and not based on a real data-set. In addition this configuration requires a large number of rehabilitative care solutions (in average 1 per day when we add 4 NICU beds). It requires important investments in Rehabilitative Care Medical Unit.
5 CONCLUSION AND FUTURE WORKS
In this paper we proposed a generic framework in order to model every patient pathways in a hospital or several hospitals. We introduced a formal modelling approach for care pathways within the hospital. We used Process Mining to determine with medical staff relevent pathways for a given pathology. Then we
proposed two designs of experiments: (i) using LOS distributions based on real data and (ii) using LOS distributions based on the expertise of practitioners. Results show that it is possible to strongly improve the quality of pathways by increasing Rehabilitative Care Units capacity.
The genericity of the model opens many perspectives to extend this study: include other hospitals to test regional stroke management policies, use the model for other pathologies (with priority rules beetwen pathologies). For future works we plan to move the simulation model to a digital twin tool that can be used daily by practitioners.
REFERENCES
Augusto, V., and X. Xie. 2009. “Redesigning the Neurovascular Unit of a Health Care Complex”. In Proceedings of the International Conference on Industrial Engineering and Systems Management. May 13th-15th, Montreal, Canada.
Chemweno, P., V. Thijs, L. Pintelon, and A. Van Horenbeek. 2014. “Discrete Event Simulation Case Study: Diagnostic Path for Stroke Patients in a Stroke Unit”. Simulation Modelling Practice and Theory 48:45–57.
De Bruin, A. M., A. Van Rossum, M. Visser, and G. Koole. 2007. “Modeling the Emergency Cardiac In-Patient Flow: An Application of Queuing Theory”. Health Care Management Science 10(2):125–137.
El-Darzi, E., C. Vasilakis, T. Chaussalet, and P. Millard. 1998. “A Simulation Modelling Approach to Evaluating Length of Stay, Occupancy, Emptiness and Bed Blocking in a Hospital Geriatric Department”. Health Care Management Science1(2):143–149.
Franck, T., V. Augusto, X. Xie, R. Gonthier, and E. Achour. 2015. “Performance Evaluation of an Integrated Care for Geriatric Departments Using Discrete-Event simulation”. In Proceedings of the 2015 Winter Simulation Conference, edited by L. Yilmaz, W. K. V. Chan, I. Moon, T. M. K. Roeder, C. Macal, and M. D. Rossetti, 1331–1342. Piscataway, New Jersey: Institute of Electrical and Electronics Engineers, Inc.
Gabet, A., O. Grimaud, C. de Peretti, Y. B´ejot, and V. Oli´e. 2020. “D´eterminants de la L´etalit´e `a la Suite d’une Hospitalisation pour un Accident Vasculaire C´er´ebral en France, 2010-2015”. Bull Epid´emiol Hebd 5:98–107.
G¨unal, M. M., and M. Pidd. 2010. “Discrete Event Simulation for Performance Modelling in Health Care: A Review of the Literature”. Journal of Simulation 4(1):42–51.
Jun, J., and J. R. Jacobson, Sheldon H aand Swisher. 1999. “Application of Discrete-Event Simulation in Health Care Clinics: A Survey”. Journal of the Operational Research Society 50(2):109–123.
Pidd, M. 2003. Tools for Thinking: Modelling in Management Science. 2nd ed. Chichester, UK: John Wiley and Sons Ltd. Zhang, X. 2018. “Application of Discrete Event Simulation in Health Care: a Systematic Review”. BMC Health Services
Research 18(1):98–107.
AUTHOR BIOGRAPHIES
THOMAS FRANCK is a post-doctoral researcher at the Center for Health Engineering at Mines de Saint-Etienne (EMSE) and at Groupe Hospitalier Bretagne Sud, France (GHBS). He received his Ph.D. in Industrial Engineering from Mines Saint-Etienne in 2018. His research interests include Discrete Event Simulation in health care systems. His email address [email protected]. VINCENT AUGUSTO is a Professor of industrial engineering and he is the head of the Center for Health Care Engineering at Mines Saint-Etienne. He received his Ph.D. in Industrial Engineering from Mines Saint- Etienne, France, in 2008 and the Habilitation `a Diriger des Recherches degree from the University of Saint-Etienne, France, in 2016. He was a visiting scholar at CIRRELT (Centre Interuniversitaire de Recherche sur les R´eseaux d’Entreprise, la Logistique et le Transport), University of Laval, Quebec, Canada in 2009 and 2015. His research interests include modeling, simulation, optimization of healthcare systems and their supply chains, process mining and machine learning applied to healthcare. His email address [email protected]. PAOLO BERCELLI is the medical information doctor of the Groupe Hospitalier Bretagne Sud, France (GHBS). His email address [email protected].
SABER ALOUI has a Ph.D. in Risk Management (2007) from the Ecole des Mines de Paris, Doctoral team called “Centre for research on Risks and Crises”. His research aims to develop and to formalize concepts and tools allowing to analyse the risk occurrence in large health care organizations. He is currently CIO of the Groupe Hospitalier Bretagne Sud, France (GHBS). His email address [email protected].