HAL Id: halshs-01138159
https://halshs.archives-ouvertes.fr/halshs-01138159
Preprint submitted on 1 Apr 2015
HAL is a multi-disciplinary open access
archive for the deposit and dissemination of sci-entific research documents, whether they are pub-lished or not. The documents may come from teaching and research institutions in France or
L’archive ouverte pluridisciplinaire HAL, est destinée au dépôt et à la diffusion de documents scientifiques de niveau recherche, publiés ou non, émanant des établissements d’enseignement et de recherche français ou étrangers, des laboratoires
for Government Stability in WAEMU Countries
Djedje Hermann Yohou, Michaël Goujon, Wautabouna Ouattara
To cite this version:
Djedje Hermann Yohou, Michaël Goujon, Wautabouna Ouattara. Heterogeneous Aid Effects on Tax Revenues: Accounting for Government Stability in WAEMU Countries. 2015. �halshs-01138159�
C E N T R E D'E T U D E S E T D E R E C H E R C H E S S U R L E D E V E L O P P E M E N T I N T E R N A T I O N A L
Heterogeneous Aid Effects on Tax Revenues:
Accounting for Government Stability in WAEMU Countries
Djédjé Hermann YOHOU
Michaël GOUJON
Wautabouna OUATTARA
Etudes et Documents n° 06
Mars 2015 CERDI 65 BD. F. MITTERRAND63000 CLERMONT FERRAND – FRANCE TEL.+33473177400
To cite this document:
Yohou D.H., Goujon M., Ouattara W. (2015) “Heterogeneous Aid Effects on Tax Revenues: Accounting for Government Stability in WAEMU Countries”, Etudes et Documents, n°06, CERDI.
http://cerdi.org/production/show/id/1666/type_production_id/1
The authors
Djédjé Hermann Yohou PhD Student
Clermont Université, Université d'Auvergne, CNRS, UMR 6587, CERDI, F-63009 Clermont Fd Email: dher.yohou@gmail.com
Michaël Goujon Associate Professor
Clermont Université, Université d'Auvergne, CNRS, UMR 6587, CERDI, F-63009 Clermont Fd Email: michael.goujon@udamail.fr
Wautabouna Ouattara Associate Professor
UFR-SEG, Felix Houphouët Boigny University of Abidjan-Cocody, BP V 43 Abidjan, Côte d’Ivoire
Email: wautabouna@yahoo.ca
Corresponding author: Djédjé Hermann Yohou
Etudes et Documents are available online at: http://www.cerdi.org/ed
Director of Publication: Vianney Dequiedt Editor: Catherine Araujo Bonjean
Publisher: Chantal Brige-Ukpong ISSN: 2114 - 7957
Disclaimer:
Etudes et Documents is a working papers series. Working Papers are not refereed, they constitute research in progress. Responsibility for the contents and opinions expressed in the working papers rests solely with the authors. Comments and suggestions are welcome and should be addressed to the authors.
This work was supported by the LABEX IDGM+ (ANR-10-LABX-14-01) within the program “Investissements d’Avenir” operated by the French National Research Agency (ANR)
Abstract
We examine the heterogeneous effects due to government stability of foreign aid on tax revenues in the West African Economic and Monetary Union countries over the period 1986-2010. We show that the tax effects of aid are gradual and varying across countries according to the level of government stability. The Panel Smooth Threshold Regressions indicate that at low levels of government stability, aid negatively affects tax performances. At high levels, it encourages tax collection. Consequently, we provide estimates of individual time varying coefficients of aid effects. In general, the positive effects are marked since the mid of 1990 decade. However, decomposing aid into its forms of loans, technical and non-technical grants provides nuanced results.
Key words: Foreign aid, Government Stability, Tax Revenue, PSTR, WAEMU JEL codes: F35, 017, H20, C23, O55
Acknowledgment
We are very grateful to Mario Mansour and Dora Benedek from IMF Fiscal Affairs Department for kindly providing data and to Gilbert Colletaz and Christophe Hurlin from the Laboratoire d'Économie d'Orléans for the software codes. We also thank Jean-François Brun, Thierry Yogo and Eric Kéré for helpful discussions. Thanks also go to the participants of IHEID -CES-ERUDITE-LEO-CERDI Doctoral Days of December 2014-Paris for their helpful comments. All the errors are ours.
1
Introduction
An adequate supply of public goods and services is essential for economic growth and poverty reduction in developing countries. Yet the funding of this supply remains a major challenge due to a low level of public resources. In order to make up this gap, developing countries resort to international assistance mainly in the form of foreign aid. However, empirical research on the effect of aid on tax performances is very inconclusive. Indeed, in one hand some authors argue that foreign aid can substitute for tax revenues by deterring the incentives to reforms and good policies (Azam et al., 1999; Benedek et al., 2012). On the contrary, some others authors found that aid doesn’t harm tax performance in recipient countries in the extent that the latter benefit from technical assistance (Brun et al., 2011b), and/or when aid increases public spending (Morrissey et al., 2006; Clist and Morrissey, 2011). Some new recent developments suggest that the impact of aid on tax collection depends on the quality of institutions (Brun et al., 2011b; Benedek et al., 2012).
The bedrock of any skepticism about aid is whether the recipient government will conduct the necessary reforms with the utmost determination it would have had if it could not receive aid, which poses the question of the quality of its will. For now, everything seems to indicate that this strong political commitment is not utterly yet conspicuous in several recipient countries. A 2011 report of the G-20 Development Working Group strongly advocates for greater national political will to foster the effi-ciency of the contribution of foreign aid in promoting efficient tax system. The relevance of the degree of political will lies in the fact that it determines the quality of the whole process of the decision-making of policymakers and taxpayers.
Arguably, the degree of political instability, which measures the degree of govern-ment instability, has an important role in explaining that of political will and support and the ability of governments to conduct reforms. A number of papers show that uncertainty about the stability of policymakers generates uncertainty about the sus-tainability of the current and future courses of economic policies (tax rates, public goods etc.) (Alesina and Perotti, 1996; Alesina et al., 1996; Carmignani, 2003). This uncertainty about their survival may lead governments to engage in suboptimal policies by undertaking myopic policies in order to stay in office, to enlarge their electoral con-sensus and most importantly by delaying or reversing the required structural reforms, by reneging their previous commitments etc.(Carmignani, 2003). As a result, these suboptimal policies induce economic inefficiencies. In a context of political instability, citizens may not trust government commitment to provide good quality of public ser-vices and to promote growth. They then prefer to create reserves for access to private
services instead of paying taxes. In that case, foreign aid which one objective is to contribute to finance public services which in turn should promote tax compliance does not translate into additional domestic resources.
Political instability then worsens relationships between citizens and the state and compromises the efficiency of foreign aid in promoting tax collection. Another issue related to political instability is that the change in government direction sometimes causes an upheaval in the whole of administration including staff in charge of reforms of tax administrations. This change may be favorable if the current administration is incompetent and/or corrupt and their substitutes are viewed as an improvement (Alesina et al., 1996). However this seems to be far from the reality. In instance, Fossat and Bua (2013) point out that political instability and frequent turnover of ministers of finance and tax administration managers in SSA francophone countries worsen the inadequate political support and their insufficient commitment, which in turn impair the implementation of tax reforms.
Since government stability determines the quality of reforms and public services, tax compliance while aid is expected to be efficient in promoting tax collection in countries where good reforms are implemented, it is logical to expect that government stability affects the relationship between aid and tax performances. But this issue in aid-tax relationship has not been very highlighted to our knowledge.
The objective of this paper is twofold. First, it aims at assessing the impact of government stability in aid-tax relationship focusing on West African Economic and Monetary Union countries in the line with the Fossat and Bua (2013) report. The choice of WAEMU is interesting as while member countries share a number of com-mon economic features and fiscal arrangements, they may differ between them and over time on government stability. WAEMU has adopted since 1994 convergence criteria targeting inflation, public debt and deficits to monitor the fiscal situation of member countries. To meet these criteria, a fiscal transition program has been adopted aim-ing at increasaim-ing tax revenues over 17% of GDP. In addition, administrative reforms have been undertaken to decentralize the fiscal administration while audit offices and computer systems have been established to improve public financial management. Tax administrations have also adopted code of ethics and deontology. The reforms aim to eliminate fraud, evasion, corruption and to increase fiscal compliance. In spite of these reforms, the tax to GDP ratio remains below the target. During the former decade, it reached about 15.6% on average in WAEMU. However, in a context of government stability improvement, while aid reliance remains very high, it significantly decreases. The level of aid-to-tax ratio represents 132% over 1985-1994 against only 84% over 1995-2010 (Benedek et al., 2012; World Bank, 2014). The remaining question for these
countries is whether they have reached a critical level of stability that shifts a significant effect of aid on tax performance.
This last question determines the second objective of the paper. Indeed, the liter-ature is characterized by some critics related to the treatment of heterogeneity across countries and over time. Though many efforts have been made to control them through panel data instead of cross-sections or sub-samples, there remains an important chal-lenge for model specification (Prichard et al., 2013). In particular, studies testing the effect of institutions on aid-tax relationship often use an interaction term between institutions and aid or either use sub-samples of countries grouped by their level of institutional quality. These approaches potentially suffer from several limitations. The interactive term assumes that externalities generated by institutional quality or aid are homogeneously varying over time since they result from a bilinear relationship. In ad-dition, sub-sample approach is often based on an arbitrary cutoff between groups and it doesn’t allow countries to move from one group to another. In order to circumvent these shortcomings, we resort to Panel Smooth Transition Regression(PSTR)to toughly test for any non-linearity in aid-tax relationship and to determine endogenously the thresh-old of government stability from which the effects of aid on tax revenues shifts critically. The paper is organized as follows. Section 2 reviews the existing literature on the effect of aid on tax performances. Section 3 outlines the fiscal and institutional challenges as well as the aid reliance in WAEMU. Section 4 describes the methodology and data. Section 5 discusses the results while section 6 concludes.
2
Literature review
The literature on the effects of aid on tax performances can be subdivided into three major trends: i) aid crowds out tax revenues; ii) aid doesn’t lower tax effort and iii) the effect of aid on tax mobilization is conditional.
Three main ideas are put forward to demonstrate that aid lowers domestic tax col-lection. These arguments generally rely on the adverse consequences of aid for macroe-conomic stability (Gupta et al., 2003). Firstly, aid is more volatile and unpredictable than domestic revenues and this instability increases with the aid dependency. Sec-ondly, pro-poor public spending becomes highly aid-dependent and then falls when aid flows diminish or cease. Thirdly, Azam et al. (1999) have theoretically demonstrated that high dependency on aid is damageable for governance in the long run. In particu-lar, it doesn’t encourage governments to adopt good policies or to develop an effective public revenue and expenditure system. Moreover, by weakening governance, foreign aid makes the recipients governments more vulnerable to the influence of interest groups
demanding more tax exemptions (Gupta et al., 2003).
Numerous empirical studies have supported evidence of this latter argument. Rem-mer (2004), through a regression analysis of 120 developing countries over 1970–1999 period finds that aid systematically generates incentives and opportunities for the ex-pansion of government spending. In contrast, aid reduces revenue collection. Br¨autigam and Knack (2004) show that more aid erodes the quality of governance and the tax to GDP ratio over the 1982-1997 period. Although their results are strong to various econometric specifications (OLS, 2SLS and Ordered Logit), they are based on cross-section regressions with only about 30 countries. In further cross-cross-section regressions of 110 developing countries over 1999-2005 and using a World Bank indicator on ”effi-ciency of revenue mobilization”, Knack (2009) shows that aid exerts a negative effect on tax systems. The main limit of these studies is that they use cross-section data and do not deal with time dynamics.
In addition, the evidence of unfavorable impact of aid on tax systems through polit-ical institutions of the recipient countries is debatable since some studies find out that aid promotes governance or doesn’t change the trajectory of the institutions (Wright, 2009; Dutta et al., 2013).
In extension of these previous investigations, there are a number of empirical studies that focus on the conditions under which aid could be effective in improving tax perfor-mances. The first idea is that the effect of aid depends on its composition. Empirical results of Gupta et al. (2003) in a sample of 107 developing countries over 1970-2000 suggest that grants reduces tax effort but that loans, because they must be repaid, encourage tax collection. Using more recent data and a wider sample of 118 countries over 1980-2009, Benedek et al. (2012) find similar results. They also find that net ODA and grants are negatively associated with VAT, excise and income taxes but positively with trade taxes. Besides, they test for nonlinearities by including a squared term for aid or aid component (grants and loans) as explanatory.
Notwithstanding the echo that these studies have received, other empirical investi-gations show that the negative relationship between aid and tax effort is not robust and in some cases is positive. Clist and Morrissey (2011) report a positive effect of grants on tax to GDP ratio on a sample of 82 developing countries over 1970-2005. The pos-itive effect of grants occurs even over the medium term. The approach of Brun et al. (2011a) departs from all of the other studies. Following Stotsky and WoldeMariam (1997), they first compute an indicator of tax effort from the residuals of the regression of government revenue on structural determinants of tax (GDP per capita, the ratios of import and agriculture value added to GDP, and the share of fuel and mineral exports in total exports). They then regress tax effort on macroeconomic policy variables
(pri-mary budget deficit, debt service, inflation and real exchange rate); aid variables (total aid level, grants, loans and aid instability) as well as institutional variables (corruption, quality of bureaucracy and democracy). According to their results, the positive impact of aid on tax effort does not depend on aid forms; either it is grant or loan.
Furthermore, studies defending a negative correlation between aid and tax revenues or the primacy of loans versus grants spark also some important econometric concerns. According to Clist and Morrissey (2011) and Morrissey et al. (2006), the economet-ric models of Gupta et al. (2003) and Benedek et al. (2012) are mis-specified as they result from the contemporaneous relationship between aid and tax. Then there is no surprise to have a negative sign of grants insofar as the poorest countries, or countries experiencing a crisis, tend to have a lower tax to GDP ratio and larger grants. It is thus necessary to test for lagged effects of aid, especially when changes in tax collection systems are gradual and usually operate over the medium term. In addition, it seems hard to accept that technical assistance for institutional strengthening and tax admin-istration reforms does not improve tax performances. The econometric estimates of Brun et al. (2011b) evince that the International Monetary Fund programs affect posi-tively revenue collection in the recipient countries although this effect varies according to institutional quality.
Besides the whole controversy on aid tax effects, there seems to be a consensus on the role of the quality of institutions in improving these effects. However, only a few number of papers examine this issue including those of Gupta et al. (2003), Benedek et al. (2012), Brun et al. (2011a), Brun et al. (2011b) and Alonso and Garcimart´ın (2011). In general, they confirm, with the exception of Alonso and Garcimart´ın (2011), the premise that aid does improve tax effort in countries where institutions are good. In these countries, governments are more accountable vis--vis of their citizens and more prone to pursuit tax reforms rather than countries with poor institutions. In this context, aid inflows are more likely to be viewed as additional resources for achieving the country development objectives.
However, this last strand of studies examines the conditional aid-tax revenue nexus in different ways, which are sometimes questionable. Gupta et al. (2003) successively use two ways. They first include in the tax revenue equation the institutional variable (proxied by the ICRG corruption index). This obviously fails to test the interaction between institutions and aid. Then they construct sub-samples according to corruption levels. Their results indicate that the negative impact of grants is substantially am-plified in countries with weak institutions in comparison with the whole sample. But concessional loans though still having an offsetting effect become statistically insignif-icant in the most corrupt quartile. Benedek et al. (2012) follow the second approach
of Gupta et al. (2003) and come to similar conclusions, however with a strong negative impact for both loans and grants in the most corrupt countries.
Brun et al. (2011a) note that the sub-samples approach is limited for three rea-sons. First, the estimations by sub-samples do not allow testing the significance of the difference between the estimated coefficients through the regressions. It is then hard to confirm a stronger negative effect of grants in countries with weak institutions. Second, corruption is only a limited explanation. Third, the authors criticize the ad hoc/arbitrary choice of the threshold levels of the corruption index.
Brun et al. (2011a) then use the interactive term between corruption and aid vari-ables in the whole sample regression; and alternative institutional variable including the ICRG bureaucracy and democracy indexes. Only the quality of bureaucracy fuels a positive impact of aid on tax effort.
Alonso and Garcimart´ın (2011) and Brun et al. (2011b) follow the same approach. The formers use an index of income distribution as an institutional variable, but fail to find an impact on the aid-tax relationship, even controlling for institutional quality by ICRG indicators. On the opposite, the latter authors show that IMF programs are less efficient in Sub-Saharan Africa countries because of institutional inefficiency. But for the whole of sample, institutional quality proxied by the quality of bureaucracy favors positive impact of aid on tax mobilization. If their results seem to be stronger, the explanation given to the negative sign of the interaction between IMF programs and Sub-Saharan countries may be problematic. Indeed, it neglects the fact that institutions have improved in many of these countries through a long history of institutional and administrative reforms. The concern of alternative institutional indicators remains as the ICRG bureaucracy quality and democratic accountability indexes are very inertial over time.
In short, literature on aid-tax nexus is controversial. The mixed results are due to samples, specifications, methods used to control for the endogeneity of aid, as well as the quality of data (even if we dont stress on this issue, see Prichard et al. (2013) and Alonso and Garcimart´ın (2011) for more details). Beyond the seemingly wide agreement that quality of institutions plays a major role in explaining aid-tax nexus, research on this field is still opened. The discussion above shows that the issue is not as simple as it seems. The previous studies have used very large samples including countries that do not necessarily share the same monetary and fiscal policies. Admittedly, heterogeneity is sometimes controlled for by working with regional or income level dummies or with sub-samples. But even within these groups of countries, institutional frameworks may differ. The section below highlights this fact in the case of the WAEMU countries in spite they share identical rules for monetary and fiscal policies. Our task then stresses
that progressive efforts made by recipient governments in terms of their ability to carry out successfully their reforms may smoothly shift the sign and/or the magnitude of the impact of aid on tax.
3
Fiscal and institutional challenges and aid reliance in WAEMU
Since the 1980s, the eight WAEMU members have successively engaged in hard macroe-conomic reforms and the ”new” generation reforms. The hard reforms were developed in the frame of the Structural Adjustment Programs (SAPs) over the 1980s to the middle of 1990s. They aim at stabilizing macroeconomic imbalances and to counteract the recession under the auspices of the IMF and the World Bank. They essentially consist in resizing public services, cutting drastically public interventions in productive activities, liberalizing trade and stimulating the private sector.
The ”new” generation reforms have been implemented through the Millennium De-velopment Goals (MDGs) since the mid-1990s. They translate at the national level in the Poverty Reduction Strategy Paper (PRSP) in which the Government declares its development goals targets and the measures to attain them. These efforts receive the support of international community through notably the Heavily Indebted Poor Countries (HIPC) completed by the Multilateral Debt Relief Initiative (MDRI) in 2006 (Bank, 2011). All the member countries of the Union benefited from these debts relief initiatives. Cote d’Ivoire became the last recipient in 2012 after a decade of military and political instability.
The core message of the PRSP is to free up additional resources for poverty reduction and development programs. The program package encompasses institutional and deep economic reforms. The major reforms in WAEMU have been developed in the frame of fostering the process of regional integration. In 1994, the Union adopted convergence criteria targeting inflation, public debt and deficits. The major concern was then to prevent macroeconomic instabilities in a context of the CFA-franc devaluation and to generate sustainable economic growth. By now after the changes in 1999 and 2003, the Pact disentangles the criteria into key and secondary criteria. The key criteria are those whose violation leads to the formulation of corrective actions or even sanctions (Bamba, 2004). The secondary criteria are considered as indicative structural benchmarks to achieve internal and external balance. The failure to meet them however does not result in corrective measures but only recommendations1.
1The key criteria comprise: i) The Ratio of fiscal balance to nominal GDP (key criterion) should
be greater than or equal to 0% in 2002. Its non-compliance results in sanctions, except in exceptional circumstances such defined by Regulation No. 11/99/CM/UEMOA, Article 10; ii) The average annual rate of inflation should not exceed 3%; ii) The ratio of outstanding debt to nominal GDP should not
On the fiscal field, a regional harmonization programs in the tax and custom areas has been developed. VAT and Excises directives were introduced in 1998 with the main objective to gradually substitute domestic taxes for trade duties. In 2000 a customs union with a common external tariff was established. A Fiscal Transition Program was adopted in 2006 that extensively retook the goals of the VAT and excise directives. The aim is to achieve a tax burden of 17 percent of GDP with 10 percent derived from do-mestic revenues and 7 percent from import taxes (Mansour and Graziosi, 2013; Fossat and Bua, 2013). The external technical support in particular from the IMF-AFRITAC was engaged to improve tax administration capacities through strategy design, organi-zational and procedural reforms, IT as well as human capacity building, to strengthen transparency and integrity, fight corruption and fraud and increase tax compliance etc. In addition, in 2004 the financial support of the WAEMU’s central bank, the Central Bank of West African States (BCEAO), to national budgets was suppressed. In 2007, the BCEAO gained independence and reinforced its mission of fighting inflation.
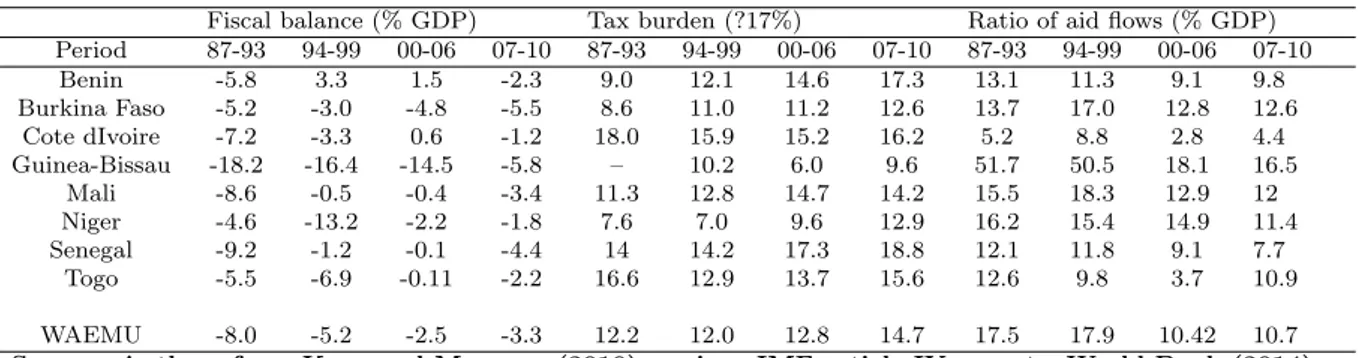
In short, the convergence Pact aims to ensure greater fiscal discipline in support of the common monetary policy in order to create favorable conditions for price stability and for strong sustainable growth. However, it leads to a certain number of challenges. First, the suppression of the seigniorage means that the member states are able to properly exploit a disposable fiscal space in support to the objective of 7% growth re-quired to curb substantially poverty in the Union. Unfortunately the Union’s economic growth although being positive has never reached this goal. Between 1994 and 2012, the per capita growth has been situated at about 1.4% against -1.3% over the period 1980-199(World Bank, 2014). Second, table 1 shows that a number of the eight mem-bers violate the convergence criteria. Only the criterion of the total debt to GDP ratio is met by all the members, thanks to HIPC debt reliefs.
Remarkably, the key criteria of fiscal balance and tax revenue are the most violated criteria, with the current account balance, despite tax reforms. It results in persistent public deficits and high dependency on aid as table 2 highlights.
Over the period 1987-2010, the fiscal balance is negative in all members with a few exceptions but with a general improvement after 1994. The average ratio decreases from -8% over the period 1987-1993 to -5.2% and -3.3% respectively over the periods 1994-1999 and 2007-2010. Aid inflows dramatically decrease while the tax rate increases slowly from 12% of GDP to 14.7%. Those slow improvements can be explained to exceed 70% by the year 2005;iv) current payment arrears should not be generated. There are also four second criteria: i) The tax burden should reach at least 17% of GDP. ii) The ratio of public wage bill to tax revenue should not exceed 35%;iii) The share of domestically-funded public investment should reach at least 20% of tax revenues iv) The ratio of the current account balance excluding grants to nominal GDP should be greater than or equal to 5%.
Table 1: WAEMU Number of Countries Violating Convergence Criteria, 2010–2013
2010 2011 2012 2013
First-order criteria
Basic fiscal balance/GDP (≥ 0% ) 3 6 5 5
Average consumer price inflation (≤ 3% ) 0 5 3 0
Total debt/GDP (≤ 70 percent) 0 1 0 0
Change in domestic arrears (≤ 0) 1 1 5 1
Change in external arrears (≤ 0) 0 2 1 0
Second-order criteria
Wages and salaries/tax revenue (≤ 35% ) 4 5 6 5
Capital spending dom. financed/tax revenue (≥ 20%) 4 2 1 3 External current acc. balance, excl. grants/GDP (≥ −5%) 6 6 5 7
Tax revenue/GDP (≥ 17%) 7 7 6 6
Source: IMF 2014
Table 2: Fiscal balances and aid’s reliance in WAEMU over the period 1987–2010
Fiscal balance (% GDP) Tax burden (?17%) Ratio of aid flows (% GDP) Period 87-93 94-99 00-06 07-10 87-93 94-99 00-06 07-10 87-93 94-99 00-06 07-10 Benin -5.8 3.3 1.5 -2.3 9.0 12.1 14.6 17.3 13.1 11.3 9.1 9.8 Burkina Faso -5.2 -3.0 -4.8 -5.5 8.6 11.0 11.2 12.6 13.7 17.0 12.8 12.6 Cote dIvoire -7.2 -3.3 0.6 -1.2 18.0 15.9 15.2 16.2 5.2 8.8 2.8 4.4 Guinea-Bissau -18.2 -16.4 -14.5 -5.8 – 10.2 6.0 9.6 51.7 50.5 18.1 16.5 Mali -8.6 -0.5 -0.4 -3.4 11.3 12.8 14.7 14.2 15.5 18.3 12.9 12 Niger -4.6 -13.2 -2.2 -1.8 7.6 7.0 9.6 12.9 16.2 15.4 14.9 11.4 Senegal -9.2 -1.2 -0.1 -4.4 14 14.2 17.3 18.8 12.1 11.8 9.1 7.7 Togo -5.5 -6.9 -0.11 -2.2 16.6 12.9 13.7 15.6 12.6 9.8 3.7 10.9 WAEMU -8.0 -5.2 -2.5 -3.3 12.2 12.0 12.8 14.7 17.5 17.9 10.42 10.7
Source: Authors from Keen and Mansour (2010), various IMF-article IV reports, World Bank (2014)
some extent by the various reforms undertaken at sub-national level and at the same time question the conditions of their efficiency. Indeed, the situation varies significantly among the member states. A closer look at the table 2 reveals that the higher the income level, the lower is aid dependency and the higher is tax revenue ratio. The apparent sensitivity of tax revenue to aid inflows also varies considerably. Mansour and Graziosi (2013) argue that the lack of credibility, due to the absence of a clear mechanism of sanctions in the WAEMU explains the gaps between ”de jure and de facto coordination” characterized by flexibility in base setting is induced by various directives, ongoing tax competition through special tax regimes. Heterogeneities among countries are also explained by the different changes in the GDP composition among members.
Inconsistency depends on the quality of institutions, in particular the ability of governments to lead successful reforms despite the pressure of interest groups, their ability to promote a safety environment, and gain popular support. When the risk of instability is low, a fiscal contract between government and citizens is more likely, aiming at decreasing the reliance on foreign assistance. But the fiscal contract might also enforce a mutual consensus to not tax for and maintain aid reliance.
and tax ratios in WAEMU over 1985-2010. The 1990s were marked by a low level of government stability when the SAPs have been implemented. In contrast, the reforms of 1994-1999, and the development of PSRPs documents involving a large participation of populations, have benefited from a continuous improvement in government stability. After the peak in 1999, the index of government stability trendily decreases until 2005 before a slight increase.
Figure 1: Foreign aid, tax ratios and government’s stability in WAEMU
4 6 8 10 score 5 10 15 20 percent of GDP 1985 1990 1995 2000 2005 2010 years
Tax collection Foreign aid
Government stability index
Source: Authors from WDI, Keen and Mansour (2010) database, various IMF-article IV reports and World Bank (2014) and PRSP(2013)
After 1996 where a marked improvement of government stability is noted, the tax to GDP ratio moved above the foreign aid ratio2.
In short, the main characteristics of the tax system in WAEMU do not change significantly because of a lack of credibility in enforcing the reforms maintaining tax exemptions, fraud and the presence of heterogeneities despite the support of interna-tional partners. The purpose of this paper is to test econometrically if there is a cutoff of government stability index beyond which aid inflows promote tax collections.
2The peak in foreign aid in 1994 is mainly due to the devaluation of local currency which inflates
4
Methodology and data
In this section, we expose the Panel Smooth Transition Regression (PSTR) and show how it contributes to better account for the role of institutional heterogeneity in aid-tax nexus in WAEMU. We assume that this institutional heterogeneity is related to gov-ernment stability as the latter determines the probability of occurrence of the necessary reforms and the quality of their implementation which in turn affect the impact of aid on tax revenues.
4.1
The Panel Smooth Transition Regression
The PSTR model was recently developed by Gonz´alez et al. (2005) and Fok et al. (2005). This model is a regime-switching model that allows for a small number of ex-treme regimes. It can be seen as a generalization of the Panel Threshold Regression (PTR hereafter) model proposed by Hansen (1999) in which coefficients of some ex-planatory variables are function of the value of another variable called the transition variable. In the PTR model, the modeled regime shift is sharp while in the PSTR the shift is modeled through a smooth transition function. The estimated coefficients are continuous functions of an observable variable through a bounded function of this variable (Gonz´alez et al., 2005). The PSTR model addresses both heterogeneity and time variability by allowing coefficients to vary smoothly with respect to country and time.
Our hypothesis is that the effects of aid variables differ according to the level of government stability which represents our variable of political stability. The govern-ment stability here is defined as the lower risk for governgovern-ment to not deviate from its declared programs and to not remove from office. This gathers three conditions. First, it involves that there is unity of the executive team and the cabinet around the govern-ment’s general policy goals. Second, the government can strongly lean on the legislative to implement its program. As a combination of the both conditions, the third condition states that government has the popular support. Obviously, this assumption is ques-tionable at certain points. In a context of too fragile institutions, having legislative and popular supports or keeping on declared projects is not a complete umbrella against military coups or a guarantee for good reforms. One might simply admit that keeping decidedly on its program and the respect of the three conditions are enough to provide a certain umbrella against instability all things being equal. A stable government should be thus seen as a good reformer able to convince its citizens about the relevance of its reforms. In a highly risky environment, a weak government is constantly under threat of being removed from office. Thus, it is tempted to develop some suboptimal strategies
to remain in office. Imagine that one way is to increase public spending. It has two pos-sibilities of funding: increasing tax or substituting aid for tax. As raising tax is costly compared to aid, it will deliberately delay the tax reforms. Several authors demonstrate other implications about the uncertainty of government survival. Alesina and Tabellini (1990), Edwards and Tabellini (1991) and Cukierman et al. (1992) emphasize that kind of governments renounce to implement good policies in order to worsen the state for their successors.
Moreover, Murphy et al. (1991) show that an uncertain and weak government is more prone to plead lobbyist and pressure groups, thus leading to a more direct effect of rent-seeking activities on policy decisions (Alesina et al., 1996). Another aspect of government instability concerns the staff in tax administrations. In general, changes in cabinet also lead to changes or assignments to other positions of tax managers in charge of tax reforms. The risk to be ousted may make them to be sensitive to rent-seeking in order to compensate the loss of their associate advantages in one hand. In other hand, the frequent turnover of tax managers and staff may complicate and make inefficient the discussions between the country and its international partners especially in terms of consistency and follow-up over time of the required reforms. Because of these evident economic inefficiencies, we assume that aid is more efficient in promoting tax performances at higher levels of government stability and less efficient at lower levels.
Hence, assuming that government stability would define different regimes character-ized by different effects from explanatory factor to tax–to–GDP, the basic PSTR model with two extreme regimes and a single transition function would be defined as:
taxit = µi+ β0′xit+ β1′xitg(stabit; γ; stab) + uit (1)
where ˙ı = 1, . . . , n represent countries and t = 1, . . . , T years. The variable tax is the ratio of tax revenue to GDP, the vector xit includes the ratio of foreign aid to GDP
and the other traditional factors of tax–to–gdp ratio.
β0 and β1 are two vectors of parameters to be estimated. µi and uit denote the
fixed individual effects and the errors, respectively. The errors are assumed to be ˙ı.˙ı.d.
stabit is the government stability index in country ˙ı and year t. The transition function
g(stabit; γ; stab) is a continuous function of the threshold variable so that the value of
stabit determines the value of g(stabit; γ; stab). Thus the effects of x on tax revenue for
country ˙ı at time t is given by:
∂taxit
∂xit
The transition function value is bounded between 0 and 1 defining the two extreme regimes: when it equals zero, the effects of x on tax revenue equals β0 and when it
equals one, the effects of x on (the x-elasticity of) tax revenue equals β0+ β1. Granger
and Ter¨asvirta (1993) and Gonz´alez et al. (2005) specify g as the following logistic function: g(stabit; γ; stab) = 1 + exp(−γ∏m ˙ȷ=1 (stabit− stab˙ȷ)) −1 (3)
where stab (stab = stab1, . . . , stabm)′ is an m-dimensional vector of location (threshold)
parameters and the estimated term γ measures the slope of the transition function. As we briefly noted, in comparison with the use of sub-sample and the use of a simple interaction term, the PSTR provides some advantages. It allows coefficients (in particular aid coefficient) to vary between countries and over time. Moreover, in PSTR model, there are as many values of the (aid) impact coefficient(s), lying between β0 and
β0 + β1 , as the number of country-year observations. This is why in the following we
interpret only the signs of β0 and β1 rather than their values.
Regarding the value of the slope γ, when it equals zero the transition function reduces to a constant and the model is the standard linear model with individual effects,
i.e. constant and homogeneous coefficients; if it tends towards infinity, the transition
function becomes an indicator function and the PSTR model in (1) reduces to the two-regime PTR model of Hansen (1999) in the case where m = 1, for instance. When
m ≻ 1 and γ tends to infinity, the number of regimes remains two but the function
switches between zero and one (Colletaz et al., 2006).
The control variables reflect the sector composition of the economy, the initial level of economic development, trade openness, macroeconomic policies as well as the quality of the institutional environment. Institutional quality improves tax collection (Brun et al., 2011b; Benedek et al., 2012). Agricultural and industrial values added as a percentage of GDP are used as proxy of economic structure. It states that a large share of agriculture in total output and employment, being largely a subsistence activity, lowers the possibility of a modern tax system based on personal income taxes and value added taxes (Tanzi and Zee, 2000). On the contrary, industrial sector is easier to tax (Clist and Morrissey, 2011). The correlation between tax revenues and real GDP per capita, is expected to be positive as economic development increases both the demand for public services and tax base.
Trade openness is proxied by the sum of exports and import as a percentage of GDP. Trade taxes are likely easier to be collected. According to Rodrik (1998) and Gupta (2007), trade openness calls for a greater role of public sector in providing social
insurance in more open economies subject to outer risks. But the opposite effect may come when countries are engaged in trade liberalization viatariff reduction (Benedek et al., 2012). Inflation, measured by the percent change in average consumer prices, is assumed to harm tax revenues since it affects negatively their real value following the so–called Oliveira-Tanzi effect. In addition, we construct a dummy variable to capture the major reforms engaged in the WAEMU zone since the devaluation in 1994. It takes 1 in 1994, 1998–2000, 2002 and 2006–2007 and 0 otherwise in line with the above overview of public and macroeconomic reforms. To allow additional robustness, we include the level of foreign debt to proxy the need to generate revenue to service the debt, and population growth to proxy the potential increase in the tax base. It is expected that the effects of control variables on tax improve at higher level of government stability.
4.2
Estimation and tests of specification
The estimation procedure consists in eliminating the individual effects µi by removing
country-specific means and applying nonlinear least squares to the transformed model. Gonz´alez et al. (2005) propose a testing procedure which declines in i) testing the lin-earity against the PSTR model (or testing homogeneity against the PSTR alternative), ii) determining the number, r, of transition functions, that means the number of ex-treme regimes which is equal to r + 1. The test of homogeneity in PSTR model can be done by testing: H0 : γ = 0 or H0 : β1 = 0. However under the null hypothesis,
the tests are non-standard as the PSTR model contains unidentified nuisance param-eters. This identification problem is circumvented by replacing g(stabit; γ; stab) by its
first-order Taylor expansion around γ = 0 and to test an equivalent hypothesis based on the auxiliary regression:
taxit = µi+ β ′∗ 0 xit+ β ′∗ 1 xitstabit+ ... + β ′∗ mxitstabmit + u m it (4)
Hence testing the linearity of aid-tax model against PSTR is equivalent to testing
Ho∗ : β1∗ = ... = βm∗ = 0 in equation(4). SSR0 being the panel sum of squared residuals
under H0, and SSR1, the panel sum of squared residuals with regimes, the
correspond-ing F-statistic is then defined by: LM F = (SSR0−SSR1)/mk
SSR0/(T N−N−mk) ∼ F (mk, T N − N − m(k + 1)); where k is the number of explanatory variables in the aid-tax function, T is the number of years and N the number of countries. The test of homogeneity is also a tool for determining sequentially the number of transitions in the model. Given a PSTR model, we test the null hypothesis that the model is linear at a predetermined signifi-cance level α. If it is rejected, a two-regime PSTR model is estimated. If the two-regime at turn is rejected a three-regime is estimated. The testing procedure continues until
the first acceptance of the null hypothesis of no remaining heterogeneity. At each step of the sequential procedure, the significance level must be reduced by a constant factor
0≺ τ ≺ 1 in order to avoid excessively large models.
Let’s us conclude this section by addressing the issue of a potential endogeneity bias. It is common to account for this issue by employing various instrumental technical tools and instruments even if the results are sensitive to the instruments sets (Clist and Morrissey, 2011). As such methods are not yet developed in a PSTR context, we simply lag the aid variable although some authors argue that non-linear models may mitigate endogeneity issues (Jude and Levieuge, 2013). Gonz´alez et al. (2005) used a similar approach.
4.3
Data
We use a panel dataset that covers six out of the eight countries of the WAEMU over the period 1986–2010 due to data availability (Cote d’Ivoire, Burkina Faso, Mali, Niger, Senegal and Togo excluding Benin and Guinea-Bissau). ICRG data on institutional quality are not available for Benin. The main reason of removing Guinea-Bissau is due to data accuracy and missing. Besides the data on quality of institutions, inflation and tax revenues, all other data are drawn from the World Development Indicators of the World Bank.
Tax revenue is the ratio of total tax excluding social contributions to GDP. Database on this variable is from the Tax Policy Division of Fiscal Affairs Department of the In-ternational Monetary Fund kindly provided by Keen and Mansour (2010) and Benedek et al. (2012). It is an extended and improved version of the dataset used in the paper of Keen and Mansour (2010). Foreign aid is measured as the total net official development assistance as percent of GDP like in most of the related empirical studies. Even though we focus mainly on this variable, we also decompose this variable into non-technical, technical grants and concessional loans to test robustness.
Institutional quality is measured through the International Country Risk Guide (ICRG) database. It provides information on various risk indicators grouped into three major categories of risk: political, financial and economic risks. It is compiled by Polit-ical Risk Services (PRSP) Group. The ICRG indicators are broadly used in empirPolit-ical studies to measure political risk and institutional quality. However, in contrast with studies which focus on a specific variable, we consider here the overall situation. The latter is a composite index which is the sum of all twelve major components of the political risk category ranging from 0 to 100 points. This index comprises: government stability, socioeconomic conditions, investment profile, internal conflict and external
conflict rated from 0 to 12 whilst corruption, military in politics, religious tensions, law and order, ethnic tensions and democratic accountability rated from 0 to 6 as well as bureaucracy quality rated from 0 to 4. The higher value of the component, the lower is the associate risk perceived. This variable is one period lagged to avoid potential en-dogeneity bias. Data on inflation are obtained from the IMF World Economic Outlook Database.
Since the individual dimension of our panel is smaller than the time dimension, we check for stationarity issue. we apply Im-Pesaran-Shin (IPS)and Fisher tests as our panel is not utterly balanced and because we assume that the panel is heterogeneous. The tests reveal that the alternative hypothesis of stationarity cannot be rejected for all the variables. The table of the main descriptive statistics in appendix exhibits disparities in the level of the variables across countries and time3 in particular in terms
of the stability of government, tax and aid variables. In addition, table 6 in appendix displays pairwise correlations between tax revenues, ODA and institutional quality for all the countries in the sample. It shows that total aid and its components are negatively associated with tax revenues, while institutional quality and government stability are positively correlated with tax.
5
Results
For comparison purposes, we begin by panel regressions including a simple interac-tive term between government stability and aid indicator following Brun et al. (2011a) among others. We use the Feasible Generalized Least Squares (FGLS) with common AR(1) and panel AR(1) as well as AREG(1)4 to correct the problem of
heteroskedas-ticity and autocorrelation. Table 8 in appendices reports all the corresponding results. When we consider the overall level of aid, the results indicate that aid exerts a negative effect on tax revenue but this effect is not statistically significant in all specifications. In contrast, the coefficient of the interactive term between aid and political stability is positive and statistically significant at 5% only in FGLS common AR(1) specifications.
Insert table 8: Interaction Government stability-aid and tax revenue, panel specifi-cations.
Regarding the control variables, our results are globally similar to those reported in the literature. Real GDP per capita, trade openness and inflation have the expected
3More details on within and between statistics could be provided upon request
signs. The effect of real GDP and trade openness is positively and statistically signif-icant whilst the effect of inflation is negative Ghura (1998). The effects of the quality of institutions, sector composition, reforms, foreign debt and of population growth are not statistically significant.
The model of aid composition shows that technical grants hinders tax revenues in the three specifications while the effect of non-technical grants is not statistically significant. Loans have a marginally positive effect. The interactive terms with the political stability variable present more mixed results, positive and significant with technical grants in one regression, negative with loans in one regression too.
Hence, through the linear interaction effect, we cannot thoroughly establish that government stability improves aid-tax relationship in the sample. Moreover, the sign and significance of some control variables are questionable. For example, its debat-able that quality of institutions and reforms do not improve collection as they increase. Likewise, the positive sign of trade openness may hide the effects of trade liberaliza-tion with the associate decline in tariffs. These doubts indicate that the simple panel with interaction terms is not a strong approach to test heterogeneities in aid-tax im-pact upon government stability level. Moreover we must also relax the hypothesis of homogeneous coefficients for the control variables in order to account fully for all the historical process of the reforms in the union.
Panel Threshold effect models
The first stage in PSTR application is to test the linearity hypothesis. The table 3 below reports the linearity test results of all the specifications. In order to check the robustness of the existence of the threshold effects, we provide five regressions with the lagged overall level of foreign aid as the variable of interest. The first regression model focuses on the main determinants proposed by the literature. The second regression in-cludes one period lagged foreign debt stock and the third regression population growth. The fourth regression deals with the issue of trade liberalization. Indeed, Clist and Morrissey (2011) argue that the distinction between imports and exports matters and find that both have opposite sign. The last regression carries only the major significant variables in the majority of the regressions in exception with the debt outstanding as we will see later that adding debt variable involves an increase in the estimated threshold level.
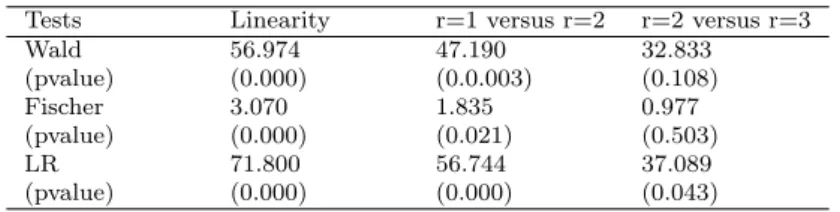
The three linearity tests strongly reject the null hypothesis of linearity of the rela-tionship between aid and tax conditionally to the level of government stability in the five regressions. However, the tests of no-remaining non-linearity cannot reject the null
Table 3: Tests of linearity and of no remaining non-linearity Model 1 2 3 4 5 Tests Linearity r=1 vs r=2 Linearity r=1 vs r=2 Linearity r=1 vs r=2 Linearity r=1 vs r=2 Linearity r=1 vs r=2 Wald 31.992 13.898 41.584 14.690 42.869 14.581 45.352 11.524 40.244 7.912 (pvalue) (0.000) (0.084) (0.000) ( 0.100) (0.000) (0.148) (0.000) (0.400) (0.000) (0.245) Fischer 4.609 1.532 5.764 1.410 5.372 1.226 5.251 0.838 8.449 1.168 (pvalue) (0.000) (0.153) (0.000) (0.192) (0.000) (0.282) (0.000) (0.602) (0.000) (0.328) LR 35.983 14.584 48.758 15.466 50.551 15.345 54.079 11.994 46.911 8.130 (pvalue) (0.000) (0.068) (0.000) (0.079) (0.000) (0.120) (0.000) (0.364) (0.000) (0.229) r=1 vs r=2: No remaining non-linearity with one threshold versus with at least two thresholds.LR is Likelihood Ratio
hypothesis of one regime against the alternative of at least two extreme regimes in all the cases. Then, the results suggest that transition is suitably featured by two regimes.
Insert table 9: Government stability and aid-tax relationship, PSTR results.
Table 9 presents the estimated parameters for the five specifications. The location parameters are stable through the regressions and close to the half of the maximum value of the threshold variable, between 5.5 and 5.9. This result means the countries in the sample do not need to highly perform in government stability to significantly shift the effects of foreign aid on tax revenues. This required relative low level can be explained by the prominent weakness of government stability index.
The graphs of the aid-coefficients of tax ratio against the government stability index are plotted in figure 2 in appendix for each regression. They show that increase in the threshold variable is smoothly associated with a positive link between aid and tax revenues from the inferior to the superior regimes. This result is strongly consistent across the specifications. In lower regimes, aid harms tax performances. In contrast, in upper regimes of the level of government stability, aid coefficient is positive and statistically significant. Our results go thus in line with the general premise that the quality of institutions matters for the effect of aid on tax. They are similar to the results of Gupta et al. (2003), Brun et al. (2011a), Brun et al. (2011b) and Benedek et al. (2012) even using different institutional quality indicators. A further analysis shows that the government stability is situated beyond this threshold in all the countries since the first years of MDG implementation suggesting that the joint efforts of national authorities and international community in combating the extreme poverty have been translated into more tax revenues. We carefully avoid interpreting the degree of the change in the estimated coefficients because between the two regimes there is a continuum of coefficients and at this stage only the interpretation of the signs of the parameters is plausible. We will go back to the computed estimates for each country and each year
in a later section.
For the variables of control, the PSTR results are more economically reasonable than those of the linear interactions. Indeed, the coefficient of institutional quality and the reforms become statistically significant in contrast with linear interaction regres-sions. Interestingly, they are negative in the lower regimes and positive in the upper regimes. At high levels of government stability, the institutional quality and the reform implementation promote tax efficiency while they impede tax efficiency at low levels. These results support the findings of Bird et al. (2008) indicating that better institu-tions (voice, accountability and control of corruption) improve tax efficiency. Therefore, countries must pursuit their efforts to keep the regional criteria and the frame of mul-tilateral surveillance in spite the difficulties they experience to meet them for a certain level of stability.
The role of sector composition presents mixed results. Agriculture sector tends to have no effect whatever the regime we consider while the negative effect of industry in low regime tends to be canceled in upper regime. If the major argument to the null effect of agriculture is the difficulty to tax this sector, the nuanced results of industrial sector is due to its low size on which the corporate tax is concentrated. The effect of trade openness is positive in the low regime but negative in the upper regime. The distinction of export and import shows that this effect is drawn from imports effect. The effect of exports is not statistically significant. This situation results from the liberalization program in the frame of regional integration.
However, the real per capita income presents an unexpected effect. At high levels of government stability, it hinders significantly tax revenues while it stimulates them at low levels. This ambiguous sign is however usual in the literature (Clist and Morrissey, 2011). A plausible explanation is that the positive changes in reforms are too recent so that they haven’t yet impulsed a very strong and high economic growth that improves substantially welfare and then contributes to high quality levels of services demanding more tax revenues. Population growth and inflation are not statistically significant in both regimes. The coefficient of foreign debt stock seems to be negative in the superior regime of government stability and non significant in the inferior one but this effect is not strong across the regressions, resulting from the various rearrangements of debt stock notably in the frame of HIPC initiative.
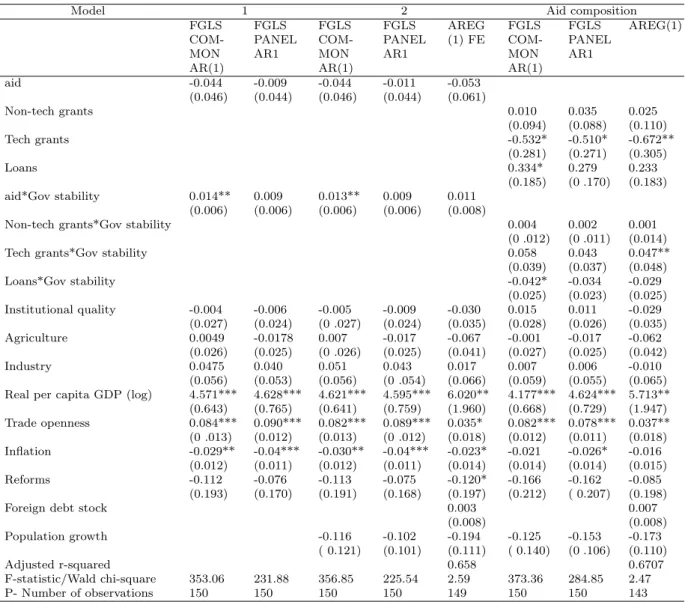
Does aid composition matter if government stability reaches some cutoff (s)?
The last regressions we conduct are related to aid composition. We wonder if the effects of different forms of aid on tax revenues vary according to government stability.
Our results demonstrate that the hypothesis of linearity is rejected. However, the tests of no remaining non linearity exhibit three regimes with two cutoffs as the table below reports.
Table 4: Tests of specification with distinctions of aid forms
Tests Linearity r=1 versus r=2 r=2 versus r=3
Wald 56.974 47.190 32.833 (pvalue) (0.000) (0.0.003) (0.108) Fischer 3.070 1.835 0.977 (pvalue) (0.000) (0.021) (0.503) LR 71.800 56.744 37.089 (pvalue) (0.000) (0.000) (0.043)
Source: Authors’ calculations
The slope parameters estimated reveal that the transition function is smooth in in-termediary regime from regime 0 to regime 1 and then abrupt from regime 1 to regime 2. Table 10 in appendices reports detailed results.
Insert table 10: Government stability, aid composition and tax collection, PSTR results.
The table provides more statistically nuanced results in comparison with those found in the case of the overall level of aid. Technical and non-technical grants are statisti-cally significant only in the third regime. In the latter, while the non-technical grants negatively affect countries tax performances at 5%, technical grants are positively asso-ciated with an increase in tax efficiency at 1%. For the effect of loans, it is characterized by a U-inverted trajectory from the regime 0 to regime 2. These results suggest that none form of aid is efficient when the quality of government stability is very low and that only loans should be provided in a context of democratic transition. On the other side, loans and non-technical grants are harmful to countries tax performances while only technical aid is beneficial when the stability of government shifts sharply.
The effects of the control variables behave in three senses. The first group of vari-ables composed of institutional quality, population growth and inflation statistically af-fects negatively the tax revenues in the low regime and positively in the upper regimes. The second group of variables composed of agriculture, industry, reforms and foreign debt presents a U-inverted effect across the regimes against a U–effect for real per capita GDP and trade openness.
Obviously, it is a challenge to give a clear interpretation of these last patterns of effects. This is one limitation to admit several regimes function. To circumvent this kind of interpretation difficulty, Colletaz et al. (2006) suggest restricting the number
of transitions to one or two. Whatever the difficulty to interpret some estimates our results evidence that the use of panel data to control the individual effects, in consid-ering common parameters, is not robust.
Estimated individual coefficients of foreign aid
The main advantage of using PSTR is to obtain coefficients for each country-year. It allows us to show the gradual sensitivity of tax revenues with respect to aid when government stability deviates from its threshold. Because of the relative stability of the parameters across regressions, we analyze the case with the most significant explana-tory variables (model 5 of table 6 in appendice). The limited number of countries in the sample allows us to exhibit the coefficient of aid for each country per year. The table 11 exhibits two main areas. The first one covers the period 1986–1995 and records bad per-formances. With the exception of Senegal which records only two negative coefficients of aid in 1993 and 1994, those of the five other countries are negative except for Cote d’Ivoire in 1992. After 1996 coefficients become positive for all countries and close to 0.087. These enhancements result probably from the joint efforts of the international community and countries through the establishment of PRSPs which involve a wide participation of populations and define clear social targets. They contribute to improve the orientation of aid, the confidence in governments in terms of services delivery and the promotion of a good environment for growth which in turn enhance tax collection. In general, aid has been effective in generating tax revenues. However, its effects are very low. In average, when the government stability increases, an increase of 1 point of aid to GDP ratio is associated with an increase of 0.015 point of tax to GDP ratio. Concerning the individual performances, the average estimated coefficient of aid ranges from -0.10% in Togo to 6.65% in Senegal. Except for Togo, the negative effects of aid in the first period have been offset by the positive effects of the second period. The average coefficient of aid 0.90% for Burkina Faso, 0.75% for Mali, 0.69% for Cote d’Ivoire and 0.05% for Niger.
6
Conclusion
This paper aims at assessing the threshold effects of foreign aid in tax collection condi-tionally to government stability for six West African Monetary Union Countries, since several studies show that government stability determines the quality of the developed reforms. Our results suggest that the relationship between foreign aid and tax revenues is nonlinear and depends on government stability. Beyond a critical level of government
stability, aid tends to have a positive impact on tax revenues. In addition, they indicate that heterogeneity across countries and time matters even if the countries share iden-tical policies. This finding is strong to various specifications including different control variables. We thus propose an estimation of the coefficients of aid on tax performances for each country at each year.
These results have strong policy implications for these countries and also for the economic literature on aid-tax relationship. First, they suggest that improving the stability of government and the quality of institutions in general matters to support the effectiveness of aid and the supply of public services. The results also highlight that it would be misleading to not deeply and thoroughly account for heterogeneities among countries and to suppose coefficient homogeneity even within sub-samples. Finally, the nuanced results when account for aid composition urges for further researches on this issue.
Bibliography
Alesina, A., S. ¨Ozler, N. Roubini, and P. Swagel (1996): “Political instability and economic growth,” Journal of Economic growth, 1, 189–211.
Alesina, A. and R. Perotti (1996): “Income distribution, political instability, and investment,” European Economic Review, 40, 1203–1228.
Alesina, A. and G. Tabellini (1990): “A positive theory of fiscal deficits and government debt,” The Review of Economic Studies, 57, 403–414.
Alonso, J. A. and C. Garcimart´ın (2011): “Does aid hinder tax efforts? More evidence,” Tech. rep., CREDIT Research Paper.
Azam, J.-P., S. Devarajan, and S. A. O’Connell (1999): “Aid dependence reconsidered. Washington, DC: World Bank,” Policy research working paper, 2144.
Bamba, L. (2004): “Analyse du Processus de Convergence Dans la Zone UEMOA,” Tech. rep., Research Paper, UNU-WIDER, United Nations University (UNU).
Bank, A. D. (2011): “Debt Relief Initiatives,” .
Benedek, D., E. Crivelli, S. Gupta, and P. S. Muthoora (2012): “Foreign Aid and Revenue: Still a Crowding Out Effect?” IMF Working Paper.
Bird, R. M., J. Martinez-Vazquez, and B. Torgler (2008): “Tax effort in developing countries and high income countries: The impact of corruption, voice and accountability,” Economic Analysis and Policy, 38, 55.
Br¨autigam, D. A. and S. Knack (2004): “Foreign Aid, Institutions, and Gover-nance in Sub-Saharan Africa,” Economic development and cultural change, 52, 255– 285.
Brun, J.-F., G. Chambas, and S. Guerineau (2011a): “Aide et mobilisation fiscale dans les pays en d´eveloppement,” Jumbo, Octobre 2007-21, 1–53.
Brun, J.-F., G. Chambas, and B. Laporte (2011b): “IMF programs and tax effort What role for institutions in Africa?” CERDI Etudes et Documents, 2010.33.
Carmignani, F. (2003): “Political instability, uncertainty and economics,” Journal of
Economic Surveys, 17, 1–54.
Clist, P. and O. Morrissey (2011): “Aid and tax revenue: signs of a positive effect since the 1980s,” Journal of International Development, 23, 165–180.
Colletaz, G., C. Hurlin, et al. (2006): “Threshold effects of the public capi-tal productivity: an international panel smooth transition approach,” Document de
recherche du Laboratoire d’Economie d’Orl´eans.
Cukierman, A., S. Edwards, and G. Tabellini (1992): “Seigniorage and Political Instability,” American Economic Review, 82, 537–55.
Dutta, N., P. T. Leeson, and C. R. Williamson (2013): “The Amplification Effect: Foreign Aid’s Impact on Political Institutions,” Kyklos, 66, 208–228.
Edwards, S. and G. Tabellini (1991): “Explaining fiscal policies and inflation in developing countries,” Journal of International Money and Finance, 10, S16–S48.
Fok, D., D. Van Dijk, and P. H. Franses (2005): “A multi-level panel STAR model for US manufacturing sectors,” Journal of Applied Econometrics, 20, 811–827.
Fossat, P. and M. Bua (2013): “Tax Administration Reform in the Francophone Countries of Sub-Sahara Africa,” Tech. rep., International Monetary Fund.
Ghura, M. D. (1998): Tax Revenue in Sub-Saharan Africa-Effects of Economic
Gonz´alez, A., T. Ter¨asvirta, and D. v. Dijk (2005): “Panel smooth transition regression models,” Tech. rep., SSE/EFI Working Paper Series in Economics and Finance.
Granger, C. W. and T. Ter¨asvirta (1993): “Modelling Non-Linear Economic Relationships,” Oxford University Press.
Gupta, A. S. (2007): “Determinants of Tax Revenue Efforts in Developing Countries,”
IMF Working Papers, 1–39.
Gupta, S., B. J. Clements, A. Pivovarsky, and E. R. Tiongson (2003): “For-eign Aid and Revenue Response Does the Composition of Aid Matter?” IMF Working
Paper.
Hansen, B. E. (1999): “Threshold effects in non-dynamic panels: Estimation, testing, and inference,” Journal of econometrics, 93, 345–368.
Jude, C. and G. Levieuge (2013): “Growth effect of FDI in developing economies: the role of institutional quality,” Document de recherche.
Keen, M. and M. Mansour (2010): “Revenue Mobilisation in Sub-Saharan Africa: Challenges from Globalisation I–Trade Reform,” Development Policy Review, 28, 553–571.
Knack, S. (2009): “Sovereign rents and quality of tax policy and administration,”
Journal of Comparative Economics, 37, 359–371.
Mansour, M. and G. R. Graziosi (2013): “Tax Coordination, Tax Competition, and Revenue Mobilization in the West African Economic and Monetary Union,”
Development, 81.
Morrissey, O., O. Islei, and D. M’Amanja (2006): “Aid loans versus aid grants: Are the effects different?” CREDIT Research Paper, 06/07.
Murphy, K. M., A. Shleifer, and R. W. Vishny (1991): “The Allocation of Talent: Implications for Growth,” The Quarterly Journal of Economics, 106, 503– 530.
Prichard, W., J.-F. Brun, and O. Morrissey (2013): “Donors, Aid and Taxation in Developing Countries–An Overview,” ICTD Research in Brief, 6.
Remmer, K. L. (2004): “Does foreign aid promote the expansion of government?”
Rodrik, D. (1998): “Why Do More Open Economies Have Bigger Governments?”
The Journal of Political Economy, 106, 997–1032.
Stotsky, J. and A. WoldeMariam (1997): “Tax Effort in Sub-Saharan Africa,”
IMF Working Paper.
Tanzi, V. and H. H. Zee (2000): “Tax policy for emerging markets: developing countries,” National tax journal, 299–322.
World Bank, G. (2014): World Development Indicators 2014, World Bank Publica-tions.
Wright, J. (2009): “How foreign aid can foster democratization in authoritarian regimes,” American Journal of Political Science, 53, 552–571.
A
Appendices
Table 5: Descriptive data
Variable Obs Mean Standard Deviation. Minimum Maximum
Tax 150 13.157 3.571 5.4 25.7 Gov stability 150 7.337 2.268 2.333 11 Aid 150 11.860 5.593 0.557 28.823 Non-tech grants 150 7.428 6.163 0.214 47.222 Tech grants 150 2.780 1.506 0.257 7.5 loans 150 2.872 2.000 -4.309 9.461 Institutional quality 150 54.109 7.769 36 66.833 Agriculture 150 33.200 9.140 13.383 52.845 Industry 150 20.705 3.050 14.179 27.549 Real GDP per capita 150 6.141 0.469 5.454 7.094
Exports 150 25.609 11.207 8.710 52.651 Trade 150 59.998 18.610 28.374 102.485 Imports 150 34.550 9.510 17.837 59.116 Inflation 150 3.219 6.746 -14.936 35.534 Foreign debt stock 149 84.074 42.043 18.201 230.723 population growth 150 3.026 0.739 0.932 9.882
Table 6: Pairwise correlations between tax revenues, ODA and institutions Tax Gov
sta-bility Inst. quality Aid Non-tech grants Tech grants Loans Tax 1.000 Gov stability 0.229* 1.000 Inst. quality 0.302* 0.481* 1.000 Aid -0.497* -0.315* -0.245* 1.000 Non-tech grants -0.160* 0.033 -0.012 0.488* 1.000 Tech grants -0.555* -0.353* -0.339* 0.754* 0.298* 1.000 Loans -0.275* -0.283* -0.191* 0.690* 0.167* 0.536* 1.000 Notes:*,**,***significant at 10%, 5% and 1%.
Table 7: Panel Unit root tests
Variables IPS FISHER
Tax -2.304*** 28.140*** Aid -2.434*** 35.775*** Non-tech grants -4.696*** 39.437*** Tech grants -2.297** -1.843** Loans -4.441*** 44.883*** Gov stability -1.985*** 28.760*** Institutional quality -1.312* 30.191*** Agriculture -2.097** 33.655*** Industry -2.627*** 28.751** Real per capita GDP (log) -2.402*** 38.445*** Trade openness -2.711*** 28.145*** Exports -2.396** 30.571*** Imports -3.560*** 24.628** Foreign debt stock -1.460* 23.184** Population growth -6.157*** 44.270***
Notes:*,**,***significant at 10%, 5% and 1%. Robust Standards errors in(.). t-bar are reported for IPS assuming that N and time are finite. Fisher tests correspond to ADF tests.The reported statistics are those of the inverse chi-squared but for Non-tech grants which statistic is the inverse normal statistic.