HAL Id: hal-01506678
https://hal.archives-ouvertes.fr/hal-01506678
Submitted on 12 Apr 2017
HAL is a multi-disciplinary open access
archive for the deposit and dissemination of
sci-entific research documents, whether they are
pub-lished or not. The documents may come from
teaching and research institutions in France or
abroad, or from public or private research centers.
L’archive ouverte pluridisciplinaire HAL, est
destinée au dépôt et à la diffusion de documents
scientifiques de niveau recherche, publiés ou non,
émanant des établissements d’enseignement et de
recherche français ou étrangers, des laboratoires
publics ou privés.
Trade-offs Between a Vertical Shared Display and Two
Desktops in a Collaborative Path-Finding Task
Arnaud Prouzeau, Anastasia Bezerianos, Olivier Chapuis
To cite this version:
Arnaud Prouzeau, Anastasia Bezerianos, Olivier Chapuis. Trade-offs Between a Vertical Shared
Dis-play and Two Desktops in a Collaborative Path-Finding Task. Proceedings of Graphics Interface 2017,
May 2017, Edmonton, Canada. �hal-01506678�
Trade-offs Between a Vertical Shared Display and Two Desktops
in a Collaborative Path-Finding Task
Arnaud Prouzeau∗ Anastasia Bezerianos† Olivier Chapuis‡
LRI, Univ. Paris-Sud, CNRS, Inria, Universit ´e Paris-Saclay, F-91405 Orsay, France
ABSTRACT
Large vertical displays are considered well adapted for collaboration, due to their display surface and the space in front of them that can accommodate multiple people. However, there are few studies that empirically support this assertion, and they do not quantitatively assess the differences of collaboration in front of a shared display compared to a non-shared setup, such as multiple desktops with a common view. In this paper, we compare a large shared vertical display with two desktops, when pairs of users learn to perform a path-planning task. Our results did not indicate a significant differ-ence in learning between the two setups, but found that participants adopted different task strategies. Moreover, while pairs were overall faster with the two desktops, quality was more consistent in the verti-cal shared display where pairs spent more time communicating, even though there is a-priori more implicit collaboration in this setup. Index Terms: H.5.2 [Information Interfaces and Presentation]: User Interfaces - Graphical user interfaces
1 INTRODUCTION
Large shared displays are often considered well suited for collab-oration. Their large size allows multiple users to interact simulta-neously [29], collaborators can easily define personal and shared territories [18], and can choose to work close or far from each other [45]. They facilitate face-to-face communication and deictic references [22], and provide awareness of actions of others [42].
Empirical studies support the idea that large displays foster col-laboration. Nevertheless, to our knowledge, no study quantitatively compares collaboration using a large vertical display, with a setup that doesn’t possess its characteristics, i.e., the large and shared surface. In this paper, we measure performance and coordination differences when pairs use a large display, compared to two desktops that share a common view. The large shared surface is an area of 2 × 1.5 meters (of a larger display, Fig. 1), a size that users can comfortably reach with limited physical movement. The two desk-tops are motivated by setups where collaborators use individual workstations (e.g., command and control centers), that are often distant and cannot support deictic communication, but allow for verbal communication (Fig. 1).
To quantitatively study collaboration, we chose an abstract and simple task, to better control task difficulty across setups, and to allow for multiple repetitions. Inspired by previous work on collabo-ration [16,41] we used a simplified path-finding task with constraints. We expected our pairs to develop collaboration strategies over mul-tiple trials, that likely differ across setups, eventually reducing the need for coordination and decision making that are essential in col-laboration [26]. As such, we did not provide any training to our participants, but rather compared the learning phase across settings,
∗e-mail: [email protected] †e-mail: [email protected] ‡e-mail: [email protected]
as this is where pairs need to communicate and coordinate to im-prove their strategy. Learning rate has been used in the past as a measure of coordination [9]. To study possible trade-offs between the setups, we also measured other metrics that could shed light to differences in collaboration, such as the amount of communication between pairs and their coordination strategies.
Results did not indicate a significant difference in learning be-tween setups, but pairs were generally faster using desktops. Nev-ertheless, the quality of the solution, defined as the number of cor-rections needed to reach an optimal solution that meets the imposed constraints, was more consistent with the large display, and pairs communicated and planned more ahead of time in this setup. With desktops, pairs divided the task as much as possible, requiring less communication, and affecting their quality of work.
2 RELATEDWORK
Several studies investigate the effect of display size on the perfor-mance of a single participant in different tasks. Tan et al. show that participants seated in front of a large screen perform better on a spatial orientation task [39]. Benefits of large screens are also identified by Czerwinski et al. [5] and Bi and Balakrishnan [2] in office work tasks, and by Reda et al. [34] in a data-analysis tasks.
When it comes to collaboration, there is a large body of work on Single-Display Groupware (SDG) [38]. Some describe how users collaborate with a horizontal [41] or a vertical [43–45] shared display, and strategies to manage conflicts [27]. Others compare interaction techniques, e.g., one vs. multiple mice [3], multi-touch vs. mice for tabletop [12, 15] or wall-sized displays [20], and their impact on users’ coordination [28] and collaboration [23, 32].
Multi-Display Groupware (MDG) [7] is also well-studied, with multiple displays being co-located or remote. An important aspect for MDG is workspace awareness [11, 31], with several techniques proposed to increase users’ mutual awareness, such as multi-cursors (used in our work), radar views [10], techniques to link common work [25], and arm embodiments for remote collaboration [6].
However, few studies compare SDG and MDG setups. Wallace et al. [46] compared a tabletop with personal tablets for a sensemaking task, and found that the shared surface supports better prioritiza-tion and data comparison, and leads to more participaprioritiza-tion equality. Inkpen et al. [16] studied the impact of the number of displays for a high-level subway trip planning task. Participants either shared one tabletop, or each had their own. They found that the work is more equally distributed with MDG, but users feel more efficient with SDG. Hawkey et al. compared two users on a large display, versus one user on a large display and one on a regular screen, in a trip planning task [13]. Participants felt that collaboration was more en-joyable and efficient with the large display, and that communication was more difficult on the MDG condition. Similarly to [16], they did not measure time differences between setups, but quality was better in the SDG. Finally, Wallace et al. [47] compared a large display (SDG), with a large display and three desktops (MDG) for a job shop scheduling task of [40]. Their results indicate that SDG provides more awareness of partners’ activities, but can lead to distraction. In MDG there is less distraction, but collaboration is more demanding. Overall, no performance difference was found.
This previous work comparing SDG and MDG shows that SDG provides more group awareness, the collaboration with it is more enjoyable and feels more efficient. The downside is that it could distract, and thus possibly impact performance. On the other hand, collaboration is more demanding on MDG due to difficulty in com-munication, but users are less distracted.
The previous work focuses mainly on subjective measures and on characterizing the nature of collaboration when participants perform high-level tasks. Results related to performance mainly refer to quality of results. We complement this work in two ways. First we compare two basic collaboration configurations, a shared large display vs. two desktops (a setup common in command and control centers [14, 33]) that to our knowledge has never been empirically compared. And second we study collaboration using an abstract simple task in order to measure fine phenomena, such as task perfor-mance, that for complex high-level tasks is difficult to assess.
As a shared display, we use 2 × 1.5m of a larger display wall, to ensure that its entirety is easily reached with little physical move-ment. Jakobsen and Hornbæk found that display size doesn’t impact performance for a map navigation task when targets are visible at all scales [17]. And later that there is little to no effect of physical movement in a classification task with similar input [19]. Neverthe-less, when physical navigation is possible, Ball et al. found it to be better than virtual navigation in data exploration tasks [1]. A similar finding was reported by Liu et al. on a manipulation task [24], but they showed that when no navigation is needed, desktops performed better. This indicates that the interplay of display size and physi-cal navigation is complex. In our work, we study the effect of a shared display on collaboration, and thus decided to use only part of larger display, reducing the navigation component, to ensure that any performance differences are not due to navigation.
3 EXPERIMENT
There is a lack of quantitative studies that attempt to objectively mea-sure differences in how pairs use a large vertical surface, compared to a setup of two desktops showing the same view, that does not have the main characteristics of large displays (large and shared surface) that are considered beneficial for collaboration. These two condi-tions represent the extrema of a continuum of possible co-located collaboration setups. We take a step in that direction.
We chose to use touch as input for the shared display, as it provides direct interaction and better group awareness, which are accepted benefits of this technology [20]. As these cues are not supported in desktops, we provided awareness of others through multiple cursors, where both cursors were visible on both desktops. Workstation layouts in control rooms can vary greatly, from one long line or semicircle of workstations, to several rows, and often operators cannot see each others’ screen [8, 14, 21, 35, 36]. In our desktop condition, participants were positioned such that they could not see each other’s screen, in order to represent a worst-case layout in terms of collaboration.
Task. For our quantitative study, we needed a task that is ab-stract and simple enough to allow us to control task difficulty across setups and multiple repetitions per setup. Additionally, we wanted to avoiding purely mechanical tasks, such as target selection, to ensure that it incorporated complex aspects of collaboration, like the need to coordinate and make decisions [26]. Inspired by previous work on studying collaboration [16, 41], we chose a task where participants had to perform a path-planning task under some constraints. In Inkpen et al. [16] participants planned a route in a subway map. In Tang et al. [41] pairs created bus routes that had to pass through specific locations and at the same time not overlap. This type of constrained path-planning is an abstraction of resource-routing and planning tasks common in real situations, such as traffic control centers [37]. For example, during accidents, traffic operators need to guide first responder teams to the location of the accident, and at
Figure 1: Setup of the experiment, with both conditions: large display, and two desktops with a common view (the large display was off in the two desktops condition and vice versa). The blue rectangle represents the effective area of interaction for all trials during the experiment. Left cut-out shows a close-up of a task, and right a possible solution.
the same time reroute regular traffic at the accident location. An ab-stracted path-planning tasks differs from the real one in that aspects of it are simplified (e.g., simple layout and no road context) to reduce effects due to complex layout (discussed next) and due to context knowledge. It also has specific constraints to encourage coordination (next). These characteristics ensure that the task can be performed by participants without domain knowledge, and the findings will be more generalizable as we limit possible effects caused by factors not related to collaboration.
We chose to focus on path-planning on an abstract graph instead of an existing road network graph. In a pilot we experimented with different graph layouts, but found that task difficulty varied depending on the layout, edge length and overlap of different edges in the graph. To ensure a common difficulty across tasks so as to measure learning, we settled on a grid, where all edges are similar in size and and do not overlap. The final graph was a grid of 10 rows by 20 columns (Fig. 1). To limit physical navigation as discussed in related work, the task was presented in a rectangle of 4 rows and 5 columns in the center of the graph. Possible solutions took up to 7 × 7, which corresponds to 2 × 1.5m (Fig. 1 blue rectangle).
Within this grid, each participant had to form a separate path between two ”end-nodes”, represented as brown squares (Fig. 1). To encourage pairs to coordinate and make decisions, we enforced constraints in their planning: (1) the two paths were required to cross at two specific nodes, one colored purple and the other orange; and (2) their paths could not cross anywhere else, and could not overlap (i.e, share an edge). Each participant was responsible for constructing one of the paths, differentiated by color (green/blue). In the large display, participants used either one or two fingers for input to differentiate between them. In the desktop condition they used mice, and shared a common view of the graph, with both mouse cursors (theirs, and their partner’s) always visible on the screen.
To ensure consistent difficulty across trials, the constraint nodes were always at a distance of 2 edges, and were next or across one of the two end-nodes. Their positioning was such that, in each trial, it was impossible for both participants to form the shortest path between the two end-nodes without crossing or overlap, thus neces-sitating negotiation and planning to find a good compromise (Fig. 1). We generated 6 tasks with these properties, and used them, and their mirrors (on the x and y axis) during the experiment. Three indepen-dent users went through all the generated trials beforehand and rated their difficulty, to verify we had consistent difficulty across trials. We experimented with harder tasks (e.g., one and three constraint nodes to cross), but we finally focused on a difficulty that required planning, but was not too hard to lead to a long experiment duration.
● ● ● ● ● ● ● ● ● ● 0 20 40 60 b1 b2 b3 b4 b6 Run Block Time (s) ● SD ● DT ● ● ● ● ● ● ● ● ● ● 0 1 2 3 4 b1 b2 b3 b4 b6 Run Block Unnecessar y Selection ● SD ● DT ● ● ● ● ● ● ● ● ● ● 0 10 20 30 b1 b2 b3 b4 b6 Run Block Con v ersation Time (s) ● SD ● DT ● ● ● ● ● ● ● ● ● ● 0 3 6 9 12 b1 b2 b3 b4 b6 Run Block First Selection (s) ● SD ● DT 2 4 6 8 SD DT Setup Ease of Collabor ation (a) (b) (c) (d) (e)
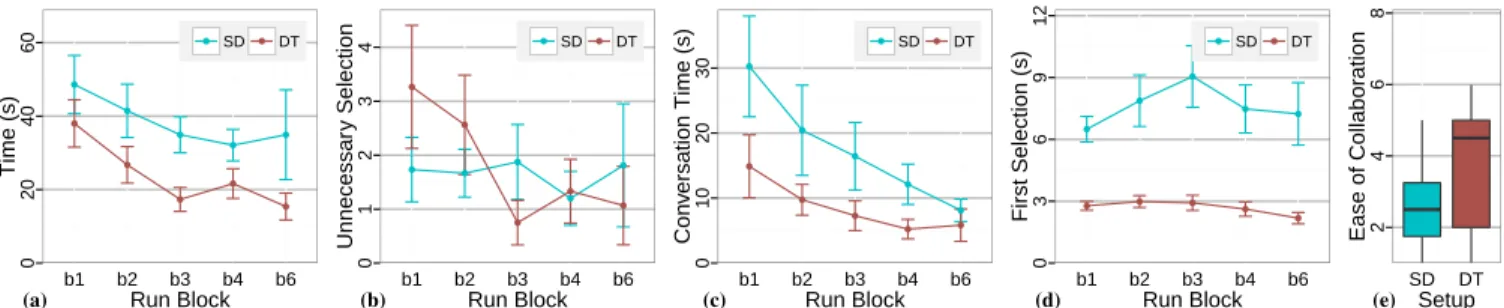
Figure 2: (a) Average task time (in seconds) by block for each SETUP, SharedDisplay (SD) and Desktops (DT). (b) Average unnecessary selection by block for each SETUP. (c) Average conversation time by block for each SETUP. (d) Average time before the first selection by block for each SETUP. (e) Boxplot for the ease of coordination by SETUP(1-8 likert scale, small is “better”). Error bars show the standard error.
Measures. Due to the abstract nature of the task, we expected pairs to spend a fair amount of time coordinating and planning in the first trials (learning phase). But after a number of trials, as they became more familiar with the task, we expected them to eventually converge to a strategy that would require little coordination and planning, as the task would become almost mechanical (convergence phase). We thus decided to not train our pairs, but rather to assess how they learn to perform the task on both setups. Previous work has also studied coordination in collaborative environments by assessing the learning curve of collaborating groups [9]. We expected the two phases would differ across setup: with the large display pairs would learn to coordinate and plan faster than with desktops, due to the implicit cues available in this setup. This is supported by previous findings showing that SDG provides more awareness of partner’s activities [47], and that collaborators have the feeling they are more efficient [13, 16]. Beyond learning time, we also report absolute time performance for each setup.
Task quality is measured as the number of unnecessary edge selection, which is the difference between the total number of all selections made by participants during the trial, and the minimum number of selections necessary to do the task. While we were inter-ested to see if the setup influences quality, this remains a secondary measure compared to learning.
Finally, we measured additional information that could help us assess the differences in collaboration between the two setups. As shared displays provide awareness and allow for deictic references, we expected differences in the amount of communication between the two setups, with large displays requiring less explicit communica-tion. Wallace et al. observed that collaboration was more demanding with MDG [47], and thus we expected that participants would talk more to counter this effect in the desktops condition. We also ex-pected that the divided nature of the desktops would lead to looser collaboration strategies than the large display.
Participants. We recruited 32 participants in pairs (7 females, 25 males), aged 21 to 41 (Median: 26), with corrected-to-normal vi-sion. They were computer science graduate students and researchers. Most (30/32) were familiar with touch interaction (31/32) had used a large display in the past. Almost all pairs (15/16) knew each other beforehand and we did not observe performance or communication differences in the pair that didn’t know each other.
Apparatus. Our large display was an interactive wall (5.9m×1.96 m) made of 75 LCD screens (21.6 inches, 3mm bezels each), with a resolution of 14400×4800 pixels, and driven by a ren-dering cluster of 10 computers. Multi-touch support was provided by a PQ labs1frame. The task took up 2 × 1.5 meters, which represents 4800 × 3600 pixels. See Fig. 1.
The 2 desktops had a 24.1 inch display, with a resolution of 1920 × 1200 pixels. They were positioned at 3.8m from each other. On each screen the task took up 30 × 23 cm.
1http://www.pqlabs.com
The experiment program was implemented using Java and the ZVTM Cluster toolkit [30], and ran on a master machine connected to the cluster and the desktops through 1 Gbit Ethernet. The operator controlled the sequence of the experiment using a smartphone which ran an android application implemented with the Smarties toolkit [4]. Procedure. The experiment was a between-subjects design with SETUP(SharedDisplay or Desktops) as the between-subjects factor. Participants performed 12 trials with a given SETUP. Overall, the experiment consisted of: 16 pairs × 12 trials = 192 trials and lasted 30 min on average.
Participants were first trained on how to select edges in the grid, without any task training. They were then given the task instructions and path constraint details and the experiment started. Their instruc-tions were to be as quick as possible and to not try to find the optimal (shortest) paths, however they were reminded that long paths take more time to select and thus increase experiment duration. At each trial, when pairs completed both paths in a way that respected the constraints, paths would change color. Paths that did not respect the constraints would turn red. During the trial, an experimenter mea-sured the conversation time using a toggle button on the smartphone, that was then verified with video coding. To ensure we captured all collaboration aspects during the trials, participants were asked to not communicate in any way between trials but were informed that they could talk as much as they wanted during the trials. No further instruction was given on how to communicate and plan their strategy. At the end of the experiment, participants filled a demographic and a post-study questionnaire, that prompted them to assess the ease of coordination of the setup using a 7-point Likert scale, and to describe the strategy they used in an open ended field.
3.1 Results
To minimize noise in our data, we averaged together trials in blocks of two. This means that the experiment is composed of 6 blocks (b1 - b6). However, when visually inspecting our data we observed a consistent time spike for both setups and all pairs in block b5 (w.r.t. the first block 1 where pairs see the task for the first time). Detailed video viewing identified that one trial in this block required users to make a compromise at the top left part of the graph, the usual position participants started from. Their strategies developed until then relied on making compromises later on in the trials, and thus failed them. As this particular task required new path strategies and affected both conditions, we decided to remove it from our analysis to satisfy our assumption of equal task difficulty.
We analyzed our data usingANOVAs with between factor SETUP, within factor BLOCK, and participants as a random factor. (The analysis including b5 led to very similar results.)
3.1.1 Time
Overall, participants were faster on the Desktops than on the Shared-Display(F1,14= 4.79, p = 0.05, see Fig. 2-(a)). In contrast, Wallace et al. [47] found no difference in performance between SDG and MDG,
a fact that can be explained by the nature of the task used in their study, that was longer and less controlled than ours. Our analysis also revealed a main effect of BLOCK(F5,70= 2.86, p = 0.02), confirm-ing that learnconfirm-ing took place and that our participants’ performance improved over time. We see that the learning phase continues until block 3 in both setups, and after that pair performance converges. However, contrary to our expectations, we found no interaction be-tween SETUPand BLOCK(F5,70= 0.40, p = 0.85), thus we were unable to measure a difference in learning phases between the two SETUPs. 3.1.2 Solution Quality
Quality is measured as the number of unnecessary edge selections made by participants. A strictly positive number can mean that either the final path is not the optimal solution or that participants made corrections, first selecting edges, and then unselecting them when they ran into a conflict with their partner. We found that in 97% of the trials, participants found the optimal path, so we consider that unnecessary edge selections are due to path correction. The number is stable with the SharedDisplay and of good quality (on average 1.66 touches per trial). The situation is different for Desktops, where unnecessary selections start at 3.27 for block 1 and consistently decrease, reaching 1.07 for block 6 (a result confirmed by an effect of BLOCKon DesktopsF4,28= 3.12, p = 0.03). See Fig. 2-(b). This indicates that quality in the SharedDisplay is stable and consistently good, even in situations where participants are unfamiliar with a task. This can be explained by the extensive coordination and planning performed by participants in this setup, discussed next.
3.1.3 Coordination and Planning
To further study collaboration differences, we first looked at the amount of verbal communication between setups. Contrary to our expectations that using the SharedDisplay would require less verbal communication, participants in fact talked more in this condition (F1,14= 6.90, p = 0.02, see Fig. 2-(c)). There is also an effect of BLOCK (F5,70= 3.72, p < 0.01), indicating that in both setups participant talked less as trials progressed (the interaction SETUP× BLOCK is not significant,p= 0.62).
Observing our pairs, we noticed that they took more time in the SharedDisplayto coordinate and plan their actions, compared to Desktops. We verified this by additionally analyzing the time for first interaction in the two setups. Indeed, participants took more time before interacting for the first time with the SharedDisplay than with the Desktops (F1,14= 10.89, p = 0.01, see Fig. 2-(d)). This additional planning time could explain the difference in quality observed before.
Differences in coordination and planning are also visible in both self-reported and observed strategies. On the SharedDisplay half of the groups reported using a strategy involving a-priori planning and close collaboration. Conversely, all groups on Desktops reported starting the task with little communication and planning. To verify these differences, an experimenter conducted video coding for all trials looking for planning phases. Results showed that planning was performed for 65% of trials with the large display, and for only 9% of trials with desktops. More specifically, during the first two blocks where pairs are still developing their strategy, in the SharedDisplay most pairs (4 in block 1 and 6 in block 2) performed extensive planning, and kept this strategy in the remaining blocks. Of the two pairs that didn’t have a planning phase, observations showed that 1 pair actually talked during the trial, gradually planning the path. The other applied a loose collaboration strategy, working mostly individually. With the Desktops, only one pair adopted a planning phase starting at block 2, likely due to coordination difficulties in this setup. This higher effort needed to collaborate in MDG was also observed by Wallace et al. [47] and can explain why our participants choose strategies that don’t need too much communication.
Regarding ease of collaboration, as it is reported by participants, there is a trend that it felt easier on the SharedDisplay (p= 0.08, see Fig. 2-(e)). This confirmed results by Inkpen et al. [16] and Hawkey et al. [13] that stated that participant felt collaboration more efficient with SDG. The most reported coordination issue with Desktops was the difficulty to communicate (6/16 participants), which often led them to start interacting without having formed a concrete plan. On the SharedDisplay, the most reported issue was physical conflicts with their partner in front of the display (5/16). Video coding allowed us to see that there were 35 physical conflicts and 54 position changes in the 80 SharedDisplay trials. This required extra coordination from our participants.
4 DISCUSSION ANDCONCLUSIONS
We conducted a quantitative study to assess collaboration differences when using a large shared display, compared to two desktops sharing the same view, in a sequence of path-planning tasks. We measured no difference in how fast pairs learn to perform the new task across setups. Nevertheless, with the large display, pairs adopted strategies that included more planning and coordination, which led them from the beginning to consistent, good quality results. It seems that when participants are faced with a new task, they do not adapt more quickly using the large display, but they can produce better results from the start. This observation may have important implications in situations like crisis management, and command and control centers, where collaboration on large displays could provide better quality solutions in unexpected crisis events.
However, on average, pairs took less time to solve the task with the desktops than with the large shared display. This finding is partially explained by the large amount of verbal communication when using the large display (even if this communication decreases as pairs become more accustomed to the task). This is surprising as shared displays provide more implicit ways to communicate and awareness of other’s action, compared to the desktops were cursor movements and voice are the main communication channels. Due to these reduced communication channels, with desktops pairs often adopted loose collaboration strategies, that were nonetheless faster, with one participant making choices quickly for their path and the other working a solution around them. It would be interesting to see if these strategies change when more communication channels, such as video arms or viewports of one’s partener, are available. On the other hand, participants using the large display planed with their partner ahead of time, before committing to actions on the display, a difference seen in the time spent before the first interaction. With the shared display participants were reluctant to start interacting before they had come to full agreement with their partner.
The adopted strategy and participant comments indicate that the large display eased communication and coordination, even if it was slower. This delay is in part due to planning discussions, but also due to the need for pairs to move around each other and avoid physical conflict while using the shared surface, a fact that likely encouraged tighter coordination. In the future, we plan to investigate if similar planning discussions occur in intermediate situations, such as around smaller shared displays, e.g., a common desktop.
In our experiment, we studied a single task and attempted to maintain a similar task difficulty, as we studied learning. In the future we plan to verify if our findings hold for other tasks, and to vary task difficulty to see if it has an impact on the strategy used, as we expect loose collaboration will be more error prone. Finally, we have adopted a task that explicitly limits physical navigation. As larger displays have been known to be more efficient in such tasks, it is possible that by adding navigational components large displays may also prove faster, a topic we plan to investigate further.
REFERENCES
[1] R. Ball, C. North, and D. A. Bowman. Move to improve: Promoting physical navigation to increase user performance with large displays. CHI ’07, 191–200. ACM, 2007. doi: 10.1145/1240624.1240656 [2] X. Bi and R. Balakrishnan. Comparing usage of a large high-resolution
display to single or dual desktop displays for daily work. CHI ’09, 1005–1014. ACM, 2009. doi: 10.1145/1518701.1518855
[3] J. P. Birnholtz, T. Grossman, C. Mak, and R. Balakrishnan. An ex-ploratory study of input configuration and group process in a negotia-tion task using a large display. CHI ’07, 91–100. ACM, 2007. doi: 10. 1145/1240624.1240638
[4] O. Chapuis, A. Bezerianos, and S. Frantzeskakis. Smarties: An input system for wall display development. CHI ’14, 2763–2772. ACM, 2014. doi: 10.1145/2556288.2556956
[5] M. Czerwinski, G. Smith, T. Regan, B. Meyers, G. Robertson, and G. Starkweather. Toward characterizing the productivity benefits of very large displays. INTERACT ’03, 9–16. IOS, 2003.
[6] A. Doucette, C. Gutwin, R. L. Mandryk, M. Nacenta, and S. Sharma. Sometimes when we touch: How arm embodiments change reaching and collaboration on digital tables. CSCW ’13, 193–202. ACM, 2013. doi: 10.1145/2441776.2441799
[7] P. Dourish and V. Bellotti. Awareness and coordination in shared workspaces. CSCW ’92, 107–114. ACM, 1992. doi: 10.1145/143457. 143468
[8] G. Filippi and J. Theureau. Analyzing cooperative work in an urban traffic control room for the design of a coordination support system. ECSCW ’93, 171–186. Springer, 1993. doi: 10.1007/978-94-011-2094 -4 12
[9] S. J. Guastello and D. D. Guastello. Origins of coordination and team effectiveness: A perspective from game theory and nonlinear dynamics. J. Appl. Psychol, 83(3):423–437, 1998. doi: 10.1037/0021-9010.83.3. 423
[10] C. Gutwin and S. Greenberg. Design for individuals, design for groups: Tradeoffs between power and workspace awareness. CSCW ’98, 207– 216. ACM, 1998. doi: 10.1145/289444.289495
[11] C. Gutwin and S. Greenberg. A descriptive framework of workspace awareness for real-time groupware. JCSCW, 11(3):411–446, Nov. 2002. doi: 10.1023/A:1021271517844
[12] T. E. Hansen and J. P. Hourcade. Comparing multi-touch tabletops and multi-mouse single-display groupware setups. MexIHC ’10, 36–43. UPSLP, 2010.
[13] K. Hawkey, M. Kellar, D. Reilly, T. Whalen, and K. M. Inkpen. The proximity factor: Impact of distance on co-located collaboration. GROUP ’05, 31–40. ACM, 2005. doi: 10.1145/1099203.1099209 [14] C. Heath and P. Luff. Collaboration and control: Crisis management
and multimedia technology in london underground line control rooms. JCSCW, 1(1):69–94, 1992. doi: 10.1007/BF00752451
[15] E. Hornecker, P. Marshall, N. S. Dalton, and Y. Rogers. Collaboration and interference: Awareness with mice or touch input. CSCW ’08, 167–176. ACM, 2008. doi: 10.1145/1460563.1460589
[16] K. Inkpen, K. Hawkey, M. Kellar, R. M, K. Parker, D. Reilly, S. Scott, and T. Whalen. Exploring display factors that influence co-located collaboration: angle, size, number, and user arrangement. HCII ’05, 10 pages. Erlbaum, 2005.
[17] M. R. Jakobsen and K. Hornbæk. Interactive visualizations on large and small displays: The interrelation of display size, information space, and scale. IEEE TVCG, 19(12):2336–2345, 2013. doi: 10.1109/TVCG .2013.170
[18] M. R. Jakobsen and K. Hornbæk. Up close and personal: Collabora-tive work on a high-resolution multitouch wall display. ACM ToCHI, 21(2):11:1–11:34, Feb. 2014. doi: 10.1145/2576099
[19] M. R. Jakobsen and K. Hornbæk. Is moving improving?: Some effects of locomotion in wall-display interaction. CHI ’15, 4169–4178. ACM, 2015. doi: 10.1145/2702123.2702312
[20] M. R. Jakobsen and K. Hornbæk. Negotiating for space?: Collaborative work using a wall display with mouse and touch input. CHI ’16, 2050– 2061. ACM, 2016. doi: 10.1145/2858036.2858158
[21] J.-P. Labarthe and C. D. l. Garza. The human factors evaluation program of a control room: The French EPR approach. Hum. Factors Ergon. Manuf., 21(4):331–349, 2011. doi: 10.1002/hfm.20227
[22] C. Liu, O. Chapuis, M. Beaudouin-Lafon, and E. Lecolinet. Shared interaction on a wall-sized display in a data manipulation task. CHI ’16, 2075–2086. ACM, 2016. doi: 10.1145/2858036.2858039 [23] C. Liu, O. Chapuis, M. Beaudouin-Lafon, and E. Lecolinet. CoReach:
Cooperative gestures for data manipulation on wall-sized displays. CHI ’17, to appear. ACM, 2017. doi: 10.1145/3025453.3025594
[24] C. Liu, O. Chapuis, M. Beaudouin-Lafon, E. Lecolinet, and W. E. Mackay. Effects of display size and navigation type on a classifica-tion task. CHI ’14, 4147–4156. ACM, 2014. doi: 10.1145/2556288. 2557020
[25] N. Mahyar and M. Tory. Supporting communication and coordination in collaborative sensemaking. IEEE TVCG, 20(12):1633–1642, 2014. doi: 10.1109/TVCG.2014.2346573
[26] J. E. McGrath. Groups: Interaction and Performance, vol. 14. Prentice-Hall Englewood Cliffs, Upper Saddle River, NJ, USA, 1984. [27] M. R. Morris, K. Ryall, C. Shen, C. Forlines, and F. Vernier. Beyond
”social protocols”: Multi-user coordination policies for co-located groupware. CSCW ’04, 262–265. ACM, 2004. doi: 10.1145/1031607. 1031648
[28] M. A. Nacenta, D. Pinelle, D. Stuckel, and C. Gutwin. The effects of interaction technique on coordination in tabletop groupware. GI ’07, 191–198. ACM, 2007. doi: 10.1145/1268517.1268550
[29] P. Peltonen, E. Kurvinen, A. Salovaara, G. Jacucci, T. Ilmonen, J. Evans, A. Oulasvirta, and P. Saarikko. It’s mine, don’t touch!: Interactions at a large multi-touch display in a city centre. CHI ’08, 1285–1294. ACM, 2008. doi: 10.1145/1357054.1357255
[30] E. Pietriga, S. Huot, M. Nancel, and R. Primet. Rapid development of user interfaces on cluster-driven wall displays with jBricks. EICS ’11, 185–190. ACM, 2011. doi: 10.1145/1996461.1996518
[31] D. Pinelle, C. Gutwin, and S. Greenberg. Task analysis for groupware usability evaluation: Modeling shared-workspace tasks with the me-chanics of collaboration. ACM ToCHI, 10(4):281–311, Dec. 2003. doi: 10.1145/966930.966932
[32] A. Prouzeau, A. Bezerianos, and O. Chapuis. Evaluating multi-user selection for exploring graph topology on wall-displays. IEEE TVCG, In Prescreening:14 pages, 2016. doi: 10.1109/TVCG.2016.2592906 [33] A. Prouzeau, A. Bezerianos, and O. Chapuis. Towards road traffic
management with forecasting on wall displays. ISS ’16, 119–128. ACM, 2016. doi: 10.1145/2992154.2992158
[34] K. Reda, A. E. Johnson, M. E. Papka, and J. Leigh. Effects of display size and resolution on user behavior and insight acquisition in visual exploration. CHI ’15, 2759–2768. ACM, 2015. doi: 10.1145/2702123. 2702406
[35] P. Smith, A. Blandford, and J. Back. Questioning, exploring, narrating and playing in the control room to maintain system safety. Cogn. Technol. Work, 11(4):279–291, Oct. 2009. doi: 10.1007/s10111-008 -0116-1
[36] S. Starke, N. Cooke, A. Howes, N. Morar, and C. Baber. Visual sam-pling in a road traffic management control room task. In International Conference on Ergonomics & Human Factors, 503–511. Taylor & Francis, 2015.
[37] J. Steenbruggen, M. Kusters, and G. Broekhuizen. Best practice in eu-ropean traffic incident management. Procedia - Social and Behavioral Sciences, 48:297 – 310, 2012. doi: 10.1016/j.sbspro.2012.06.1010 [38] J. Stewart, B. B. Bederson, and A. Druin. Single display groupware: A
model for co-present collaboration. CHI ’99, 286–293. ACM, 1999. doi: 10.1145/302979.303064
[39] D. Tan, D. Gergle, P. Scupelli, and R. Pausch. With similar visual angles, larger displays improve spatial performance. CHI ’03, 217–224. ACM, 2003. doi: 10.1145/642611.642650
[40] D. S. Tan, D. Gergle, R. Mandryk, K. Inkpen, M. Kellar, K. Hawkey, and M. Czerwinski. Using job-shop scheduling tasks for evaluating collocated collaboration. Personal Ubiquitous Comput., 12(3):255–267, Jan. 2008. doi: 10.1007/s00779-007-0154-3
[41] A. Tang, M. Tory, B. Po, P. Neumann, and S. Carpendale. Collaborative coupling over tabletop displays. CHI ’06, 1181–1190. ACM, 2006. doi: 10.1145/1124772.1124950
[42] J. C. Tang. Findings from observational studies of collaborative work. Int. J. Man-Mach. Stud., 34(2):143–160, Feb. 1991. doi: 10.1016/0020 -7373(91)90039-A
[43] K. Vogt, L. Bradel, C. Andrews, C. North, A. Endert, and D. Hutch-ings. Co-located collaborative sensemaking on a large high-resolution display with multiple input devices. INTERACT’11, 589–604. Springer-Verlag, 2011. doi: 10.1007/978-3-642-23771-3 44
[44] U. von Zadow, D. B¨osel, D. D. Dam, A. Lehmann, P. Reipschl¨ager, and R. Dachselt. Miners: Communication and awareness in collaborative gaming at an interactive display wall. ISS ’16, 235–240. ACM, 2016. doi: 10.1145/2992154.2992174
[45] J. R. Wallace, N. Iskander, and E. Lank. Creating your bubble: Personal space on and around large public displays. CHI ’16, 2087–2092. ACM,
2016. doi: 10.1145/2858036.2858118
[46] J. R. Wallace, S. D. Scott, and C. G. MacGregor. Collaborative sense-making on a digital tabletop and personal tablets: Prioritization, com-parisons, and tableaux. CHI ’13, 3345–3354. ACM, 2013. doi: 10. 1145/2470654.2466458
[47] J. R. Wallace, S. D. Scott, T. Stutz, T. Enns, and K. Inkpen. Investi-gating teamwork and taskwork in single- and multi-display groupware systems. Personal Ubiquitous Comput., 13(8):569–581, Nov. 2009. doi: 10.1007/s00779-009-0241-8