HAL Id: tel-01674240
https://tel.archives-ouvertes.fr/tel-01674240v2
Submitted on 2 Jan 2018HAL is a multi-disciplinary open access
archive for the deposit and dissemination of sci-entific research documents, whether they are pub-lished or not. The documents may come from teaching and research institutions in France or abroad, or from public or private research centers.
L’archive ouverte pluridisciplinaire HAL, est destinée au dépôt et à la diffusion de documents scientifiques de niveau recherche, publiés ou non, émanant des établissements d’enseignement et de recherche français ou étrangers, des laboratoires publics ou privés.
removal for nano-waste incineration conditions
Rachid Boudhan
To cite this version:
Rachid Boudhan. Performance of pulse-jet bag filter regarding particle removal for nano-waste in-cineration conditions. Chemical and Process Engineering. Ecole nationale supérieure Mines-Télécom Atlantique, 2017. English. �NNT : 2017IMTA0022�. �tel-01674240v2�
Rachid BOUDHAN
Mémoire présenté en vue de l’obtention dugrade de Docteur de L'Ecole nationale supérieure Mines-Télécom Atlantique Bretagne-Pays de la Loire - IMT Atlantique
sous le sceau de l’Université Bretagne Loire
et du grade de Docteur de l’Université Mohammed V de Rabat
École doctorale : SPIGA
Discipline : Génie des Procédés
Spécialité : Environnement
Unité de recherche : GEPEA UMR CNRS 6144
Soutenue le 05/07/2017
Thèse N° : 2017IMTA0022
Performance of pulse-jet bag filter regarding
particle removal for nano-waste incineration
conditions
JURY
Rapporteurs : Dominique THOMAS, Professeur, Université de Lorraine Gwenaëlle TROUVE, Professeur, Université de Haute Alsace
Examinateurs : Ahmed MZERD, Professeur, Université Mohammed V, Rabat Benoit SAGOT, Enseignant-chercheur, ESTACA
Esperanza PERDRIX, Maitre-assistante, IMT Lille Douai
Invité(s) : Danielle VENDITTI, Docteur, TREDI R&D-Séché Global Solutions
Directeur de Thèse : Laurence LE COQ, Professeur, IMT Atlantique
Co-directeur de Thèse : Kamal GUERAOUI, Professeur, Université Mohammed V, Rabat
Co-encadrant : Aurélie JOUBERT, Maître-assistante, IMT Atlantique
I would like to express my deepest gratitude to my advisor Pr. Laurence LE COQ for the immeasurable amount of support and guidance during my PhD studies. Pr. Laurence’s insights into and patient endurance throughout this project have been a true blessing. She enabled me to develop and broaden my knowledge in this field. My sincere appreciation is extended to Dr. Aurélie JOUBERT for her invaluable support, encouragement and advice. She provided a scientific and technical guidance and inspiration during this research. My deepest thank for Pr. Kamal GUERAOUI for his advices and continued encouragement during this doctoral dissertation.
I would like to thank Pr. Dominique THOMAS, and Pr. Gwenaëlle TROUVE, for all their time and effort in serving on the committee as thesis referees of my manuscript. I am also indebted to Dr. Ahmed MZERD, Dr. Benoit SAGOT, and Dr. Esperanza PERDRIX, for having agreed to be inspector of my thesis.
Special recognition is given to Dr. Sylvain DURECU and Dr. Danielle VENDITTI, representative of TREDI company, for financial support and for help and valuable discussions on the research project. Thank's to Dr. Danielle VENDITTI, the invited member in my thesis defense.
I would like to acknowledge the program Partenariat Hubert Curien (PHC) « TOUBKAL» for the financial support of my thesis in France.
All the experimental work could not have been done without the invaluable help of the technical team. I am grateful to Yvan GOURIOU for the realization of the experimental devices described in the thesis (experimental setup, filter prototype, sampling probes, etc.) and for his technical advice. I would also like to thank Jérôme MARTIN and François-Xavier BLANCHET for the realization of the computer programs and the installation of electrical devices. I thank Eric CHEVREL, Katell CHAILLOU, and Patrick BRION for their valuable help during my laboratory experiments. I am grateful the all staff of Energy Systems and Environment Department (DSEE) of IMT Atlantique. My special thanks for Dominique BRIAND, DSEE administrative assistant, for her efficiency and help.
These 3 years of thesis were particularly pleasant thanks to the other PhD students and post-doctoral. So I thank Maxime, Thibault, Safaa, Mouna, Kevin, Elias, Nadine, Djihad, Agustina, Manal, Mexitli, Francis, Zhewei, Guillaume, Aurelian, Henrietta, and Jenny.
Many thanks to my friends and especially Chantal, Mouheb, Victor and Zola, for making my stay very interesting and eventful.
Finally I am truly appreciative to my family for their moral support, without their encouragement, I would not have a chance to be at IMT Atlantique.
1
Résumé
Il n’existe à ce jour aucune réglementation française ou européenne sur la gestion des nanomatériaux manufacturés, que ce soit au niveau de la fabrication, de l'usage ou de la fin de vie. De tels produits ou nano-déchets peuvent se retrouver en unités d'incinération de déchets ménagers et assimilés. Des études (projet ADEME CORTEA NanoFlueGas No. 1181C0088 : Le Bihan et al. 2014 ; Ounoughene et al. 2015 ; Walser et al. 2012) ont montré la présence dans les fumées en sortie de chambre primaire, des nanoparticules originelles, seules, ou sous forme d’agrégats, lors de l’incinération de nano-déchets en conditions mimant les filières classiques d’incinération. Or, les nanoparticules sont responsables de problèmes sanitaires et environnementaux. En effet, des études toxicologiques démontrent clairement que leur très petite taille est un élément clé au niveau de la toxicité, en particulier les particules non ou peu solubles (Ostiguy et al. 2006). C’est pourquoi une attention particulière est portée sur le traitement des fumées d’incinération, en particulier sur l’efficacité des procédés dédiés à l’abattement des particules.
La technologie étudiée dans ce travail de thèse est la filtration par des filtres à manches, une technique simple et efficace pour la capture des particules et l’un des procédés de séparation les plus utilisés dans l’industrie (Le Coq, 2006).
Les travaux présentés dans ce rapport ont été réalisé dans le cadre d’une thèse en cotutelle entre IMT Atlantique et l'Université Mohammed V- Faculté des sciences, co-financée par le programme Hubert Curien TOUBKAL (campus France + CNRST) et TREDI – Groupe Séché.
L’objectif de ce projet est de quantifier les performances de filtration d’un filtre à manche à l’échelle du laboratoire lors de cycles de colmatage/décolmatage vis-à-vis d’un aérosol représentatif de celui émis par l’incinération de nano-déchets. Les applications visées sont les émissions de particules issues de l’incinération des déchets ménagers et/ou industriels et en particulier des déchets contenant des nanomatériaux. Le projet se propose d’étudier expérimentalement l’influence des paramètres opératoires tels que l’humidité et la température du gaz, la vitesse de filtration, et la nature des particules sur les performances de filtration d’un filtre à manche. Ainsi, des campagnes expérimentales sur une unité pilote de filtration sont complétées par des simulations numériques de transport des particules.
Afin de satisfaire aux conditions réalistes de fonctionnement rencontrées dans les lignes de traitement des fumées, le filtre à manche opère dans des gammes de température autour de 150°C, de teneur en eau de 10 -12%, et de vitesse de filtration autour de 1,9 cm.s-1. Les
2
particules co-injectées sont des réactifs (charbon actif et bicarbonate de sodium) ainsi que des particules représentatives de celles issues de l’incinération de nano-déchets contenant des nanomatériaux (projet ADEME CORTEA NanoFlueGas No. 1181C0088 : Le Bihan et al. 2014). Les performances de filtration sont évaluées en termes d’évolutions de l’efficacité de collecte des particules et des pertes de charge du filtre à manche au cours des cycles colmatage/décolmatage.
Une étude bibliographique présentée dans le chapitre I, porte sur le traitement des fumées d’incinération, et présente notamment le procédé de traitement par filtre à manches. Ce chapitre présente également les caractéristiques structurales des médias fibreux, la distribution des tailles des aérosols ainsi que les forces agissant sur les particules dans un écoulement de gaz conduisant au dépôt et à la capture des particules dans un média fibreux.
Ce chapitre aborde également les performances des médias fibreux en fonction du temps en termes d’évolution de la perte de charge et de l'efficacité de filtration. La théorie de la filtration distingue deux étapes dans l'évolution des performances du filtre. Dans la première étape, la collecte des particules se produit à la surface des fibres constituant le média fibreux grâce aux mécanismes de filtration (principalement diffusion brownienne, interception et impaction) ; durant cette étape, l'évolution de la perte de charge est négligeable mais l'efficacité de filtration augmente. Dans la deuxième étape, un gâteau de particules se construit à la surface du média filtrant et devient le principal responsable de la collecte des particules et de l'augmentation de la perte de charge du filtre et de l'efficacité de collecte. Ainsi, le gâteau de particules joue un rôle essentiel dans la collecte des particules.
Ce chapitre présente également une revue bibliographique sur l’influence de l’humidité, la température, la vitesse de filtration, la taille et la nature des particules sur le dépôt des particules et par conséquent sur les performances de filtration par un média fibreux.
Les matériels et méthodes employés durant les campagnes expérimentales sont décrits dans le chapitre II. Deux configurations expérimentales ont été utilisées pour le colmatage de deux géométries de filtre différentes (filtre à manche et filtre plan). Quelle que soit la géométrie du filtre, il est constitué du même média filtrant issu de 2 manches industrielles respectivement lavée (en cours de vie) et neuve fournies par l’entreprise TREDI, composé de fibres de Téflon (polytétrafluoroéthylène PTFE). Il s’agit d’un média non tissé, aiguilleté et traité en surface. La manche filtrante testée est un filtre prototype de diamètre de 150 mm et de hauteur réduite à 440 mm pour une surface de filtration d’environ 0,225 m2. La configuration est celle d’une manche verticale équipée d'un système de décolmatage à impulsion Jet-Puls. Au cours de
3
cette procédure de décolmatage en ligne, les particules déposées sur la surface du média filtrant sont retirées en utilisant l'injection d'air comprimé (à 6-7 bars) pendant 0,3 s dans la direction opposée au flux de gaz.
L’unité pilote de filtration, développée dans le projet NanoFlueGas (Le Bihan et al. 2014) pour l’étude du filtre à manche en conditions opératoires représentatives des lignes de traitement des fumées d’incinération, a été améliorée durant ces travaux de thèse. Le pilote de traitement a notamment été équipé d'un système de nettoyage par rétro-soufflage à air comprimé (jet d'impulsions), afin de pouvoir quantifier les performances de filtration du filtre à manche pendant plusieurs cycles de colmatage/décolmatage. Dans le pilote de filtration, quatre zones se distinguent : tout d’abord i) l’alimentation du pilote par de l’air filtré, puis ii) une zone de chauffage de l’air jusqu’à 70°C avec injection et mesure de l’humidité de l’air, la zone de test entièrement chauffée à 150°C et calorifugée comprenant l’injection des particules, iii) le module de filtre à manche et les points de prélèvement amont/aval du filtre pour la mesure de l’efficacité par le compteur SMPS, et enfin iv) le rejet après condensation des gaz et filtration des particules résiduelles. Le décolmatage de la manche filtrante est assuré par rétro-soufflage (6-7 bar). Un réservoir amovible chauffé à 150°C permet de récupérer les poussières en bas du module de filtration. L’ensemble du pilote est situé dans un laboratoire dédié à l’étude des nanoparticules.
Le second banc d’essais développé durant ces travaux de thèse a été utilisé pour tester le filtre en géométrie plane (sans système de décolmatage en ligne) à température ambiante (24°C) et humidité relative ambiante (environ 45%) pour 2 différentes vitesses de filtration (1,4 et 1,9 cm.s-1).
La perte de charge maximale des filtres en géométrie manche et plane durant les colmatages en conditions ambiantes (24°C - 45% HR) a été fixée à 120 Pa, et à 150 Pa en conditions fumées d’incinération (150°C - 3% HR). Cette différence de valeur de perte de charge maximale du filtre a été fixée en raison de l’influence de la température et de l’humidité sur la viscosité de l’air.
Les premiers résultats de performances du filtre à manche ont été décrits dans le chapitre III. Les performances du filtre à manche sont évaluées lors de plusieurs cycles de colmatage/décolmatage en conditions de fumées d’incinération. Le débit d'air et le filtre à manche ont été chauffés à 150°C, la teneur en eau a été maintenue dans le flux d'air à 3% HR, tandis que la vitesse de filtration à travers le filtre à manche était de 1,9 cm.s-1. Un mélange de particules en suspension de taille submicronique de charbon actif et de bicarbonate de sodium,
4
utilisées dans les conduites de traitement des gaz de combustion principalement pour l'élimination des dioxines/furanes et des gaz acides, a été généré simultanément avec l’aérosol de combustion en amont de la manche filtrante.
Les performances du filtre à manche ont été étudiées sur 11 cycles de colmatage/décolmatage. L'étude a caractérisé l'évaluation des performances de filtration au début de la durée de vie du filtre à manche avant la stabilisation de la perte de charge résiduelle résultant des cycles de filtration précédents. La perte de charge maximale a été fixée à 150 Pa pour tous les cycles de filtration. Une fois que la perte de charge a été atteinte, le filtre a été décolmaté. La filtration a été ensuite poursuivie jusqu'à la perte de charge maximale. Les performances du filtre à manche testé ont été étudiées en termes d'évolution de la perte de charge, et des efficacités fractionnelle et totale de capture des particules.
Les principales conclusions de cette étude expérimentale sont les suivantes :
(1) Pour chaque cycle de filtration, les essais au laboratoire montrent une efficacité totale du filtre à manche qui augmente avec le colmatage d'une valeur minimale de 98,5% jusqu’à 99,98%.
(2) L’efficacité fractionnelle varie en fonction de la taille des particules, avec un minimum d’efficacité de collecte (98,5%) mesuré pour des particules de taille 74 ± 15 nm (MPPS). (3) La durée de colmatage diminue de 630 min pour le premier cycle de filtration à environ 70 min pour le dernier (cycle 11), en raison de la perte de charge résiduelle qui augmente avec les cycles de filtration.
(4) Les résultats ont montré une diminution de l'efficacité de collecte des nanoparticules en fin de cycles de colmatage/décolmatage et une augmentation de la résistance du gâteau de particules, expliquées dans ces travaux par l'augmentation de la vitesse interstitielle de filtration. Le gâteau résiduel et la distribution non uniforme du gâteau de filtre sont les principales raisons qui pourraient conduire à une répartition non uniforme de la vitesse de filtration sur la surface du filtre, ce qui contribuerait à augmenter la vitesse interstitielle dans les zones du filtre moins chargées de particules.
En général, ces résultats ont montré une efficacité élevée du filtre à manche pour la filtration de particules submicroniques et nanométriques dans des conditions réalistes rencontrées pour le traitement des fumées d'incinération des déchets.
Dans le chapitre IV, une étude expérimentale et théorique a été menée sur l'influence de différents paramètres sur les performances du filtre en géométrie manche et plane. Les paramètres opératoires étudiés étaient l'humidité (3% HR contre 0% HR à 150°C), la
5
température (150°C contre 24°C), la vitesse de filtration (1,9 cm.s-1 contre 1,4 cm.s-1) et la présence de réactifs.
Les résultats expérimentaux ont montré que l'humidité a une influence importante sur les performances du filtre à manche à 150°C. Pour un même nombre de particules collectées, l'efficacité de collecte augmente avec l'humidité pour les particules de plus de 110 nm de diamètre, alors qu'aucun effet significatif n'a été observé pour les nanoparticules (particules < 100 nm). En termes d'évolution de la perte de charge, l'humidité est un facteur clé qui provoque l'élévation rapide de la résistance du filtre à manche expliquée par la formation d’un gâteau de particules compacte lors du colmatage en raison de condensation capillaire entre les particules, et l’augmentation des forces d’adhésion entre les particules en présence d’humidité conduisant à un décolmatage du filtre moins efficace en présence d'humidité qu’en air sec. En bref, l'humidité augmente l'efficacité de collecte du filtre à manche mais accélère l'augmentation de la perte de charge et réduit l'efficacité de décolmatage et peut donc conduire à réduire la durée de vie du filtre à manche.
L'influence de la température sur les performances du filtre à manche a également été étudiée expérimentalement dans ce chapitre. En termes d'efficacité de filtration, la collecte des particules est plus élevée à 150°C qu’à 24°C. Cela s’explique par l’influence de la température sur le mécanisme de diffusion brownienne. La force brownienne traduit l'effet des chocs entre les particules et les molécules du fluide environnant. Cette agitation aléatoire est influencée par la température du fluide : plus que la température est élevée, plus la fréquence des chocs entre les molécules et les particules est importante, par conséquent le mouvement des fine particules devient important et leur probabilité de capture par les fibres augmente ce qui explique une haute efficacité à 150°C par rapport à 24°C. Avec le colmatage, l'évolution de l'efficacité est plus rapide à haute température et atteint une efficacité maximale de 99,99% à 150°C contre 99,8% à 24°C.
En termes de perte de charge du filtre, la température n'a pas une influence directe sur la résistance du gâteau de particules formé. Les écarts de valeurs de perte de charge entre 150°C et 24°C s’expliquent par la viscosité du fluide qui augmente avec la température de filtration. Indépendamment de la variation de la viscosité du gaz en fonction de la température, les résultats n’ont montré aucune influence de la température sur la structure du gâteau de particules formé.
Concernant l’influence de la présence de réactifs, les résultats ont révélé que l’efficacité de collecte augmente plus rapidement pour le filtre à manche colmaté uniquement par les
6
nanoparticules de combustion, mais que dans ce cas le décolmatage est moins efficace, conduisant à une augmentation significative de la perte de charge résiduelle du filtre au cours des cycles de colmatage/décolmatage. Par conséquent, la taille des particules pour les conditions de cette étude est un facteur clé qui affecte l'efficacité de décolmatage du gâteau de particules.
L'influence de la température et de l'humidité sur l'efficacité de filtration théorique (calculée à partir de modèles de la littérature) a été étudiée à 150°C et 24°C pour 1,9 cm.s-1 de vitesse de filtration. Les résultats ont montré tout d’abord que les particules de moins de 90 nm de diamètre sont les plus influencées par la température à 150°C par rapport à 24°C. Ceci est conforme aux résultats expérimentaux obtenus en termes d'efficacité. Théoriquement, aucune influence de l'humidité sur l'efficacité de filtration n'a été observée à 150°C (3% HR par rapport à 0%). Cependant, les résultats expérimentaux ont montré que, à une humidité plus élevée, l'efficacité de collecte est significative. Cela peut confirmer l'hypothèse de l'influence de l'humidité sur la compacité du gâteau formé à la surface du filtre en raison de condensation capillaire, non prise en compte dans les modèles étudiés.
L'efficacité de filtration et la perte de charge de filtres plans ont été évaluées durant des colmatages avec l’aérosol de combustion afin d’étudier l’influence de la vitesse de filtration ainsi que du pré-colmatage du filtre (filtre neuf versus filtre lavé). Les principales conclusions obtenues expérimentalement sont:
(1) l'efficacité de filtration diminue avec l'augmentation de la vitesse de filtration, en particulier pour les diamètres de particules compris entre 50 et 140 nm,
(2) les filtres neufs sont nettement moins efficaces que les filtres lavés en début de colmatage,
(3) la taille de particules la plus pénétrante dans le filtre (MPPS) diminue avec le colmatage du filtre de 76 ± 15 à 39 ± 4 nm.
La simulation numérique de l'écoulement d'un mélange de fluide et de particules pour étudier la trajectoire des particules a été décrite par l'intégration Lagrangienne de l'équation de Langevin. Le fluide obéit à une loi de comportement newtonien, et les particules solides sont des sphères. Les résultats de la simulation numérique montrent l'effet notable des paramètres de fonctionnement du filtre sur la trajectoire des particules, en particulier la taille des particules et la température du fluide. En effet, la fluctuation verticale des particules autour de la fibre filtrante à 150°C est plus importante que pour une température de 24°C. Ce résultat indique que la probabilité de collecte des nanoparticules par la fibre augmente avec l'augmentation de la température. D'autre part, l'effet de la taille des particules sur leur
7
trajectoire est important. Les résultats indiquent clairement que les fluctuations de la trajectoire des particules augmentent avec la diminution du diamètre des particules. En revanche, les résultats ont révélé un effet peu significatif de la vitesse sur le comportement des nanoparticules dans la gamme étudiée expérimentalement (entre et 1,4 et 1,9 cm.s-1), mais un effet de la vitesse plus important à partir de 10 cm.s-1. La simulation numérique actuelle est un travail préliminaire pour calculer théoriquement l'efficacité du filtre dans des conditions opérationnelles similaires à celles de l'étude expérimentale. Cependant, un travail supplémentaire serait nécessaire pour étudier les mécanismes de capture des particules et pour calculer l'efficacité du filtre, en particulier la modélisation de la structure du filtre et le comportement du fluide à travers le média filtrant.
Mots clés : Incinération de déchets, performances de filtration, filtre à manche, cycle de colmatage/décolmatage, particules submicroniques et nanométriques
8
Abstract
Filtration performance of a pulse-jet bag filter was evaluated at the laboratory-scale regarding submicronic particles with a nanosized fraction during clogging/unclogging cycles. The particle size distribution was representative to those encountered at the outlet of a nano-waste incineration device at laboratory-scale. The bag filter was operated in conditions as similar as possible to those found in flue gas treatment of waste incineration plants, in terms of temperature, humidity, filtration velocity, injection of sorbent reagents and unclogging conditions. The air flow and the bag filter were heated to 150°C, the water content was maintained in the air flow in the range of 10-12% (3% of relative humidity RH), and filtration velocity throughout the bag filter was fixed at 1.9 cm.s-1. A mixture of submicronic suspended particles of activated carbon and sodium bicarbonate, both used in flue gas treatment systems mainly for the removal of dioxins/furans and acid gases, was generated simultaneously with the aerosol representative of combustion emissions.
The study focused on the filtration performance at the beginning of the bag filter’s lifetime filter for the 11 first clogging-unclogging cycles before stabilizing the residual pressure drop reached after pulse-jet unclogging. The maximum pressure drop was set at 150 Pa for all filtration cycles. Once the maximum pressure drop was reached, the filter was unclogged using the pulse-jet system. The performance of the bag filter was evaluated in terms of the evolution of pressure drop, fractional and total particle collection efficiencies, during the clogging/unclogging cycles.
Moreover, an experimental and theoretical study was carried out on the influence of different parameters on the filtration performance of bag filter and flat filter, such as influence of humidity (3% RH versus 0% RH at 150°C), temperature (150°C versus 24°C), filtration velocity (1.9 cm.s-1 versus 1.4 cm.s-1) and the influence of the injection of sorbent reagents. The main results of this study are: (i) high collection efficiency of the bag filter in representative conditions of flue gas treatment of waste incineration: minimun particle collection efficiency of 98.5% for particle diameter of 74 ± 15 nm (electrical mobility diameter), (ii) influence of residual particle cake at the beginning of the filtration cycles on the bag filter performance, (iii) significant influence of humidity on the porosity of the particle cake due to the capillary condensation of water between the particles in presence of humidity (150°C - 3% RH i.e. almost 100 g of water per kg of dry air). Faster increase of bag filter pressure drop in presence of humidiy (150°C - 3% RH) as compared to the dry conditions (150°C - 0% RH).
Keywords: Waste incineration, filtration performance, bag filter, clogging/unclogging cycles, submicronic and nanosized particles
10
Contents
List of Figures... 13
List of Tables ... 16
Nomenclature ... 17
Framework ... 21
Chapter I
State of the Art ... 26
I Introduction ... 27
II Nanomaterials end-of-life ... 28
II.1 Incineration of nano-wastes ... 29
II.2 Incineration technology ... 30
II.3 Examples of pollutants in waste incineration raw fumes ... 32
III Aerosol classification ... 35
III.1 Equivalent diameter ... 35
III.2 Particle size distribution ... 36
III.3 Simulation of particle motion and deposition ... 38
III.4 Forces acting on particles ... 39
III.5 Adhesion and entrainment force ... 42
IV Bag filter technology ... 44
IV.1 Principle of operation ... 45
IV.2 Bag filter types ... 45
IV.3 Operating conditions ... 47
IV.4 Fiber properties used for bag filter ... 47
V Filtration theory of fibrous media ... 48
V.1 Stationary Filtration ... 49
V.2 Non-stationary filtration ... 57
VI Influence of operating conditions on filtration performance ... 63
VI.1 Filtration velocity ... 64
VI.2 Air humidity ... 64
VI.3 Air temperature ... 65
VI.4 Particle loading ... 66
VI.5 Particle concentration ... 66
VI.6 Particle shape ... 67
VI.7 Filtration cycles ... 68
VI.8 Influence of upper pressure drop on filter resistance ... 70
VI.9 Bag filter damage ... 70
VII Conclusions of the chapter ... 72
Chapter II
Materials and methods ... 74
I Introduction ... 75
II Description of experimental setups ... 75
II.1 Bag filter setup ... 75
II.2 Flat filter setup ... 78
II.3 Aerosol sampling ... 81
III Tested aerosols ... 83
11
III.2 Particle generator and measurement equipment ... 86
III.3 Particle size distribution and concentration ... 89
III.4 Stabilization of the generated aerosol ... 91
IV Tested filters ... 92
IV.1 Filter geometries ... 92
IV.2 Structural parameters of the filtering media ... 93
V Methodology ... 96
V.1 Overall Methodology ... 96
V.2 Operating conditions for experimental campaigns ... 97
V.3 Aerosol preparation and generation protocol ... 99
V.4 Aerosol dilution ... 99
V.5 Pressure drop measurement ... 100
V.6 Efficiency measurement ... 100
VI Conclusions of the chapter ... 104
Chapter III
Pulse-jet bag filter performance for treatment of
submicronic and nanosized particles at waste incineration conditions .... 106
I Introduction ... 107
II Bag filter pressure drop ... 107
III Bag filter efficiency for cycle 1 ... 111
III.1 Total efficiency ... 111
III.2 Fractional efficiency ... 114
III.3 Evolution of MPPS as a function of clogging ... 116
IV Influence of filtration cycles on bag filter total efficiency ... 117
V Fractional efficiency as a function of filtration cycles ... 118
VI Evolution of cake filter and filter media resistance after cleaning ... 122
VII Conclusions of the chapter ... 125
Chapter IV
Influence of operating parameters on filtration performance
of bag filter and flat filter ... 128
I Introduction ... 129
II Influence of humidity ... 129
II.1 Filtration efficiency ... 129
II.2 Filter pressure drop ... 132
II.3 Discussion of performance results ... 134
II.4 Effect of humidity on unclogging efficiency ... 138
II.5 Filtration cycles ... 139
III Influence of operating conditions driven by temperature ... 141
III.1 Bag filter efficiency ... 142
III.2 Filter pressure drop ... 145
IV Influence of added reagents ... 148
IV.1 Filtration efficiency ... 148
IV.2 Influence of particles on pressure drop ... 149
V Influence of filter aging ... 154
V.1 Filter efficiency ... 154
V.2 Pressure drop evolution ... 155
12
VI.1 Collection efficiency ... 159
VI.2 Pressure drop ... 160
VII Mathematical and numerical modeling of nanoparticles transport ... 162
VII.1 Introduction ... 162
VII.2 Simulation method ... 162
VII.3 Initial condition of particles position ... 164
VII.4 Results and discussion ... 165
VIII Conclusion of the chapter ... 167
General conclusions ... 170
13
List of Figures
Figure 1: Different manufactured nanomaterials ... 28
Figure 2: Exhaust of waste incinerators ... 29
Figure 3: Different types of diameter ... 35
Figure 4: Normal and log-normal distribution ... 37
Figure 5: Capillary condensation between two spherical surface particles (Butt & Kappl 2009) ... 43
Figure 6: Air flow in a bag filter ... 45
Figure 7: The three types of bag filter (Ivell 2012) ... 46
Figure 8: Particle collection by diffusion mechanism ... 49
Figure 9: Particle collection by interception mechanism ... 51
Figure 10: Particle collection by impaction mechanism ... 51
Figure 11: Particle collection by electrostatic force ... 52
Figure 12: Filtration mechanisms as a function of particle diameter ... 53
Figure 13: Dendrite formation as a function of Stk, Pe and R ... 58
Figure 14: Deposit particles on fibers (Thomas 2001) ... 58
Figure 15: Illustrated graph of ΔP evolution vs loaded mass ... 61
Figure 16: Influence of dust cake on filtration efficiency ... 62
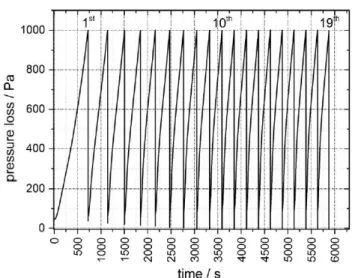
Figure 17: Pressure drop curve for a new filter media with 19-fold filter cake build-up (Förster et al. 2016) ... 69
Figure 18: Illustration scheme of the filter layer ... 69
Figure 19: Damaged bag filter (Zhou et al. 2012) ... 71
Figure 20: Experimental setup for bag filter clogging tests ... 77
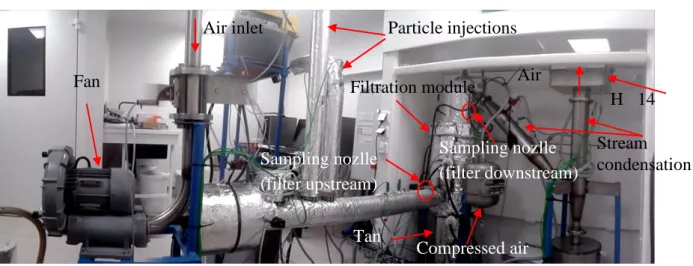
Figure 21: Photograph of experimental setup for bag filter clogging tests ... 78
Figure 22: Experimental setup for flat filter clogging tests ... 80
Figure 23: Schematic illustration of air sampling (inspired from James & Lodge 1988) ... 82
Figure 24: Sampling nozzle for flat and bag filter setups ... 83
Figure 25: SEM observation of agglomerates generated by the DNP 2000 generator (Palas) 84 Figure 26: SEM observation of reagent particles (sodium bicarbonate + activated carbon) ... 85
Figure 27: Principle of the spark generator ... 86
Figure 28: Particle number distribution of the carbon aerosol for different spark frequencies 87 Figure 29: Particle number distribution of the carbon aerosol for different dilution air flow rates ... 87
Figure 30: Schematic of the SAG 420 (TOPAS) dust disperser, side views ... 88
Figure 31 : Illustration scheme of different component of SMPS (Guha et al. 2012) ... 89
Figure 32: Particle size distribution of bag filter (a, b) and flat filter (c) at different filtration conditions (T, RH) ... 90
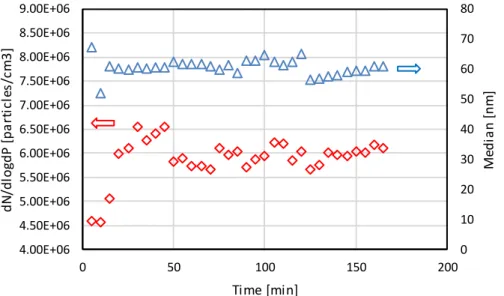
Figure 33: Evolution of nanoparticle concentration and electrical mobility median diameter as a function of time ... 91
Figure 34: Dimensions of tested filters ... 92
Figure 35: SEM observation of the surface (A) and the slice (B) of the filter media ... 93
Figure 36: Size distribution of the Teflon fibers constituting the filter media (obtained by SEM image analysis) ... 94
Figure 37: Evolution of pressure drop of the filter media as a function of the flow velocity for flat and bag filter at different operating parameters of filtration conditions ... 96
Figure 38: Diagram illustrator of main experimental objectives ... 97
14
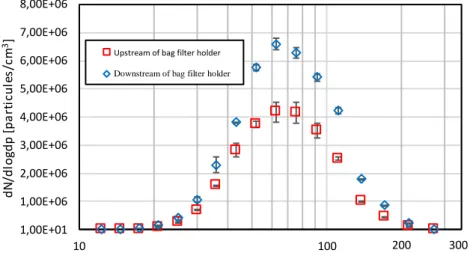
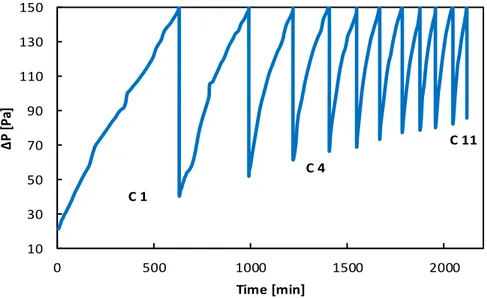
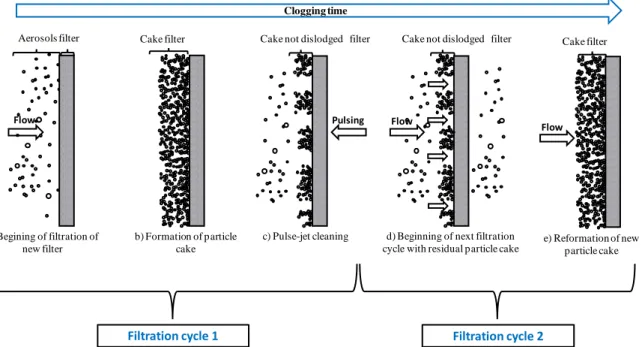
Figure 40: Schematic illustration of aerosol sampling methodology ... 101 Figure 41: Schematic illustration of particle concentration measuring upstream of bag filter ... 102 Figure 42: Difference of particle concentration upstream and downstream of filter holder in absence of bag filter ... 103 Figure 43: Bag filter pressure drop (ΔP) evolution versus time for 11 clogging/unclogging cycles (from C1 to C11) during clogging with reagents and nanoparticles ... 108 Figure 44: Evolution of cycle time as a function of filtration cycle ... 109 Figure 45: Illustration scheme of incomplete detachment of cake filter and reformation of new dust cake ... 110 Figure 46: SEM photographs of the unclogged bag filter ... 111 Figure 47: Evolution of overall efficiency and pressure drop during the first filtration cycle as a function of the collected mass of particles per surface unit for particle size range of 16-750 nm and median diameter of 45 nm ... 113 Figure 48: Evolution of filtration efficiency as a function of particle diameter for the first filtration cycle (C1) at different values of filter pressure drop (ΔP) ... 115 Figure 49: Evolution of MPPS as a function of clogging during filtration cycle 1 ... 117 Figure 50: Evolution of filtration efficiency during the 11 filtration cycles ... 117 Figure 51: Evolution of fractional efficiency measured at the minimum pressure drop for different filtration cycles as a function of particle diameter ... 118 Figure 52: Evolution of fractional efficiency at the maximum pressure drop (150 Pa) for different filtration cycles as a function of particle diameter ... 119 Figure 53: Illustration scheme of the increase of residual particle cake with filtration cycles ... 120 Figure 54: Illustration scheme of increase of local filtration velocity at maximum filter pressure drop with filtration cycles ... 121 Figure 55: Evolution of MPPS as a function of filtration cycles at residual ΔP (pressure drop after regeneration for a given filtration cycle) ... 122 Figure 56: Pressure drop evolution across used bag filter against collected particles mass per unit area ... 123 Figure 57: Evolution of specific cake resistance and media filter resistance as a function of filtration cycles ... 124 Figure 58: Effect of pulse-jet cleaning on residual dust cake structure ... 125 Figure 59: Fractional efficiency of bag filter for different pressure drop level at 150°C - 3% RH and 150°C - 0% RH with carbon nanoparticles for the first clogging cycle ... 130 Figure 60: Evolution of fractional efficiency for different collected carbon nanoparticle number - 150°C in humid (3% RH) and dry (0% RH) conditions for the first filtration cycle ... 131 Figure 61: Influence of humidity on theoretical filtration efficiency ... 132 Figure 62: Influence of humidity on change in bag filter pressure drop during clogging/unclogging cycles ... 133 Figure 63: Evolution of ΔP as a function of collected particle number at (150°C - 3% RH) and (150°C - 0% RH) ... 134 Figure 64: Effect of humidity on aggregates ... 135 Figure 65: illustration scheme of two solid particles of radius R1, in contact at different vapor pressure (Butt and Kappl 2009) ... 136 Figure 66: Influence of humidity on raw flow resistance through the bag filter... 137 Figure 67: Filter resistance evolution of bag filter at the beginning of each filtration cycle - (150°C - 0%RH) and (150°C - 3%RH) ... 139
15
Figure 68: Influence of clogging/unclogging cycle and residual ΔP on filtration efficiency and MPPS (150°C - 0%RH)... 139 Figure 69: Collection efficiency at maximum ΔP (150 Pa) over 10 filtration cycles at (150°C - 3% RH) and (150°C - 0% RH) ... 141 Figure 70: Bag filter fractional efficiency as a function of particle diameter for different collected particle numbers at 24°C - 45% RH and 150°C - 0%RH ... 142 Figure 71: Bag filter fractional efficiency as a function of particle diameter for different collected particle numbers at 24°C - 45% RH and 150°C - 0% RH for nanopartcile size range ... 143 Figure 72: Influence of temperature and humidity on Initial fractional efficiency according to Kasper et al. (1978) model ... 144 Figure 73: Efficiency of collection mechanisms by the model of Kasper et al. (1978) at 150°C and 24°C ... 145 Figure 74: Evolution of filter resistance as a function of collected particle number at 24°C - 45% RH and 150°C - 0%RH for cycle 1 ... 146 Figure 75: Bag filter resistance as a function of time – (24°C - 45%RH) and (150°C - 0% RH) ... 147 Figure 76: Residual pressure drop evolution of bag filter as a function of filtration cycles at (24°C - 45%) RH and (150°C - 0% RH) ... 148 Figure 77: Filtration efficiency versus particle diameter for the first filtration cycle of used bag filter, at different values of ΔP and collected particles number for the two particles: NPs and NPs + reagents ... 149 Figure 78: Evolution of pressure drop versus collected particles number at 150°C and 3% RH for the two particles (NPs and NPs + reagents) for first clogging cycle ... 150 Figure 79: Evolution of pressure drop (ΔP) of bag filter versus time for 10 clogging/unclogging cycles for two loading particles at 150°C, 3% RH ... 151 Figure 80: Clogging time as a function of filtration cycles for the two particles: NPs and NPs + reagents ... 151 Figure 81: SEM images of particles (reagents and nanoparticles) captured at the surface of tested filter for the two particles ... 153 Figure 82: Evolution of total efficiency as a function of ΔP/ΔP0 for used and new flat filters at filtration velocity of 1.4 cm.s-1 ... 154 Figure 83: Evolution of fractional efficiency as a function of particle size for used and new flat filters and for different level of clogging ΔP/ΔP0 – Filtration velocity=1.4 cm.s-1
... 155 Figure 84: Pressure drop across new and used bag filter against time for 10 clogging/unclogging cycles at (24°C - 45% RH) ... 158 Figure 85 : Evolution of fractional efficiency, as a function of equivalent diameter in electrical mobility, of used and new flat filters at two filtration velocities (1.4 and 1.9 cm.s-1) and at different values of ΔP/ΔP0 under continuous loading ... 160 Figure 86: Pressure drop filtration time for used flat filter at 1.4 and 1.9 cm.s-1 ... 160 Figure 87: Pressure drop as a function of collected particles for used flat filter at 1.4 and 1.9 cm.s-1 ... 161 Figure 88: Particles trajectory of 30 nm size at V=2 cm.s-1 ... 165 Figure 89: Particle velocity of 30 nm size at T=150°C and T=24°C ... 166 Figure 90: Particle trajectory of dp=30 nm, dp= 40 nm, dp=60 nm and dp=100 nm at T=150°C - Vf=2.5 cm.s-1 ... 166 Figure 91: Particle trajectory of dp=30 nm, at T= 150°C ... 167
16
List of Tables
Table 1: Coefficients A, B and C for the calculation of the Cunningham-Millikan-Davies
correction factor ... 50
Table 2: Overall of fractional efficiency and collection mechanism models ... 56
Table 3: Influence of operating conditions on filtration mechanisms (Thomas 2001) ... 63
Table 4: Evolution of geometric standard deviation and median diameter for different filtration conditions ... 91
Table 5: Main structural parameters of the filtering media (Le Bihan et al. 2014) ... 93
Table 6: Experimental campaigns at ambient conditions ... 98
Table 7: Experimental campaigns at 150°C temperature conditions ... 98
17
Nomenclature
A12 Hamaker constant [kg.m
2
.s-2]
A(t) Random acceleration [N]
Drag coefficient [-]
Correction term for the diffusion slip flow effect [-]
Cc Cunningham coefficient [-]
Correction term for the diffusion slip flow effect [-] Number concentration of generated particles of diameter [#/cm3]
Correction term for the interception slip flow effect [-]
Coefficient of Brownian diffusion [m2.s-1]
Bag filter diameter [m]
Particle diameter [m]
Mass median diameter [m]
Particle separation distance [m]
Fiber diameter [m]
dpores Fiber mean diameter of the pores media [m]
Fractional efficiency [-]
E Electric field [N.C−1]
Et Overall collection efficiency of a filter [-]
e Radius of fluid envelope [m]
Archimedes force [N]
Brownian force
Capillary force [N]
Electrostatic force [N]
Fext External force [N]
Fr Random force [N]
g Gravitational acceleration [m.s-2]
i Gaussian distribution of random numbers [-]
18
HKu Hydrodynamic factor [-]
Boltzmann constant [m2.kg.s-2.K-1]
Empirical constant of Kozeny and Carman [-]
Air permeability [m2]
Media filter resistance [m-1]
Specific cake resistance [m.kg-1]
Kth Thermophoric diffusion coefficient [-]
Filter thickness [m]
L’ Cake thickness [m]
Lcake Overall surface of residual cake [m2]
Particle mass [kg]
Nupstream,dp Particle number concentration upstream of filter [particles.cm -3
] Ndownstream,dp Particle number concentration downstream of filter [particles.cm
-3
]
Ionic concentration of solution [mol]
Number of molecules per unit volume [m-3]
np Number of charges/particle [-]
Peclet number [-]
Q Gas flow rate [l/min]
Electric charge of particles [C]
Electric charge of fiber [C]
Filtration velocity [m.s-1]
Particle velocity [m.s-1]
0 Given spectral density [-]
Sf Specific surface area of the fibers [m
-1
]
S Filter total surface [m2]
Stokes number [-]
Gas temperature [K]
Absolute temperature of the particle [K]
Interception number [-]
Reynolds number [-]
19
Collected particle mass per unit area [kg.m-2]
Potential interaction [N]
Vf Fluid velocity [m.s
-1
]
Particle volume [m3]
Pore size volume [m3]
Total volume of the material [m3]
Gaussian random variable [-]
Particle electric mobility [m2.s-1.V-1]
z Distributed random numbers [-]
Greek letters
ΔCupstream Experimental uncertainty [-]
Δt Time step [s]
Uncertainties related to the filter efficiency measurements [-]
Pressure drop across the filter [Pa]
Pressure drop across the cake filter [Pa]
ΔPres Residual pressure drop after unclogging [Pa]
ΔP0 Pressure drop across the filter media at the beginning of
clogging
[Pa]
τ relaxation time of particle [s]
time step between successive collisions of particle [s] Time step leading to an appreciable change in particle
displacement
[s]
μ Dynamic fluid viscosity [Pa.s]
ξ Filter resistance [m-1]
Superficial tension of the liquid film [N.m-1]
χ Dynamic form factor of particle [-]
μ Location parameter [-]
σ Standard deviation of the particle size distribution [-]
20
Unit efficiency of fiber collection by Brownian diffusion mechanism
[-]
Unit efficiency of fiber collection by the interception mechanism
[-]
Unit efficiency of fiber collection by the inertial impaction mechanism
[-]
Efficiency of fiber collection by combination of diffusion and
interception mechanism [-] Particle density [kg.m-3] Fluid density [kg.m-3] Effective density [kg.m -3 ]
ɛi Filter media porosity [-]
Packing density [-]
Abbreviations
BC Black Carbon
CPC Condensation Particle Counter DMA Differential Mobility Analyser MPPS Most Penetrating Particle Size
NP Nanoparticle
PSD Particle Size Distribution PTFE Polytetrafluoroethylene
SMPS Scanning Mobility Particle Sizer SEM Scanning Electron Microscope
21
22
There is no French or European regulation on the management of manufactured nanomaterials, regarding either the manufacturing, use or end of life. Such nano-containing products or nano-waste can end up in municipal solid waste or hazardous waste incineration plants. Studies (ADEME CORTEA NanoFlueGas Project No. 1181C0088: Le Bihan et al., 2014; Ounoughene et al., 2015; Walser et al., 2012) demonstrated the presence of the original nanoparticles, either alone or as aggregates, in the raw fumes leaving the primary chamber during the incineration of nanowaste in conventional incineration plants. But nanoparticles can be responsible for some health and environmental problems. Indeed, toxicological studies clearly demonstrated that their very small size is a key element in toxicity, particularly non-soluble particles (Ostiguy et al. 2006). This is why special attention is paid to the treatment of incineration fumes, in particular to the efficiency of processes dedicated to the removal of particles.
Incineration is the thermal treatment at high temperature of waste in order to convert the undesirable materials into char, flue gas containing particles, and heat. The process is conducted within a special furnace designed for burning these materials. During the incineration, the particles are generally formed from the inorganic components of the waste and can be accumulated in the incineration device or carried out by the flue gas.
The air pollution control techniques used must achieve compliance with standards to control the ambient air quality and reduce the exhausted hazardous air pollutants from the flue gas. A variety of physical processes can be used to remove coarse and fine particles from polluted airstreams, such as cyclones, bag filters, electrostatic precipitators and scrubbers.
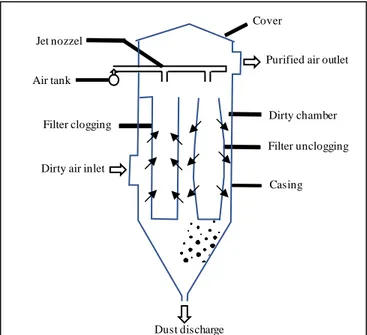
Bag filter is one of the common particle collection device used in industries to remove suspended particles from flue gas treatment lines. It is generally housed in a casing commonly known as a baghouse, which is a gathering of several hundreds cylindrical bags. At the bottom of baghouse, a hopper is installed to remove continuously the dust collected from the bags during filtration.
There are many studies in the literature (Alkiviades et al. 1976; Billings 1966; Endo et al. 1998; Song et al. 2006; Leung & Hung 2008;..) which focus on the performance of fibrous filters, mostly in flat geometry and ambient air conditions. For example, the influence of particle size or filtration velocity on the change in filter pressure drop and particle collection efficiency was studied both experimentally and theoretically. Regarding bag filter configuration, few studies are available (Saleem et al. 2011; Park 2012; Förster et al. 2016; Cirqueira et al. 2017). However, the geometry of the filter, the special operating conditions
23
(often high temperature and humidity conditions) or the on-line unclogging system are parameters which can greatly affect the performance of the bag filter compared to the filtration theory.
The aim of this thesis is to study the filtration performance of a bag filter with a synthetic aerosol emitted from nanowaste incineration at laboratory scale but representative of the conditions encountered within incineration flue gas treatment, in terms of temperature, humidity, filtration velocity and clogging/unclogging cycles. Moreover, the influence of operating conditions on the filtration performance was studied, such as the gas humidity, temperature, filtration velocity or nature of clogging particles.
The studies described in this dissertation were conducted as part of a co-supervised thesis between IMT Atlantique and Université Mohammed V- Faculté des sciences, co-funded by the program Hubert Curien TOUBKAL (campus France + CNRST) and TREDI – Groupe Séché. According to the previously exposed research objectives, the manuscript is organized as follows:
Chapter I proposes a bibliographic review on the aerosol science and filtration theory of fibrous media, especially the mechanisms of particle collection by fibrous filters and the evolution of pressure drop and collection efficiency as a function of cake filter. The literature review about the influence of operating conditions on filtration performance is also provided in this chapter.
Chapter II presents the methodology for the experimental studies at the laboratory-scale. The two experimental setups and the methodology adopted to evaluate the performance of two filters geometries (flat filter and bag filter) are described.
Chapter III presents the results of the filtration performance of the bag filter for clogging/unclogging cycles regarding the filtration of submicronic and nanosized particles. This under operating conditions as close as possible to those found in waste incineration plants in terms of gas filtration velocity, concentration of particle reagents, gas temperature and humidity, pressure and duration of the cleaning pulse-jet.
Chapter IV presents the results regarding the influence of operating conditions on the filtration performance. The investigations were carried on the influence of humidity, temperature, and characteristics of the particles used for clogging on the bag filter performance, and the influence of filtration velocity and filter aging on the performance of filter in flat configuration. To complete the experimental results, numerical investigations were conducted on the influence of gas temperature, particle size and velocity.
24
Finally, the general conclusion summarizes the main conclusions achieved from the work presented in this manuscript.
26
I
Introduction
Over the past few decades, the industries exhibited a growing interest for the implementation of nanotechnology for producing nanomaterials with increased performance. In 2008, the global markets of nanotechnology-based products were estimated around $200 billion and the production has been increasing at a rate of 25% per year (Roco et al. 2011). To date, manufacturing nanomaterials is still in a growing economy (Charitidis et al. 2014) and is often seen as a new industrial revolution. In many areas of the world, nanoparticles have become an essential part in human daily life. They are present in different fields and application, such as textile, medicine, food and fertilizers. In fact, the main reason of developing nanomaterials is that they create unique properties compared with coarse particles of the same materials. The products made of nanomaterials can be stronger, lighter, more durable, more reactive, UV resistant, anti-stain, anti-shrinkage in the fabrics or better electrical conductors.
Nanotechnology is the production and design of the materials by their manipulation at molecular level and controlling their shape and size at nanometer scale in order to exploit the unique quantum and surface phenomena that such matter exhibits at the nanoscale, increase of the surface area, which makes the materials more chemically reactive and affect their strength or electrical properties (Aslan et al. 2005).
Many different existing manufactured nanomaterials are produced industrially (Figure 1), such as: TiO2, ZnO, FeOx, AlOx, SiO2, CeO2, Ag, Carbon Nanotubes (CNTs), fullerenes (buckyballs), and Quantum Dots (QD).
According to the second annual declaration of the first of June 2014, the quantities and uses of substances at nanoscale produced, distributed or imported in France are as the following (R-Nano):
10,417 submitted declarations (compared with 3,409 in 2013)
1,713 active accounts corresponding to declarants in France and to European entities based outside France (83% increase compared to 2013)
more than 1,500 reporting entities (compared to 732 in 2013) In France: 274 667 t produced and 122 464 t imported
Figure 1: Different manufactured nanomaterials
As the demand of nanomaterials products increases, there is a growing challenge in assuring the treatment of their waste. Nano-waste management is considered as an essential condition to ensure the safety of their end-of-life.
Different types of wastes containing nanomaterials could be distinguished, such as wastes generated during manufacturing of nanomaterials, wastes generated during product use, (i.e. degradation, abrasion), and wastes generated from the disposition process such as incineration.
To date, there are no French or European regulations on the management of manufactured nanomaterials, whether at the level of manufacture, use, or end-of-life. No specific treatment for wastes containing nanomaterials was determined; they are considered as any other waste and undergo the Waste Framework Directive. Furthermore, no measure was designed specifically for management of possible risks associated to waste containing nonmaterial.
II
Nanomaterials end-of-life
Nanomaterials contained in products are ultimately entering the waste stream and find their way into disposal method such as incineration or landfills. According to the Report of Design and Operating Criteria (1992), the waste containing nanomaterials is the main sources of anthropic nanoparticles released to the environment. Thereby, controlling the release of
1 mm 100 µm 10 µm 1 µm 100 nm 10 nm 1 nm 0.1 nm Virus 100 nm Hemoglobin 5 nm DNA 10 nm Hair 200 µm Ant 1 mm Nanomaterials (1-100 nm) Dendrimer
Carbon nanotube Graphene
Liposome Fullerene
Hair 60 µm
nanoparticles from the disposal centers of waste containing nanomaterials is an important topic.
Currently, incineration is considered as an efficient high-temperature treatment of industrial waste. It reduces the volume of materials while producing heat and converts it into a flue gas, and ashes that can be safely disposed of (Figure 2). The nature of aerosol and gas produced from the incineration process depend on the nature of waste materials and incineration conditions and process mastery. During the waste incineration, H2O and common but climate-relevant compounds are emitted, (CO2 …), and occasionally some pollutants may be released beyond an acceptable value, like NOx and acidic components (HCl, SOx …).
Figure 2: Exhaust of waste incinerators
II.1 Incineration of nano-wastes
In the literature, degradation of nanocomposites during incineration has attracted many authors in order to study their behavior (Fornes and Paul 2003; Marney et al. 2008; Lewin et al. 2006; and Bouillard et al. 2013). As a function of the waste natures and their initial states, ultrafine particles can be emitted from the incinerators in different ways. In certain conditions, during incineration, nanoparticles can become aerosolized or can form aggregates, this transformation in materials state may be the main reason to change the pathway of incinerated nanoparticles (Holder et al. 2013). For example, the incineration of nanoparticles suspended in solid or liquid waste is more likely to form aggregates. Depending on the combustion conditions, these aggregates may not entirely burn.
waste Incineration Incineration gas treatment clean gases exhausted into the atmosphere Acid gas neutralization residues Fly ash Incinerator bottom ash
Recently Ounoughene et al. (2015), have investigated the behavior of PA6/HNTs nanocomposite (nylon-6 incorporating halloysite nanotubes) during the incineration at 850°C with high oxygen/fuel contact for at least 2 s residence time for the combustion gas.
The main purpose of this work was to study the hazardous compounds originating from the incineration of wastes containing nanomaterials from nanocomposites. The results showed the presence of the nano-objects in the raw combustion aerosol and in solid residues, which is likely to impact both flue gas and gas treatments.
II.2 Incineration technology
Operating conditions of waste incineration change as a function of the waste nature. The key drivers used to classify waste nature are especially: their chemical and physical composition (e.g. particle size composition), waste thermal characteristics, (e.g. calorific value), and humidity levels of the waste, etc.
In order to achieve efficient incineration and maximize the performance of incinerator, the following parameters must be continuously controlled: temperature, oxygen, carbon monoxide, hydrogen chloride (HCl) and possibly total hydrocarbon (Basel Convention Technical Guidelines on Incineration on land). Thus, the incinerators devices must be equipped with specific monitoring system for controlling and reporting functions continuously during the gas emissions. In the case of waste heat boiler installation, which is used to recover the energy from the exhaust energy, the monitors of CO and O2 is placed downstream of the boiler to improve sampling and gas conditioning, where CO is considered as a key indicator of the combustion performance.
As a function of waste natures and their compositions, the incinerator system can be defined for an efficient disposition. Thus, the management option for certain types of waste requires extensive characterization to determine an appropriate system. Some kind of waste, such as municipal solid waste can be incinerated in several incinerators systems like: travelling grate, rotary kilns, and fluidized beds. However, their incineration by non basic furnace system, such as fluidized beds, requires some specific pretreatment and/or the selective collection of the waste in order to achieve the treatment in certain particle size range.
Incineration of sewage sludge requires some pretreatment in order to reduce the content of water and moisture level by drying or the addition of supplementary fuels to ensure stable and efficient incineration. Sewage sludge are usually incinerated in rotary kilns, multiple hearth,
or fluidized bed incinerators. While the incineration of hazardous and medical waste is commonly taking place in rotary kilns.
In the following section, some characteristics of the most used incinerators system are presented. Note that significant part of the following paragraph is based on BREF 2006, currently in course of modification.
Grate incinerators:
Approximately 90% of systems treating the municipal solid waste in Europe take place in Grate incinerators. According to the legislation Directive 2000/76/EC, the appropriate conditions for efficiency combustion of waste is fixed at minimum temperature of 850°C for 2 s of residence time with minimum oxygen content of 6% (modified by the most recent EC Directive). In the case of hazardous wastes with a content of 1% of halogenated organic substances (chlorine), the incineration temperature must be raised to 1100°C for 2 s of residence.
Rotary kilns:
Rotary kiln is incineration technology used almost for any kind of waste regardless their composition. In general, this technology is commonly applied high temperature range (note that gasification is not incineration…), up to 1450 °C (as a high temperature ash melting kiln). The operating temperature depends on the incinerated waste nature and their composition, for example incineration of hazardous wastes requires temperatures in the range of 900 – 1200°C.
Fluidized beds:
Fluidized beds are especially appropriate for the incineration of dried sewage sludge and Refuse derived fuel (RDF). The fluidized bed is an inclinator composed of double combustion chamber, at the bottom of the device, a bed of sand or ash on a grate is fluidized with air where some process of waste takes place such as drying, volatilization, ignition, and combustion.
The waste is fed continually into the fluidized bed from the top or side of combustion chamber. The temperature in the chamber combustion can be varied between 650 and 950°C. In the free space above the fluidized bed material, which is designed to allow retention of the gases in a combustion zone, the temperature is in the range of 850 and 950 °C, while the temperature of the bed is around 650°C.
The multiple hearth is composed of a cylindrical lined steel jacket, and a rotating sleeve shaft with attached agitating arms. The waste is fed at the top of the incinerator and moves through the different hearths. The upper section of hearths provides waste drying, where the waste gives up moisture while the hot flue-gases are cooled. The incineration is operated at the central hearths with limited temperature of 980°C.
II.3 Examples of pollutants in waste incineration raw fumes
Incineration is a combustion process by which refuse and air are reacted to produce an acceptable gaseous effluent and an inert solid residue. Incineration of industrial waste generates different kind of compounds, typically H2O and CO2 (a harmless but climate-relevant gas) and can release some pollutants (acidic components, dust…), particularly in case of poor mastery of the whole process. All gases and aerosols in suspension at the outlet of the furnace (i.e. before the Air Pollution Control -APC- systems) are grouped together under the name of "raw fumes". These fumes are gaseous residues of combustion, which have been formed during thermos-chemical processes. The primary particles in raw fumes have almost the diffusion-equivalent diameters less than 0.5 µm, but the particles can be much larger because of agglomeration, especially at higher fume concentrations. The fumes are mainly composed of (Le Gléau 2012):
Air component: N2, O2...
Conventional combustion gases: CO2, H2O;
Gaseous pollutants which may be a function of the composition of the fuel: CO, NO, NO2, SO2, HCl, HF, volatile metals, PAH...;
Particles: soot, unburned fuel, fly ash, particulate matter condensation. II.3.1 Nitrogen oxides
Nitrogen oxides (N2O, NO, and NO2) are formed by reaction chains from the nitrogen contained in the waste and the molecular nitrogen in the combustion air. The main oxides formed during combustion are nitrogen monoxide (NO) and nitrogen dioxide (NO2). The name NOx is relative to the mixture of these two constituents, but remains rich in NO: about 95% NO and 5% NO2 during the household waste incineration.
Concentrations of NOx from the incineration center for household and similar wastes are between 150 and 450 mg.Nm-3 before treatment and 1000 to 1500 mg.Nm-3 for hazardous waste incineration units.
NOx from the conversion of the nitrogen contained in the waste: combustible NOx
NOx from the conversion of the nitrogen contained in the combustion air: thermal NOx Considering the combustion temperatures (T <1600°C), 70 to 80% of the NOx formed are derived from combustible nitrogen, i.e. solid and liquid waste.
II.3.2 Sulfur dioxide
If the treated waste contains sulfur in organic form or as sulfates, it is mainly SO2 that will be created according to the following reaction: S + O2 → SO2.
Sulphur dioxide (SO2) is cleaned from flue-gases by the injection of chemical or physical sorption agents.
The formation mechanism of sulfur oxides occurs in certain temperature ranges. From 250°C, sulfur is oxidized by oxygen to sulfur dioxide or sulfur dioxide (SO2). Between 300°C and 500°C, sulfuric anhydride (SO3) is formed by oxidation of SO2 by the reaction:
SO2 + 1/2 O2 → SO3
In household waste incineration, the proportion of SO3 can reach 5% at the inlet of the smoke treatment line.
II.3.3 Carbon monoxide and carbon dioxide
The presence of carbon monoxide in incineration flue gas is mainly produced during the incomplete combustion of materials containing carbon. CO is produced when there is no enough oxygen locally and/or an insufficiently high combustion temperature (T<800°C). While in case of sufficient air and temperatures (T≈1000°C), the CO is completely converted into CO2 during incineration process. For example, for 1 ton of municipal waste combustion, about 0.7 to 1.7 tons of CO2 is generated. Carbon dioxide is not considered a pollutant, but excessive quantities of this gas within the atmosphere might produce a greenhouse effect.
The values of CO released into the atmosphere during the incineration of municipal waste and hazardous wastes are respectively in the range of 5-50 mg.Nm-3 and <30 mg.Nm-3. While for CO2 the corresponding values are respectively 5-10 % and 5-8 %.
II.3.4 Dust
The produced dust from the industrial waste incinerators consists of fine solid particles that come from various sources and become part of the air or other gases. The dust formed during the combustion can be distinguished in two types, mainly fly ash and soot. These pollutants are different in composition and in morphology and particle size distribution. Dust can be also the carrier of certain pollutants such as heavy metals trapped in dust due to the vapor