Accepted Manuscript
Microwave-assisted one-pot conversion of agro-industrial wastes into levulinic acid: An alternate approach
Sampa Maiti, Gorka Gallastegui, Gayatri Suresh, Vinayak Laxman Pachapur, Satinder Kaur Brar, Yann Le Bihan, Patrick Drogui, Gerardo Buelna, Mausam Verma, Roza Galvez
PII: S0960-8524(18)30791-0
DOI: https://doi.org/10.1016/j.biortech.2018.06.012
Reference: BITE 20029
To appear in: Bioresource Technology
Received Date: 31 March 2018 Revised Date: 4 June 2018 Accepted Date: 5 June 2018
Please cite this article as: Maiti, S., Gallastegui, G., Suresh, G., Laxman Pachapur, V., Kaur Brar, S., Le Bihan, Y., Drogui, P., Buelna, G., Verma, M., Galvez, R., Microwave-assisted one-pot conversion of agro-industrial wastes into levulinic acid: An alternate approach, Bioresource Technology (2018), doi: https://doi.org/10.1016/j.biortech. 2018.06.012
This is a PDF file of an unedited manuscript that has been accepted for publication. As a service to our customers we are providing this early version of the manuscript. The manuscript will undergo copyediting, typesetting, and review of the resulting proof before it is published in its final form. Please note that during the production process errors may be discovered which could affect the content, and all legal disclaimers that apply to the journal pertain.
1
Microwave-assisted one-pot conversion of agro-industrial wastes into levulinic acid: An alternate approach
Sampa Maitia*, Gorka Gallasteguia,b*, Gayatri Suresha*, Vinayak Laxman Pachapurc, Satinder Kaur Brara**, Yann Le Bihand, Patrick Droguia, Gerardo Buelnac, Mausam Vermae, Roza Galvezc
a
Institut national de la recherche scientifique, Centre - Eau Terre Environnement, 490, Rue de la Couronne, Québec(QC), Canada G1K 9A9
b
University of the Basque Country (UPV/EHU), Department of Chemical and
Environmental Engineering, Faculty of Engineering of Vitoria-Gasteiz, Nieves Cano, 18. 01006 Vitoria-Gasteiz, Spain
c
Université Laval, Department of Civil Engineering and Water Engineering, Pavilion Adrien-Pouliot,, 1065, avenue de la Médecine, Quebec Canada G1V 0A6
d
Centre de recherche industrielle du Québec (CRIQ), Québec (QC), Canada
e
CO2 Solutions Inc., 2300, rue Jean-Perrin, Québec, Québec G2C 1T9 Canada
*: Equal contributing co-authors
**Corresponding author: Phone: 1 418 654 3116; Fax: 1 418 654 2600; E-mail: [email protected]
2
Abstract
Brewery liquid waste (BLW), brewery spent grain (BSG), apple pomace solid wastes (APS), apple pomace ultrafiltration sludge (APUS) and starch industry waste (SIW) were evaluated as alternative feedstocks for levulinic acid (LA) production via microwave-assisted acid-catalyzed thermal hydrolysis. LA production of 204, 160, 66, 49 and 12 g/kg was observed for BLW, BSG, APS, APUS, and SIW, respectively, at 140 °C, 40 g/L substrate concentration (SC), 60 min and 2 N HCl (acid concentration). Based on the screening studies, BLW and BSG were selected for optimization studies using response surface methodology. Maximum LA production of 409 and 341 g/kg for BLW and BSG, respectively were obtained at 160°C, 4.5M HCl, 85 g/L SC and 27.5 min. Results demonstrated the possibility of using brewery wastes as promising substrates for economical and higher yield production of LA, a renewable platform chemical and versatile precursor for fuels and chemicals.
Keywords: Agro-industrial waste, Microwave-assisted synthesis, Levulinic acid, Response surface methodology.
3
1. INTRODUCTION
The establishment of bio-based industries capable of producing platform chemicals that can be converted into a significant number of high-value bioproducts is required to supplement petroleum as the main feedstock for fuel and chemical production (Pachapur et al., 2017). In this context, levulinic acid (LA), an intermediate compound which enables the use of catalytic conversion processes fully compatible with the actual chemical industry infrastructure, is now emerging as biofuel precursor (Kamm, 2007). The straightforward and relatively high LA yield production from acid treatment of both 5-carbon and 6-carbon sugars has received significant attention in the literature and has attracted interest from a number of large chemical industry firms (Bozell, 2010).
Levulinic acid (4-keto pentanoic acid), can be synthesized from different raw materials, such as monosaccharides (e.g. glucose, fructose), polysaccharides (e.g. cellulose, starch) and precursor compounds, such as furfural and 5-hydroxymethylfurfural (5-HMF). Techno-economic evaluation of LA bio-production carried out by different researchers has shown that low-cost substrates are compulsory to ensure its viability since the cost of raw feedstock is the largest contributor to the total operating cost (59-75%) (Han et al., 2014; Sen et al., 2012). In this context, lignocellulosic biomass containing cellulose (40-50%), hemicellulose (25-35%) and lignin (15-20%) would be a promising commodity (Morone et al., 2015). Thus, the
conversion of renewable lignocellulosic biomass to LA is the key step to provide an affordable and sustainable solution to the increasing demand of chemical intermediates (Carnaroglio et al., 2015).
Agro-based industries are experiencing a global expansion based on waste biomass and their by-products (e.g. low-value agro-industrial wastes, forestry residues, municipal organics, etc.) (Dhillon et al., 2013). However, waste biomasses arisen from these activities are not fully exploited. According to the Federation of Indian Chambers of Commerce and Industry report (2011), only about (30-40%) of food and beverage processing industrial wastes in Latin
America, Eastern Europe, Africa, and Asia (except Japan) were utilized for anaerobic digestion and rest (60-70%) was discharged in the environment without any treatment (Initiative, 2011). Gassara et al. estimated that utilization of agro-industrial wastes, such as fruit pomace, to obtain high added value bio-products was the least polluting option in terms of greenhouse gas (GHG) emissions in comparison to incineration, composting and landfill disposal (Gassara et
4
al., 2011). Utilization of these by-products for the biochemical production of LA would be promising to decrease their adverse environmental impact.
Traditionally, LA has been produced by dehydration and decomposition of cellulose and sugars by using mineral acids, releasing hexose and pentose sugars. Hexoses are
subsequently transformed into 5-HMF to form LA and formic acid (FA) (unavoidable by-product) (Galletti et al., 2012; Morone et al., 2015). However, when renewable lignocellulosic biomasses and agro-industrial wasted have been proposed as raw materials for LA production, further complications arise, as the breakdown of this these substances is more complicated in comparison with starch-feedstock due to the heterogeneous composition and the recalcitrant properties of several compounds, such as lignin (Bevilaqua et al., 2013, Victor et al., 2014) (E-Supplementary data for referenced works can be found in e-version of this paper online).
This drawback leads to a higher energy demand and increases in the production costs of the LA (Ahlkvist et al., 2013). Application of microwave dielectric heating technology
represents a promising alternative since it has been successfully exploited in the extraction of natural matrices and the hydrolysis of biopolymers (e.g. lactic and glycolic-acid production) (Carnaroglio et al., 2015). Microwave (MW) treatment offers interesting future perspectives over thermal treatments due to its compactness, rapid heating/cooling, high gas pressure, ease of control and reduced time of extraction. Thus, MW has widely accepted processing
technology for a variety of inorganic synthesis and it could be a good option for LA synthesis using agro-industrial wastes (Das et al., 2016a).
In pursuit of less expensive and readily available raw materials for LA synthesis, several highly abundant, carbon-rich organic waste residues and by-products derived from Canadian agro-industries have been evaluated in this research. In fact, Canada is one of the highest producers of agro-industrial wastes with major annual contributions of 30.4×10⁶ tons of brewery industry spent grain, 11×103 tons of apple industry solid waste, 21.9×10⁶ cubic meters of brewery industry liquid waste and 45.5×10³ cubic meters of apple industry ultrafiltration sludge production (Dhillon et al., 2013). In the particular case of
bio-valorization, Canadian energy policies prioritize the use of sustainable feedstock and biomass conversion to drive the national bio-based economy of bioenergy, biofuels, and bioproducts.
The aim of this study was to propose a solution for the valorization of agro-industrial wastes and to determine a rapid production technique for the production of LA. This study comprises following objectives: (a) exploration of five agro-industrial residues (i.e. brewery
5
liquid waste (BLW), brewery industry spent grains (BSG), starch industry waste (SIW), apple pomace solid waste (APS) and apple pomace ultrafiltration sludge (APUS)) to evaluate their potential for LA production, (b) evaluation of different acid catalysed hydrolysis techniques to select the more promising one for LA production, (c) optimization of process parameters (i.e. substrate concentration, acid concentration, reaction time and temperature) by means of response surface methodology (RSM) to enhance LA production of the screened substrate(s).
2. MATERIALS AND METHODS 2.1 Chemicals and other materials
Chemicals, such as HCl (36.5–38 w/w %), NaOH, acetone, methanol, acetonitrile, and NH4OH were purchased from Fisher Scientific (Ontario, Canada). Furfural, 5-HMF, LA,
syringaldehyde, glucose, xylose, galactose, and fructose were purchased from Sigma Aldrich, USA. All standards used for current investigation were of analytical grade.
2.2 Substrate procurement and preparation
Five lignocellulosic biomass samples generated from the agro-industrial waste across Canada, i.e., brewery industry spent grains (BSG), brewery liquid waste (BLW), starch industry wastewater (SIW), apple pomace solid waste (APS) and apple pomace ultrafiltration sludge (APUS) were screened and selected prior to LA production. BSG is the residue left after separation of wort in brewery industry. BLW is a complex mixture of surplus yeast and plant residues (remaining fine particle BSG and spent hops) in a semi-solid state, and it is collected during tank wash at the final stage after the second fermentation. The substrates used in this study were generously provided by La Barberie Microbrasserie Coopérative de Travail (Québec, Canada) (BLW and BSG), AMD Ogilvie (Candiac, Canada) (SIW) and Lassonde Industries Inc. (Rougemont, Canada) (APS and APUS). BLW, SIW, and APUS were received as semi-solid substrates, while BSG and APS were in the solid state.
2.3 Physical and chemical characterization tests
The objective was to characterize, compare and screen out the best suitable agro-industrial waste (substrate/feedstock) in terms of total organic carbon for LA production. The agro-industrial wastes (BLW, BSG, SIW, APS, and APUS) were ground to fine particles using
6
a grinder, screened through a mesh (3.35 mm diameter), heat dried (60 °C for 72 h) and stored in plastic bags for different analysis.
Samples were characterized in Table 1 by ash content, pH, total organic carbon (TOC), total organic nitrogen (TON) and for micronutrients (E-Supplementary data for this
characterization can be found in e-version of this paper online). For pH measurement, 1 g of organic waste in powder form was dissolved in 10 mL of distilled water and pH was recorded using a pH-meter (Das et al., 2016b). The TOC and TON were analyzed with dried agro-industrial wastes using a C:H: N:S analyzer (Das et al., 2016b). The estimation of TOC and TON was carried out using C:H: N:S analyzer ((CHNS-932, LECO Corporation, USA). The micronutrients were analyzed by using Inductively Coupled Plasma -Atomic Emission
Spectroscopy ICP-AES (Varian VISTA-AX, CCD simultaneous ICP-AES, USA) (Sarma et al., 2013).
Glucose, fructose, galactose, xylose, LA, 5-HMF and furfural produced during hydrolysis were identified by liquid chromatography-mass spectrometry (LC-MS) and liquid chromatography-tandem mass spectrometry (LC/MS-MS) (Biobasic-18, Agilent Technologies, USA) equipped with a biobasic-18 column (5µm, 250×4.6 mm ID). Before injecting the sample in LC/MS-MS for products analysis, the sample was centrifuged for 5 minutes at 7650×g and the supernatant was filtered by 0.45 µm syringe filter. Phenylethanol-D5 was used as internal standard for analysis. Methanol: water (8:2) and acetonitrile: water (8.5:1.5) were used to dilute the sample before analyzing the inhibitors and carbohydrates. All data presented were average values from duplicate runs for triplicate samples. The standard deviation for each data has been calculated with respect to the average (mean) value from duplicate runs for triplicate samples.
Total reduced sugar (TRS) was determined by the dinitrosalicylic acid method using glucose as the standard (Miller, 1959). The amount of TRS extracted from hydrolyzed substrates was determined by UV-visible spectrophotometer (Cary-50, Varian) using 3,5-dinitrosalicylic acid as the reagent (DNS method) at 540 nm.
2.4 Hydrolysis techniques for LA production
Each dried waste biomass was pre-treated by using two different hydrolysis techniques: (1) Brønsted acid catalyzed method by means of an autoclave: 0.5 M HCl at 121 ± 1ºC for 40 minutes, 40 g/L substrate concentration and 16 ± 0.2 psi (Tuttnauer autoclave, USA) and (2)
7
Brønsted acid catalyzed method through microwave digestion: 0.1 M HCl at 121 ± 1ºC for 25 minutes, 13.6 psi and 1000 W (Perkin Elmer/Anton Paar Multiwave digester). The volume of the reactor was fixed to 10 ml. Based on the preliminary results obtained, further optimization of different parameters (i.e. substrate concentration, acid concentration, time and temperature) related to the most promising hydrolysis technique (i.e. microwave-assisted hydrolysis) was carried out.
2.5 Substrate selection
The pre-screening process was developed by microwave-assisted Brønsted acid-catalyzed hydrolysis at 140 ± 1 °C for 60 minutes in microwave digestion system with a feedstock mass concentration of 40 g/L. The microwave digestion system (Microwave Digestion System, Perkin Elmer Multi-wave) was applied at 1000 W, and 2 M HCl was used as a homogeneous mineral acid solution. Each run was performed in triplicates. Reaction parameters were chosen as an approximate guide based on previous works done by other authors (E-Supplementary data for previous works can be found in e-version of this paper online). Nevertheless, choice of hydrolysis treatment and its severity might differ based on the heterogeneity and complexity of the substrate (Morone et al., 2015). The substrate(s) achieving a higher production of LA were used for further parameter optimization by response surface methodology (RSM) for hyper-production of LA. Glucose and 5-hydroxymethylfurfural (5-HMF) content was also taken into account since they are starting molecules for LA synthesis via one-pot acid catalyst from lignocellulosic biomass.
2.6 Experimental design and LA production optimization through RSM
Transformation of lignocellulosic renewable feedstock into LA is influenced by the interaction of several operational variables. Determination of the optimum point can be achieved with a limited number of experiments through statistical analysis. Response surface methodology (RSM), a compilation of mathematical and statistical techniques, can be used to interpret and evaluate the combined effects of all the factors in the hydrolysis process (Zhang et al., 2015). The central composite design was applied to investigate LA production
(dependent variable) as a function of four independent variables: reaction time (A), acid concentration (B) temperature (C) and feedstock concentration (D). Design-Expert-7 software (Stat-Ease Inc. Minneapolis, MN) was used to construct the experimental design and the
8
design has been extended up to +α and –α level are given in Table 2a. The experimental design resulted in a set of 30 experiments, comprising three different code levels (low (-1), middle (0) and high (+1)). The ranges of the variables investigated and responses of previously selected substrate samples (i.e. BSG and BLW) in terms of LA production are given in Table 2b. Other factors, such as the type of acid used, also play an important role during hydrolysis step; in general, the most common procedure for the hydrolysis of agro-industrial waste compounds entails the use of mineral acids. Regarding the selection of most suitable mineral acid, there are many studies reported showing the higher selectivity achieved when HCl is used in comparison with sulphuric acid (H2SO4) (Ahlkvist et al., 2013). Cha and Hanna observed that HCl showed
higher reactivity in comparison to H2SO4, corresponding to the higher strength of its primary
dissociation constants (Cha and Hanna, 2002). Besides H2SO4 addition could clog the reactor
owing to calcium sulfate deposition (Ca concentration for proposed feedstock was in the range of 11-311 g/kg), (Dussan et al., 2014; Gassara et al., 2011). Heterogeneous acid catalysts (e.g. amberlites and zeolites) were discarded taking into account the water-insoluble biomass content contained in the potential substrates.
A quadratic polynomial equation (Eq. 1) was proposed to interlink the effects of the four independent variables on LA production as follows:
p odu tion + n i i
i + ni ii i + n- i n i+ i i (Eq. 1) where, LAproduction is the dependent variable; Yi and Yj are the independent variables (n = 4 (A,
B, C, and D)); X0 is the intercept constant and Xi, Xii and Xij correspond to the regression
coefficients.
The same software (Design-Expert®-7) employed for the test-matrix design was used to check the experimental responses obtained. An analysis of variance (ANOVA report) was performed to fit the quadratic polynomial equations for the selected LA hyper-producing substrate(s). Final values of code factors (A, B, C, D, A2, B2, C2, D2 etc.) were considered to be statistically significant at p < 0.05. The quality of the model fit was evaluated by the coefficient of determination (R2) and the adjusted coefficient of determination (R2Adj).
The levulinic acid yield based on the weight of the raw material was calculated as (Eq. 2): ield o levulini a id x evulini a id e ove ed a te ea tion g
subst ate a ount g (Eq. 2)
9
3.1 Hydrolysis of agro-industrial waste to LA production
During HCl catalyzed thermal-hydrolysis, cellulose and hemicellulose are degraded into hexoses and pentoses (e.g. glucose, xylose, etc.), key intermediates in the production of LA. The fundamental mechanism which enables this chemical transformation is the hydrolysis of cellulose and hemicellulose to carbohydrates and subsequent selective dehydration and rehydration to various organic compounds, such as furfural, 5-HMF, LA and formic acid, among others (Choudhary et al., 2013). Hexoses are primarily dehydrated to 5-HMF, which is accelerated by Brønsted acid catalysts, and thereupon 5-HMF is rehydrated into LA as shown in Figure 1, with a theoretical yield of 64.5% due to the conjoint formic acid formation (Tarabanko et al., 2008). Pentose molecules produced via hemicellulose hydrolysis, such as xylose, can also be transformed into LA, but several separation steps are compulsory, as shown in Figure 1. This multi-process includes xylose dehydration to furfural, which is converted to furfuryl alcohol (via gas phase hydrogenation step) and finally to LA by the opening of a hydrolytic ring (Hu et al., 2013).
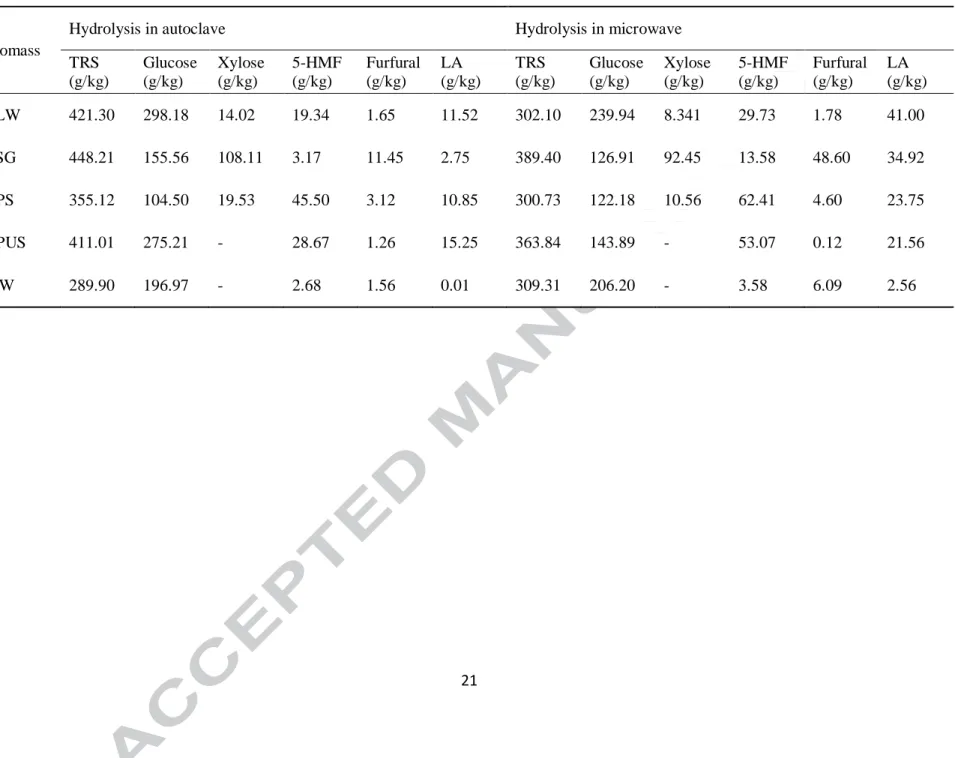
Thus, each biomass considered for current investigation has been subjected to acid catalyzed hydrolysis as mentioned above. A thorough investigation of different sugar monomers and their by-products were analyzed and are reported in Table 3. Acid-catalyzed hydrolysis using autoclave resulted in LA production of 11.52, 2.75, 10.85, 15.25 and 0.01 g/kg, and 421, 398, 355, 411 and 289 g/kg of total reducing sugar from BLW, BSG, APS, APUS, and SIW, respectively. Comparatively higher amount of LA production was observed when the same experimental condition was applied in microwave assisted hydrolysis. For example, an increase in LA by 3.6 fold for BLW and 12.7 fold for BSG was obtained in comparison to previous operated autoclave conditioned hydrolysis. Thus, reduction in total reducing sugar concentration together with the enhanced concentration of 5-HMF, and LA implied that microwave assisted hydrolysis was more promising for LA production over the other alternative.
3.2 Screening of agro-industrial waste for LA production
Due to the heterogeneous composition of the materials under study and the recalcitrant properties of lignin contained therein, the breakdown of lignocellulosic biomass is more complicated and harsher conditions were necessary for its conversion to sugars and
10
subsequently to LA(Ahlkvist et al., 2013). Thus, to enhance LA production using microwave assisted hydrolysis, the temperature was increased to 140 ± 1 °C and acid concentration to 2 M (Table 4). LA production of 204, 160, 66, 49 and 12 g/kg was reported for BLW, BSG, APS, APUS, and SIW, respectively, with decreasing concentration of total reducing sugar compared to previously discussed microwave assisted hydrolysis conditions, as shown in Figure 2. It could be observed that LA production was enhanced by 5.0 fold in BLW, 4.6 fold in BSG, 2.8 fold in APS, 2.3 fold in APUS and 4.7 fold in SIW using current experimental condition. LA production from BLW and BSG was comparatively higher among the five biomass considered for further investigation. Thus, production of LA strongly depended on the process condition as well as the nature of agro-industrial waste. Furthermore, it was also evident from Table 3 that together with total reducing sugars, other precursors present in the reaction mixture, such as furfural and 5-HMF, could be further converted to LA upon optimization of process parameters.
Accordingly, BSG and BLW were selected for further optimization tests of reaction time, HCl concentration, feedstock concentration and temperature for higher LA production. In the case of BSG, xylose depletion (Table 4) was attributed to the presence of HCl, since
Brønsted acids were recognized as relevant factors for the selective conversion of xylose into furfural (Chamnankid et al., 2014).
3.3 Optimization of process parameters to enhance LA production using RSM
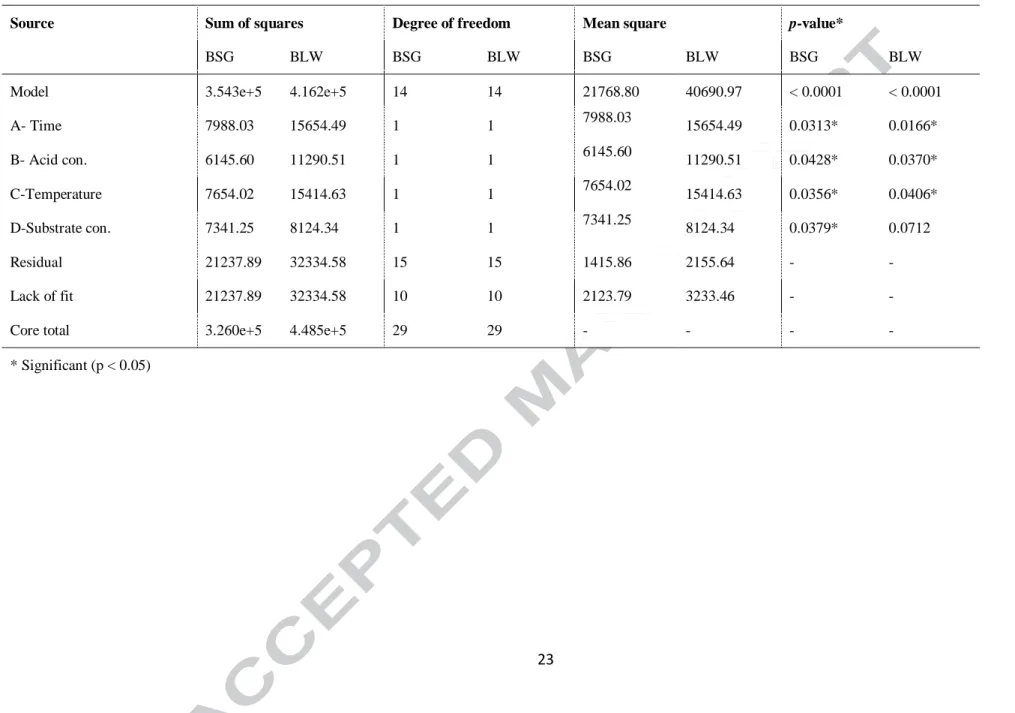
The responses (LA production from BLW and BSG samples) obtained for different runs of experiments carried out using four independent variables (reaction time (A), acid concentration (B) temperature (C) and feedstock concentration (D)) have been presented in Table 5. The model was highly significant (p < 0.0001) for the observed responses of LA production from both BLW and BSG. In fact, smaller the magnitude of p (p < 0.05), the more significant the corresponding factor. Based on this criterion, time (A), HCl concentration (B) and temperature (C) showed a significant effect (p < 0.05) in LA production. On the other hand, substrate concentration (D) presented a less significant effect on LA production in the considering range in case of BLW. The quadratic terms of all the independent variables for the quadratic terms (time, temperature, HCl and substrate concentration) showed a highly
significant negative effect on LA production (p < 0.0001), indicating that it could be a limiting factor and its variation could lower LA production. Corresponding equations to predict LA
11
production using BSG (Eq. 3) and BLW (Eq. 4) wastes in terms of real factors are as follows (Eq. 3-4):
BSG sample (Eq. 3):
LA production = – 1960 + 23.60 × Time + 184.96 Acid conc. + 15.57 × Temperature + 6.39 × Substrate conc. –0.421 × Time × Acid conc.– 0.011 × Time × Temperature + 0.028 ×
Temperature ×Acid conc. +0.061× Acid conc. × Substrate conc. – 4.27 × Temperature ×
Substrate conc. – 0.377 Time2– 14.63 Acid conc.2–0.043 Temperature2-0.036 Substrate conc.2 (Eq. 3)
BLW sample (Eq. 4):
LA production = – 2053.32 + 19.00 × Time + 205.89 × Acid conc. + 16.41 × Temperature + 8.53 × Substrate conc. + 0.043 × Time × Acid conc. – 0.022 × Time ×Temperature. + 0.011 Time × Substrate conc. – 0.25 × Temperature × Acid conc. + 0.065× Acid conc. × Substrate con. – 5.37 × Temperature × Substrate conc. - 0.395 Time2–17.96 Acid conc.2–0.05
Temperature2–0.056 Substrate conc.2
The coefficient of acid concentration (184.96 and 205.89) was much higher than the other ones, indicating that the quadratic effect of the acid in the studied range had a dominant effect on LA production in comparison to other parameters. The next dominant effect was time (23.60 and 19.00), followed by temperature and substrate concentration. The goodness of the model adjusted for the range of variables posed was checked by the determination coefficient (R2). In both models, R2 values higher than 0.93 indicated that 93% variations in LA
production can be well explained by the model. The adjusted R2 value higher than 93% indicated that experimental and predicted values fit correctly. LA production ranged from about 31.1 g/kg to a maximum of 341.1 g/kg for BSG residue, while it oscillated from 42.9 g/kg to 409.3 g/kg for BLW waste.
Figure 3 (I, II, III, IV, V, VI) and Figure 4 (I, II, III, IV, V, VI) show the response surface plots and the corresponding contour plot of the quadratic model developed for BSG and BLW, respectively. Each figure consists of six graphs, where one different variable is kept at a constant level and the other two vary with the experimental values chosen. Therefore, the relationship between LA production and experimental levels of each variable and interactions between the remaining two independent terms are visually observed. The shapes of the plots are related to the intensity of interactions between the independent terms (Zhang et al., 2015).
12
In this case, the three-dimensional surface diagram given for both substrates indicated strong interactions between them. Additionally, a local optimum point was defined for each case in the experimentally investigated range, which indicated that LA production was sensitive to modifications in the independent variables values.
Regarding the optimized parameters, the utilization of microwave heating allowed 50% reduction in processing time from >1 h to less than 30 min. Apart from reduction of process time, the heating method has not offered additional improvements (e.g. acid concentration reduction) according to existing literature (Szabolcs et al., 2013). Regarding HCl
concentration, LA production reached a maximum of 4.5 M HCl for both substrates and then decreased rapidly with the further rise of the acid concentration (Fig. 3 and Fig. 4). This performance was not noticed in previous works, which might be related to the fact that
optimum HCl concentration was not attained (Shen & Wyman, 2012). Victor et al. observed a considerable increase in the LA production from 4.7 to 19.8% as the HCl concentration was increased from 1 to 5 M (Victor et al., 2014). Even in these cases, the addition of excess catalyst should be limited due to corrosion of industrial installations and the potential desorption of HCl from the reaction mixture to the atmosphere (Dussan et al., 2014).
Enhanced LA production has been previously reported in the literature with increasing temperatures. Depending on the nature of the substrate, process condition up to 225°C has been applied for enhanced LA production (Tabasso et al., 2014). These authors reported the successful conversion of postharvest tomato plants into LA via an MW-assisted flash reaction under mildly acidic conditions (HCl 1 M). For the current investigation, enhanced LA product was recorded with an increase in temperature from 120°C to 160°C, as shown in Figures 3 and 4. Based on the results obtained, a temperature setting of 160 ± 1°C was chosen, which could prevent the sharp decrease of LA (dehydration with undesired by-products) when reaction temperature was above 170°C (Szabolcs et al., 2013).
A substrate concentration of 85 g/L resulted in maximum LA production from BSG and BLW samples, which could be considered a higher substrate concentration in comparison with typical substrate concentrations (25 – 50 g/L) proposed by other authors (Omari et al., 2012; Szabolcs et al., 2013; Victor et al., 2014). Despite elevated carbohydrate loading is not recommended as it has an adverse effect on LA yield in the reaction mixture (Ahlkvist et al., 2013), the result obtained in this study and by Bevilaqua et al. (100 g/L for a LA final concentration of 59.4 g/kg) have demonstrated that optimization of the process could lead to
13
the implementation of parameter values different from the general guideline set out by the literature (Bevilaqua et al., 2013).
3.4 Levulinic acid production from brewery industry wastes (BLW & BSG) _ Canadian context
The brewing sector holds a strategic position in the food industry. In 2002, the annual global beer production exceeded 1.34 billion hectolitres(Fillaudeau et al., 2006). About 3.5– 4.4 L of water is required as brewing water per each liter of beer produced, while contaminated wastewaters constitute approximately 25% of the total volume of water consumed (Fillaudeau et al., 2006; Mielcarek et al., 2013). Brewe ’s spent g ain o the e entation p o ess is the most abundant brewing by-product, corresponding to around 85% of the total residues
generated. Normally, during beer production, around 14 kg of spent grain is generated per hectolitres of beer (Fillaudeau et al., 2006). Currently, it is only sold or given free as an animal feedstock (low-value product) to reduce costs and provide a minimally added revenue
(Mussatto et al., 2013). Hence, the sanitation of wastewater effluent and efficient management of spent grain or trub (protein and hops left in the kettle) accumulated during beer production is a real challenge of social, environmental and economic value in this region. The present study demonstrates the potential of BLW and BSG for high LA production (409 g/kg and 341 g/kg) by means of microwave-assisted HCl-catalysed thermal hydrolysis without prior special pre-treatment. Thus, current results could lead to the approximately annual production of raw LA of around 83.4×10⁶ tons from BLW and 30.4×10⁶ tons from BSG, respectively in Canada. The valorization of agro-industrial wastes into LA production will minimize environmental
problems caused due to landfilling (e.g. malodor, animal pests, etc.). A comparison with LA production values obtained by other researchers using other alternative agro-industrial wastes and forestry residues shows strong support for feedstocks such as BLW and BSG.
Chemical synthesis of LA resulted in slow commercial applications over the years due to expensive raw materials. Investment in LA research is increasing and exploring alternative feedstock in LA production. Different researchers have identified the cost of traditional feedstock as the major contributor with around (59-75%) to the total operating cost. The availability and market price of agro-industrial waste can range from 0.10-0.25% in comparison to the price of glucose. The replacement of traditional substrate (2-4% of total
14
cost) with alternative agro-industry waste can bring down the total cost of bioconversion of 1 kg of BLW into LA production by around 20-40%.
4. CONCLUSIONS
The use of agro-industry wastes as a possible sustainable feedstock for production of LA was successfully demonstrated with brewery liquid waste, giving a 30-40% increase in the yield. Maximum LA production of 409 ± 2 g/kg for BLW was obtained at optimized MW conditions at 160°C, 4.5M HCl, 85 g/L substrate concentration, 27.5 min. Replacement of traditional feedstocks with the agro-industrial wastes can bring down the total operating cost of LA production from (59-75%) to 20-40%. The proposed MW technique can convert 30.42×10⁶ tons of brewery industry waste into 83.43 × 10⁶ tons into LA production annually across Canada. The results from this study projects to increase the productivity of agro-industry wastes, decrease the waste management cost and bridge the gap between agro-industry with the biobased economy. This study intends to bio-valorise agro-industry wastes into platform
chemicals to support a sustainable and to boost the commercial demand of LA.
("E-supplementary data for this work can be found in e-version of this paper online") Acknowledgments
Financial support from the Natural Sciences and Engineering Research Council of Canada (NSERC, Discovery Grant), MAPAQ (No. 809051), Ministère des Relations Internationales du Québec (coopération Paraná-Québec 2010–2012; Quebec-Vietnam 2012-2015) and the Centre de Recherche Industrielle du Québec (CRIQ) as financial assistance is sincerely acknowledged. The authors are also thankful to “Post-Doctoral merit scholarship program for foreign students FQRNT ” o inan ial assistan e to Vinayak ax an Pa hapu .
References
1. Ahlkvist, J., Ajaikumar, S., Larsson, W., Mikkola, J.-P. 2013. One-pot catalytic conversion of Nordic pulp media into green platform chemicals. Applied Catalysis A: General, 454, 21-29.
2. Bevilaqua, D.B., Rambo, M.K., Rizzetti, T.M., Cardoso, A.L., Martins, A.F. 2013. Cleaner production: levulinic acid from rice husks. Journal of cleaner production, 47, 96-101. 3. Bozell, J.J. 2010. Connecting Biomass and Petroleum Processing with a Chemical Bridge.
15
4. Carnaroglio, D., Tabasso, S., Kwasek, B., Bogdal, D., Gaudino, E.C., Cravotto, G. 2015. From Lignocellulosic Biomass to Lactic and GlycolicAcid Oligomers: A Gram Scale Microwave Assisted Protocol. ChemSusChem, 8(8), 1342-1349.
5. Cha, J.Y., Hanna, M.A. 2002. Levulinic acid production based on extrusion and pressurized batch reaction. Industrial Crops and Products, 16(2), 109-118.
6. Chamnankid, B., Ratanatawanate, C., Faungnawakij, K. 2014. Conversion of xylose to levulinic acid over modified acid functions of alkaline-treated zeolite Y in hot-compressed water. Chemical Engineering Journal, 258, 341-347.
7. Choudhary, V., Mushrif, S.H., Ho, C., Anderko, A., Nikolakis, V., Marinkovic, N.S., Frenkel, A.I., Sandler, S.I., Vlachos, D.G. 2013. Insights into the interplay of Lewis and Brønsted acid catalysts in glucose and fructose conversion to 5-(hydroxymethyl) furfural and levulinic acid in aqueous media. Journal of the American Chemical Society, 135(10), 3997-4006.
8. Das, R.K., Brar, S.K., Verma, M. 2016b. Potential use of pulp and paper solid waste for the bio-production of fumaric acid through submerged and solid state fermentation. Journal of cleaner production, 112, 4435-4444.
9. Das, R. K., Brar, S. K., Verma, M. 2016a. Application of calcium carbonate nanoparticles and microwave irradiation in submerged fermentation production and recovery of fumaric acid: a novel approach. RSC Advances, 6(31), 25829-25836.
10. Dhillon, G.S., Kaur, S., Brar, S.K. 2013. Perspective of apple processing wastes as low-cost substrates for bioproduction of high value products: A review. Renewable and Sustainable Energy Reviews, 27, 789-805.
11. Dussan, K.J., Silva, D.D.V., Moraes, E.J.C., Arruda P.V., Felipe M.G.A. 2014. Dilute-acid hydrolysis of cellulose to glucose from sugarcane bagasse. Chemical Engineering
Transactions, 38, 433-438.
12. Fillaudeau, L., Blanpain-Avet, P., Daufin, G. 2006. Water, wastewater and waste management in brewing industries. Journal of cleaner production, 14(5), 463-471. 13. Galletti, A.M.R., Antonetti, C., De Luise, V., Licursi, D., Nassi, N. 2012. Levulinic acid
production from waste biomass. BioResources, 7(2), 1824-1835.
14. Gassara, F., Brar, S., Pelletier, F., Verma, M., Godbout, S., Tyagi, R. 2011. Pomace waste management scenarios in Québec—Impact on greenhouse gas emissions. Journal of hazardous materials, 192(3), 1178-1185.
15. Han, J., Sen, S.M., Alonso, D.M., Dumesic, J.A., Maravelias, C.T. 2014. A strategy for the simultaneous catalytic conversion of hemicellulose and cellulose from lignocellulosic biomass to liquid transportation fuels. Green Chemistry, 16(2), 653-661.
16. Hu, X., Song, Y., Wu, L., Gholizadeh, M., Li, C.-Z. 2013. One-pot synthesis of levulinic acid/ester from C5 carbohydrates in a methanol medium. ACS Sustainable Chemistry & Engineering, 1(12), 1593-1599.
17. Initiative, G.M. 2011. Resource assessment for livestock and agro-industrial wastes–India. Retrieved January, 4, 2015.
18. Kamm, B. 2007. Production of platform chemicals and synthesis gas from biomass. Angewandte Chemie International Edition, 46(27), 5056-5058.
19. Kittiphoom, S., Sutasinee, S. 2015. Effect of microwaves pretreatments on extraction yield and quality of mango seed kernel oil. International Food Research Journal, 22(3), 960-964.
20. Miel a ek, ., Jan zukowi z, W., Ost owska, K., Jóźwiak, T., Kłodowska, I., Rodziewi z, J., Zieliński, M. 3. Biodeg adability evaluation o wastewate s o alt and bee production. Journal of the Institute of Brewing, 119(4), 242-250.
16
21. Miller, G.L. 1959. Use of dinitrosalicylic acid reagent for determination of reducing sugar. Analytical chemistry, 31(3), 426-428.
22. Morone, A., Apte, M., Pandey, R. 2015. Levulinic acid production from renewable waste resources: Bottlenecks, potential remedies, advancements and applications. Renewable and Sustainable Energy Reviews, 51, 548-565.
23. Mussatto, S.I., Moncada, J., Roberto, I.C., Cardona, C.A. 2013. Techno-economic analysis o b ewe ’s spent g ains use on a bio e ine y on ept: the B azilian ase. Bioresource technology, 148, 302-310.
24. Omari, K.W., Besaw, J.E., Kerton, F.M. 2012. Hydrolysis of chitosan to yield levulinic acid and 5-hydroxymethylfurfural in water under microwave irradiation. Green Chemistry, 14(5), 1480-1487.
25. Pachapur, V., Sarma, S., Maiti, S., Brar, S. 2017. Case Studies on the Industrial Production of Renewable Platform Chemicals. in: Platform Chemical Biorefinery, Elsevier, pp. 485-493.
26. Sarma, S.J., Brar, S.K., Le Bihan, Y., Buelna, G., Soccol, C.R. 2013. Hydrogen production from meat processing and restaurant waste derived crude glycerol by anaerobic
fermentation and utilization of the spent broth. Journal of Chemical Technology and Biotechnology, 88(12), 2264-2271.
27. Sen, S.M., Henao, C.A., Braden, D.J., Dumesic, J.A., Maravelias, C.T. 2012. Catalytic conversion of lignocellulosic biomass to fuels: Process development and technoeconomic evaluation. Chemical Engineering Science, 67(1), 57-67.
28. Shen, J., Wyman, C.E. 2012. Hydrochloric acid‐ catalyzed levulinic acid formation from cellulose: data and kinetic model to maximize yields. AIChE Journal, 58(1), 236-246. 29. Szabolcs, Á., Molnár, M., Dibó, G., Mika, L.T. 2013. Microwave-assisted conversion of
carbohydrates to levulinic acid: an essential step in biomass conversion. Green Chemistry, 15(2), 439-445.
30. Tabasso, S., Montoneri, E., Carnaroglio, D., Caporaso, M., Cravotto, G. 2014. Microwave-assisted flash conversion of non-edible polysaccharides and post-harvest tomato plant waste to levulinic acid. Green Chemistry, 16(1), 73-76.
31. Tarabanko, V.E., Chernyak, M.Y., Smirnova, M.A. 2008. Sodium Hydrosulfate as the Catalyst for Carbohydrate Conversion into the Levulinic Acid and 5-Hydroxymetylfurfural Derivatives. Журнал Сибирского федерального университета. Серия: Химия, 1(1), 35-49.
32. Victor, A., Pulidindi, I.N., Gedanken, A. 2014. Levulinic acid production from Cicer arietinum, cotton, Pinus radiata and sugarcane bagasse. RSC Advances, 4(84), 44706-44711.
33. Zhang, Y., Gao, X., Liu, J., Ge, Y. 2015. Pilot production of Clonostachys rosea conidia in a solid state fermentor optimized using response surface methodology. Engineering in Life Sciences, 15(8), 772-778.
17
Figure captions
Figure 1: Mechanism of formation of furan derivation microbial inhibitors and organic acids upon Brønsted acids catalyzed hydrolysis.
Figure 2:Total reducing sugar (TRS) vs. levulinic acid (LA) production during microwave assisted hydrolysis using two different process condition (a) 121 °C, 40 g/L substrate
concentration, 0.5 (M) acid concentration using 1 h; (b) 140 °C, 40 g/L substrate concentration, 2 (M) acid concentration using 1 h. BLW: Brewery liquid waste; BSG: Brewery spent grain; APS: Apple pomace solid waste; APUS: Apple pomace ultrafiltration sludge, SIW: Starch industry wastewater.
Figure 3. Response surface plots of the levulinic acid production when brewery spent grain (BSG) was used: Response surface as a function time (A) and HCl concentration (B) (I); response surface as a function of time (A) and temperature (C) (II); response surface as a function of substrate concentration (C) and time (A); (IV) response surface as a function of temperature (C) and acid strength (B); (V) response surface as a function of substrate concentration (D) and acid strength (B); (VI) response surface as a function of substrate concentration (A) and temperature (C).
Figure 4. Response surface plots of the levulinic acid production when brewery liquid waste (BLW) was used: Response surface as a function time (A) and HCl concentration (B) (I); response surface as a function of time (A) and temperature (C) (II); response surface as a function of substrate concentration (C) and time (A); (IV) response surface as a function of temperature (C) and acid strength (B); (V) response surface as a function of substrate concentration (D) and acid strength (B); (VI) response surface as a function of substrate concentration (A) and temperature (C).
18 Table 1. Physicochemical characterization of screened agro-industrial wastes.
Components
Brewery Industry waste Apple Industry waste
SIW BSG
BLW
APS APUS
Surplus yeast Spent hops
pH 5.2 ± 0.1 5.4 ± 0.1 5.1 ± 0.1 3.2 ± 0.1 3.4 ± 0.1 3.3 ± 0.2
Total Solid (g/L) - 229.4 ± 1.5 - 384.5 ± 2.4 16.40 ± 0.15
Ash Content (%) 7.79 ± 0.65 8.947 ± 1.34 - 4.71 ± 0.53 2.55 ± 0.78 3.55 ± 0.94
Extractive (%) 3.53 ± 0.42 5.733 ± 0.56 - 3.12 ± 0.78 2.85 ± 0.23 1.24 ± 0.74
Carbohydrates (%, W/dry weight) - 36-42 ± 1.45 40.0 ±
0.5 66.0 ± 1.7 56.2 ± 1.3 -
Crude fiber (%) - 3 ± 1.5 26.5 ± 2.4 33.45 - -
Cellulose (W/dry weight) 17.10 ± 0.97 - 13.2 ± 1.3 11.80 ± 1.78 -
Hemicellulose (W/dry weight) 32.50 ± 1.45 - 0.80 ± 0.06 - -
Lignin (W/dry weight) 13.4 ± 1.9 - 23.50 ± 2.13 20.56 ± 2.56 -
Starch(W/dry weight) 12.5 ± 0.9 - - - - -
Glucose (g/kg) 1.57 ± 0.08 55.77 ± 1.34 - 35.55 ± 0.98 40.35 ± 1.76 1.25 ± 0.09
Fructose (g/kg) - - - 32.68 ± 1.67 30.68 ± 2.67 -
Galactose (g/kg) - 5.95 ± 0.89 - 3.88 ± 0.67 - -
19
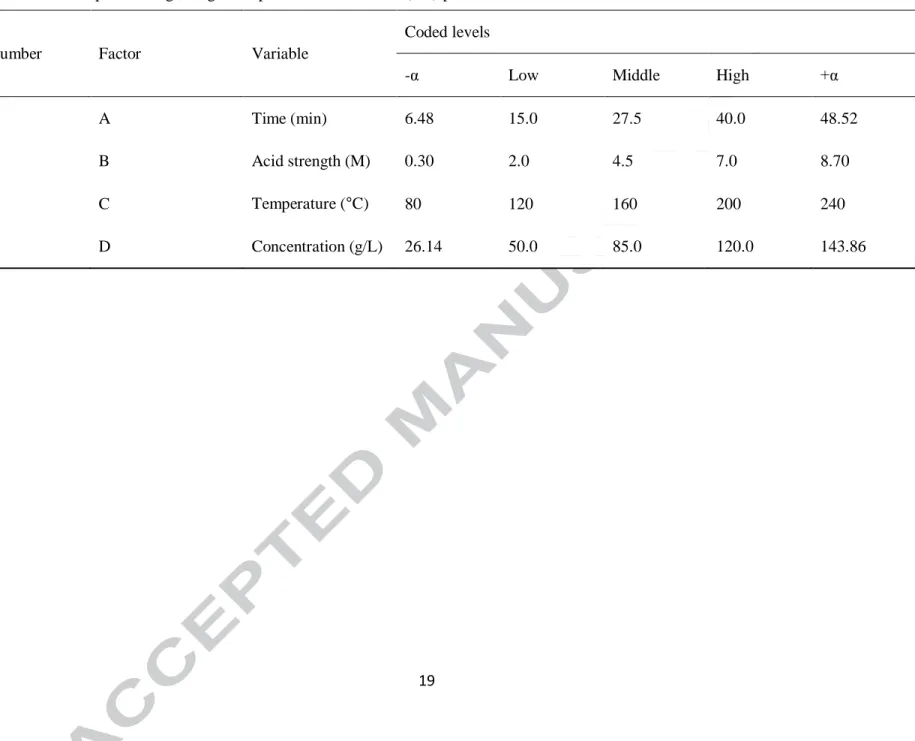
Table 2a. Central composite design ranges to optimize levulinic acid (LA) production.
Serial Number Factor Variable
Coded levels
-α Low Middle High +α
1 A Time (min) 6.48 15.0 27.5 40.0 48.52
2 B Acid strength (M) 0.30 2.0 4.5 7.0 8.70
3 C Temperature (°C) 80 120 160 200 240
20
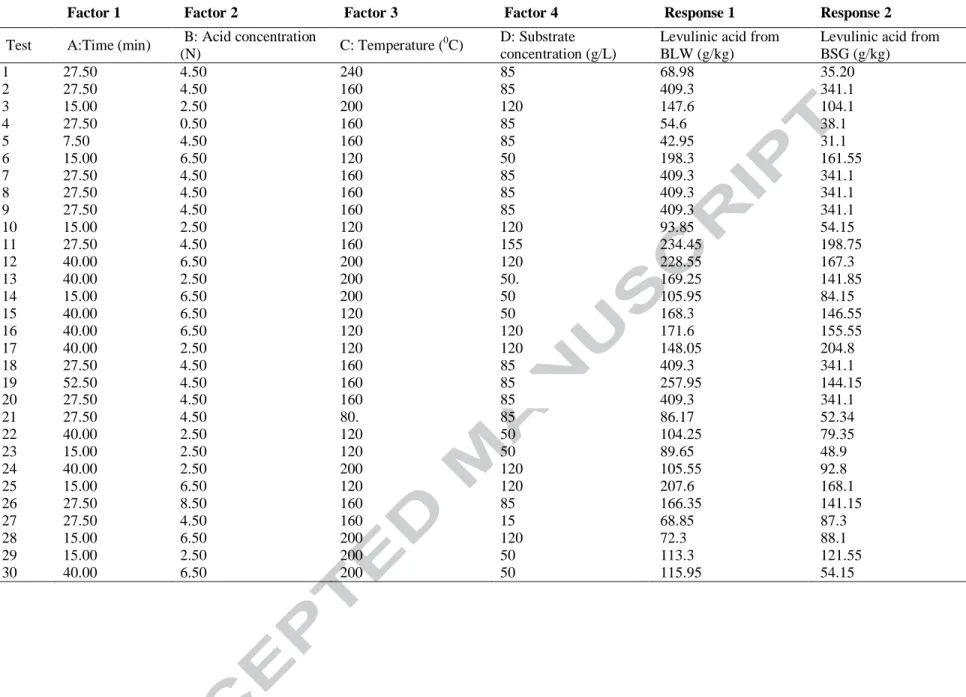
Table 2b. Experimental design and the responses obtained for brewery spent grain (BSG) and brewery liquid waste (BLW) feedstock cases.
Factor 1 Factor 2 Factor 3 Factor 4 Response 1 Response 2
Test A:Time (min) B: Acid concentration
(N) C: Temperature (
0
C) D: Substrate
concentration (g/L)
Levulinic acid from BLW (g/kg)
Levulinic acid from BSG (g/kg) 1 27.50 4.50 240 85 68.98 35.20 2 27.50 4.50 160 85 409.3 341.1 3 15.00 2.50 200 120 147.6 104.1 4 27.50 0.50 160 85 54.6 38.1 5 7.50 4.50 160 85 42.95 31.1 6 15.00 6.50 120 50 198.3 161.55 7 27.50 4.50 160 85 409.3 341.1 8 27.50 4.50 160 85 409.3 341.1 9 27.50 4.50 160 85 409.3 341.1 10 15.00 2.50 120 120 93.85 54.15 11 27.50 4.50 160 155 234.45 198.75 12 40.00 6.50 200 120 228.55 167.3 13 40.00 2.50 200 50. 169.25 141.85 14 15.00 6.50 200 50 105.95 84.15 15 40.00 6.50 120 50 168.3 146.55 16 40.00 6.50 120 120 171.6 155.55 17 40.00 2.50 120 120 148.05 204.8 18 27.50 4.50 160 85 409.3 341.1 19 52.50 4.50 160 85 257.95 144.15 20 27.50 4.50 160 85 409.3 341.1 21 27.50 4.50 80. 85 86.17 52.34 22 40.00 2.50 120 50 104.25 79.35 23 15.00 2.50 120 50 89.65 48.9 24 40.00 2.50 200 120 105.55 92.8 25 15.00 6.50 120 120 207.6 168.1 26 27.50 8.50 160 85 166.35 141.15 27 27.50 4.50 160 15 68.85 87.3 28 15.00 6.50 200 120 72.3 88.1 29 15.00 2.50 200 50 113.3 121.55 30 40.00 6.50 200 50 115.95 54.15
21
Table 3. Products of acid-catalyzed hydrolysis of different agro-industrial wastes using autoclave and microwave assisted experiments.
Biomass
Hydrolysis in autoclave Hydrolysis in microwave
TRS (g/kg) Glucose (g/kg) Xylose (g/kg) 5-HMF (g/kg) Furfural (g/kg) LA (g/kg) TRS (g/kg) Glucose (g/kg) Xylose (g/kg) 5-HMF (g/kg) Furfural (g/kg) LA (g/kg) BLW 421.30 298.18 14.02 19.34 1.65 11.52 302.10 239.94 8.341 29.73 1.78 41.00 BSG 448.21 155.56 108.11 3.17 11.45 2.75 389.40 126.91 92.45 13.58 48.60 34.92 APS 355.12 104.50 19.53 45.50 3.12 10.85 300.73 122.18 10.56 62.41 4.60 23.75 APUS 411.01 275.21 - 28.67 1.26 15.25 363.84 143.89 - 53.07 0.12 21.56 SIW 289.90 196.97 - 2.68 1.56 0.01 309.31 206.20 - 3.58 6.09 2.56
22
Table 4. Product yields of screened agro-industrial processing wastes using microwave-assisted homogeneous acid hydrolysis.
Feedstock TRS (g/kg) Glucose (g/kg) Xylose (g/kg) 5-HMF (g/kg) Furfural (g/kg) LA (g/kg)
BLW 123.10 34.10 ND 7.60 6.50 204.40
BSG 141.20 32.70 ND 8.20 48.20 159.70
APS 258.80 53.90 9.40 6.70 24.30 66.40
APUS 296.80 143.90 ND 12.60 8.40 49.50
23
Table 5. Analysis of variance (ANOVA) for the fitted quadratic polynomial model for brewery spent grains (BSG) and brewery liquid waste (BLW) feedstock
cases.
Source Sum of squares Degree of freedom Mean square p-value*
BSG BLW BSG BLW BSG BLW BSG BLW
Model 3.543e+5 4.162e+5 14 14 21768.80 40690.97 < 0.0001 < 0.0001
A- Time 7988.03 15654.49 1 1 7988.03 15654.49 0.0313* 0.0166* B- Acid con. 6145.60 11290.51 1 1 6145.60 11290.51 0.0428* 0.0370* C-Temperature 7654.02 15414.63 1 1 7654.02 15414.63 0.0356* 0.0406* D-Substrate con. 7341.25 8124.34 1 1 7341.25 8124.34 0.0379* 0.0712 Residual 21237.89 32334.58 15 15 1415.86 2155.64 - - Lack of fit 21237.89 32334.58 10 10 2123.79 3233.46 - -
Core total 3.260e+5 4.485e+5 29 29 - - - -
24
25
26
27
28
Highlights
1. Agro-industrial wastes as promising renewable feedstocks for levulinic acid production. 2. Microwave-assisted one-pot conversion of renewable feedstock to levulinic acid. 3. Screening of renewable feedstocks for optimization of levulinic acid production. 4. Optimization of process parameters for enhanced levulinic acid production.