OATAO is an open access repository that collects the work of Toulouse
researchers and makes it freely available over the web where possible
Any correspondence concerning this service should be sent
to the repository administrator:
[email protected]
This is a Publisher’s version published in: http://oatao.univ-toulouse.fr/22893
To cite this version:
Gavrielides, Andreas
and Duguet, Thomas
and Aufray, Maëlenn
and
Lacaze-Dufaure, Corinne
Model of the DGEBA-EDA Epoxy Polymer:
Experiments and Simulation Using Classical Molecular Dynamics. (2019)
International Journal of Polymer Science, 2019. 1-9. ISSN 1687-9422
Research Article
Model of the DGEBA-EDA Epoxy Polymer: Experiments and
Simulation Using Classical Molecular Dynamics
Andreas Gavrielides, Thomas Duguet
, Maëlenn Aufray, and Corinne Lacaze-Dufaure
CIRIMAT, CNRS, Université de Toulouse, 4 allée Emile Monso, BP44362, 31030 Toulouse Cedex 4, France Correspondence should be addressed to Thomas Duguet; [email protected]
Received 28 June 2018; Revised 15 November 2018; Accepted 17 December 2018; Published 13 February 2019 Academic Editor: Ulrich Maschke
Copyright © 2019 Andreas Gavrielides et al. This is an open access article distributed under the Creative Commons Attribution License, which permits unrestricted use, distribution, and reproduction in any medium, provided the original work is properly cited.
Polyepoxy samples are synthesized from diglycidylether of bisphenol A (DGEBA) and ethylene diamine (EDA) monomers at a stoichiometric ratio of 2 DGEBA : 1 EDA in model conditions in order to promote a high degree of polymerization and a low density of defects and to try to approach the ideal models obtained by simulation. A slow polymerization (>24 h at ambient temperature) and a postcuring achieved in an inert atmosphere lead to a conversion degree of 92 ± 2% and a midpoint glass transition temperature of 391 ± 1 K. In parallel, a model is created with a multistep cross-linking procedure. In this work, all-atom molecular dynamics (MD) simulations are performed with LAMMPS and the GAFF 1.8 forcefield. In the initial liquid mixture of reactants (600 molecules), proper mixing is demonstrated by the calculation of the partial radial distribution functions (RDF), which show a minimum intermolecular distance of 2.8 Å and similar distributions for EDA-EDA, DGEBA-DGEBA, and DGEBA-EDA molecules in the simulation boxes. Then, in alternation with MD equilibrations, cross-linking is performed on frozen configurations by creating covalent bonds between reactive pairs within a reaction radius of 3 Å. The resulting boxes show conversion rates of 90-93% and densities close to the experimental value. Finally, a cooling ramp from 700 K to 25 K is applied in order to monitor the specific volume and the coefficient of volumetric thermal expansion (CVTE) of the polymer and to derive the glass transition temperature. Experimental thermomechanical analyses (TMA) compares well with simulations for both the specific volume and the CVTE evolutions with temperature. Whereas the uncertainty remains high with the fitting procedure used, we calculate a glass transition temperature of 390 ± 8 K which compares very well with the experimental values (391 ± 1 K from DSC and 380 K from TMA).
1. Introduction
One of the great challenges in computational chemistry is to derive the physical, mechanical, and thermodynamic proper-ties of solids and especially of polymers. In recent years, poly-mers have been implemented in a variety of applications, from medicine to space industries [1–5]. Therefore, it is of great importance to investigate their network structures and properties in order to engineer their bulk and surface proper-ties efficiently.
Thermosetting polymers of the polyepoxy family are widely used in applications in the areas of aeronautics and space, luxury, and sports. They exhibit superior thermal and mechanical properties when compared to other poly-mers, and thus are used as the matrix in composite materials
(e.g., carbon fiber/epoxy). Unfortunately, such composites lack a variety of properties desirable for many components, such as electrical and thermal conductivities. Surface functio-nalization through metallization is then necessary, but it still represents a challenge [6, 7]. A better knowledge of polye-poxy surfaces would be afirst step towards the understanding of surface phenomena occurring during metallization.
Thefirst step before the development of a surface model is to obtain a bulk polyepoxy polymer model cross-linked in a simulated chemical process. Molecular dynamics (MD) has proven its ability to achieve thermodynamically accurate bulk epoxy models and to derive thermodynamic and struc-tural properties. To obtain the bulk models, cross-linking processes that have been used computationally can be classi-fied into two categories:
Volume 2019, Article ID 9604714, 9 pages https://doi.org/10.1155/2019/9604714
(1) Cross-linking and Monte-Carlo or molecular dynamics simulations using a coarse-grained model and then conversion back to the original atomistic description [8–11]
(2) Starting with a stoichiometric mixture of the epoxy monomer and the hardener and then “polymeriz-ing” the mixture in conjunction with atomistic molecular dynamics (MD) simulations. This method has also proven effective for complex cross-linking reactions [12]
The most extensive research effort is found in the polye-poxy systems EPON 862 resin cross-linked with diethyltolue-nediamine (DETDA) [13–16] and triethylenetetramine (TETA) [17–20] because of their wide use in the fields of modern aeronautics and composite materials and their use in the development of micro- and nanodevices with desired properties. The cross-linking of the diglycidyl ether of bisphenol-A (DGEBA) resin was also widely studied with different hardeners, i.e., isophorone diamine (IPD) [21, 22], trimethylene glycol di-p-aminobenzoate (TMAB) [23], DETDA [24], diaminodiphenyl sulfone (DDS) [9], methy-lenedianiline [25], poly(oxopropylene) diamines (POP) [26, 27], 4,4′-methylenebis(cyclohexylamine) (MCA) [26], diethy-lenetriamine (DETA) [28], and JEFFAMINE® D-230 [29].
In the present work, we use atomistic MD and a static cross-linking code to create a model polyepoxy from the epoxy resin diglycidyl ether of bisphenol-A (DGEBA) and ethylenediamine (EDA).
We have been studying this model system in the last few years because the monomers are small and suitable for model experiments and ab initio calculations [30, 31], but yet close to real materials used in the industry. To generate atomistic model configurations, we have developed a cross-linking procedure based on the works of Jang et al. [27] and Sirk et al. [32]. Molecular dynamics simulations at 700 K are used in order to mix efficiently and relax the strain in the simula-tion boxes and thus achieve the maximum percentage of polymerization starting from a stoichiometric mixture of DGEBA and EDA (2 : 1). The thermal properties of the model polyepoxy are characterized by the determination of the density, the coefficient of volumetric thermal expansion, and the glass transition temperature (Tg) of the polymer, which are compared to experimental data.
2. Methods
2.1. Experimental Details. The chemical structures of the epoxy monomer (DGEBA) and the hardener (the primary diamine EDA) are shown in Figure 1 (reactants 1 and 2), along with a few polyaddition steps of the polymerization reaction. DGEBA is a bifunctional reactant with two epoxide groups, while EDA has four reactive sites with two primary amine groups. Thus, the stoichiometry ratio of DGE-BA : EDA is 2 : 1. The polymerization consists in the reaction of the H atoms of the amine groups of EDA with the O atoms of the epoxide groups of DGEBA and the bonding of the N atoms of the amine group with the C atoms of the epoxide
groups. We assume that the homopolymerization is negli-gible in the present conditions of temperature and in the absence of a catalyst.
We use the stoichiometric ratio of DGEBA (D.E.R. 332, Dow Chemical Co., n = 0 03) and EDA (Analytical Grade, purity > 99.5%, Sigma-Aldrich). Since the mass of DGEBA (mDGEBA) isfixed to 5 g, the mass of EDA (mEDA) is deter-mined as follows: mEDA= fDGEBAf EDA ×MEDAM×mDGEBA DGEBA = 0 43g, 1
where MDGEBA is the molar mass (348.52 g/mol) of this DGEBA andfDGEBAis its functionality (2), andMEDAis the molar mass (60.10 g/mol) of EDA andfEDAis its functional-ity (4). We assume that no etherification occurs. The DGEBA resin has a density of 1.170 g/cm3, and the onset of its glass transition temperature determined by differential scanning calorimetry equals 231 K. EDA is a liquid amine with a den-sity of 0.897 g/cm3.
The mixture is then mechanically stirred in an Ar glove box for 7 min before it is poured as a thin droplet on Si cou-pons. Polymerization is then allowed for 48 h at ambient temperature, followed by a postcuring of 2 h at 413 K, either in the Ar glovebox, in ambient atmosphere, or in a primary vacuum (with a short air exposure in this latter case).
Fourier transform infrared spectroscopy (FTIR, Frontier, PerkinElmer equipped with a NIR TGS detector) is achieved in transmission in the 4000-8000 cm-1 range. 16 scans are collected for each analysis with a resolution of 4 cm-1. Back-ground spectra are performed on the two empty microscope glass slides used for maintaining the polyepoxy samples. The decrease in the IR normalized band intensity of epoxy groups is directly proportional to the increase of conversion degree. We quantify the characteristic epoxy band (combination band of the–CH2of the epoxy group) at 4530 cm-1. The ref-erence band (i.e., the band conserving the same area during the chemical reaction of polymerization) is the combination band of C=C with aromatic –CH at 4623 cm-1 [33]. Peak areas are then used for calculating the conversion degree (Xe,NIR) of epoxy groups:
Xe,NIR= 1− Aepoxy/Areference t
Aepoxy/Areference t=0 2
The termsAepoxy and Areference refer to the areas of the peaks of the epoxy and reference groups, respectively (i.e.,
Aepoxy=A4530andAref=A4623).
Differential scanning calorimetry (DSC) is used for the determination of the glass transition temperature (Tg). We use a DSC 204 Phoenix Series (NETZSCH) coupled with a TASC 414/4 controller. The apparatus is calibrated against melting temperatures of In, Hg, Sn, Bi, and Zn, applying a +10 deg/min temperature ramp. Samples are placed in alumi-num capsules. Mass is measured with an accuracy of ±0.1 mg. We report and compare the midpointTgtemperatures.
In addition, thermomechanical analyses (TMA) are performed on a cubic 3 7 × 3 7 × 3 7 mm3 sample with a NETZSCH TMA 402 F3 apparatus. 3 cycles are executed consecutively from 134 K to 485 K with a heating ramp of +5 deg/min. During the first cycle, the sample is heated up and maintained at 485 K for 1 h before cooling. This is intended to erase the thermal history of the sample. The other two cycles include a 15 min plateau only at maxi-mum temperature.
2.2. Computational Details. The generalized AMBER force field (GAFF 1.8) [34] is used to describe the intra- and intermolecular interactions. Any missing forcefield param-eters are determined using the AmberTools16 package [35]. The energy minimizations and molecular dynamics calcula-tions are carried out using the LAMMPS simulation pack-age [36]. The atomic charges on all atoms were calculated with the RESP method [37], applied to monomers, dimers (1 DGEBA bonded to 1 EDA), and trimers (2 DGEBA bonded to 1 EDA) in order to get charges for all atom types present during the cross-linking procedure and in the final polyepoxy. The particle particle particle mesh (PPPM) algorithm [38] is used to calculate the coulombic interactions with a real-space cutoff of 9 Å. A cutoff dis-tance of 9 Å (with the buffer of 2 Å) is also used for the van der Waals interactions.
The velocity-Verlet integrator [39] is used to integrate the equations of motion using a time step of 1 fs. The tempera-ture and pressure are controlled using the Nosé-Hoover ther-mostat [40] and barostat [35].
Thefirst step of our methodology is to generate a “mix-ture of reactants” containing the stoichiometric amounts of DGEBA and EDA. In order to approximate a correct repre-sentation of a bulk polyepoxy, we build a cubic box which contains 400 DGEBA and 200 EDA molecules at a density fixed at 0.7 g/cm3using PACKMOL [41] and the amorphous builder module included in the Materials Studio package [42]. The process of obtaining a polymer from the initial monomer mixture involves the cross-linking of monomers. To that aim, we developed a homemade code (FORTRAN 90) based on the works of Jang et al. [27] and Sirk et al. [32]. This multistep cross-linking process is presented in Figure 2. MD simulations are performed at 700 K between two cross-linking steps in order to relax the structures and decrease local strain. In complement, two runs are performed at the experimental curing temperature (413 K) and at high temperature (900 K).
The multistep cross-linking process sketched in Figure 2 consists in the following steps:
(1) Packing of the reactants (stoichiometric mixture: 400 DGEBA and 200 EDA molecules) in a box of predefined density (0.7 g/cm3)
(2) NVE MD simulation (constant number of atoms, volume, and energy) for 1 ns, followed by NPT simulation (constant number of atoms, pressure, and temperature) for 1 ns, at a pressureP = 1 atm and at a temperature T = 700 K to equilibrate the initial monomer mixture
O O O O H2N NH2 H2N H N O O O OH + 2 1 (a) H2N H N O O O OH 2 O OHN O N HO N N O N OH O OH O OH O HO O N OH O OH 1 (b)
Figure 1: A few steps of the polymerization reaction between one EDA (1) and one DGEBA (2) monomer (a), leading to the final cross-linked structure (b).
(3+4) Pairs of unreacted atoms are identified within a search reaction cutoff distance of 3 Å. To cross-link these atoms, the identities (IDs) of mod-ified atoms are changed. The topology file is updated. New angles, dihedrals, and RESP charges that result from the creation of the new cross-linked bonds are assigned
(5) MD simulations (1 ns) in NVE, NVT, and NPT (700 K, 1 atm) ensembles are performed; the tem-perature isfixed at 700 K, which is far above the glass transition temperature Tg of the polymer determined experimentally (391 K), thus allowing some mobility of the chains to obtain a relaxed structure
The sequence of (3 + 4 + 5) steps is repeated until no change in the conversion degree is observed between two sequences. The maximal conversion degree is then obtained. (6) An NPT MD simulation at 700 K for 2 ns is per-formed on the final reticulated simulation box, followed by stepwise cooling to 300 K to get relaxed structures and density of the polyepoxy model at 300 K. More details on the cooling process are given below in Section 3.2.4 where results on the volume-temperature behavior of the polymer are presented
It is noted that the cross-linking algorithm outlined above is not intended to mimic the actual polymerization reaction kinetics, as conducted in the laboratory. Experimen-tally, curing is carried out at temperatures of 140°C (413 K) over much longer times than can be accessed by atomistic MD simulation. Our choice of 700 K, a temperature actually
exceeding the thermal decomposition temperature of ordi-nary cured epoxy resins, is motivated by the need to bring about a vigorous configurational rearrangement within the time spans of tens of nanoseconds that can be simulated atomistically with MD and thus push unreacted reactive groups to come together, leading to a degree of conversion comparable to that obtained experimentally. Our use of such a high temperature also accelerates the process of relaxation of the structure around a newly created N-C chemical bond. The cutoff distance of 3 Å used in the search of pairs of atoms to be bonded by chemical reaction is another parameter of the computational cross-linking procedure that does not have a direct chemical counterpart. It will thus be an interest-ing question whether the structural, volumetric, and thermal properties of the resulting cross-linked polymer match those obtained experimentally.
3. Results
3.1. Experimental Results. We perform experimental tests in different postcuring conditions with the aim to maximize the conversion degree. Each test is repeated five times. The results are summarized in Table 1, where the conversion degrees are derived from FTIR analyses.
Under noninert conditions, the conversion degree is low at70 ± 6%. It is improved under vacuum with a con-version degree of 84 ± 4%. However, the postcuring in the Ar glovebox ensures the highest conversion degree of 92 ± 2% and the repeatability is excellent. These results are in agreement with previous results with the DGEBA-EDA system [30].
We determine the glass transition temperature by DSC. The midpoint temperature is 391 ± 1 K, in good agreement with values reported elsewhere [43, 44].
Start (1) Initial liquid mixture of unreacted
monomers
(2) Equilibration of structure using NVE and NPT MD simulations
Still unreacted pairs within search radius?
(3) Change IDs of modified atoms
(4) Assign new angles, dihedrals, and partial
charges (5) Equilibration using NVE, NVT, and NPT MD simulations N Y (6) Equilibration using NPT MD simulations End
Figure 2: The multistep cross-linking flowchart.
3.2. Simulations. Six simulation boxes (Box#1-6) are created, and the multistep cross-linking procedure outlined above is used to get polymerized model samples. Average values of the polymer properties are then calculated.
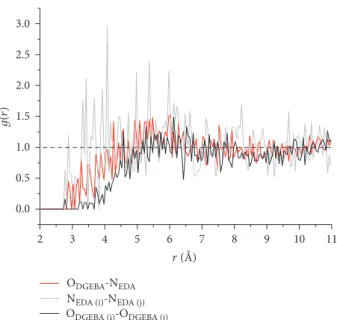
3.2.1. DGEBA and EDA Liquid Mixture. Boxes of 600 mole-cules (400 DGEBA + 200 EDA) containing 22,000 atoms are equilibrated performing NVE and NPT (700 K, 1 atm) simu-lations for 1 ns. Thefinal density of the reaction mixture is 0 798 ± 0 005 g/cm3 at 700 K. Then, the identities of one O atom of DGEBA and one N atom of EDA are changed in the topologyfile in LAMMPS. This permits calculating par-tial RDF functions of O atoms of different DGEBA molecules and N atoms of different EDA molecules. Therefore, we can calculate the ODGEBA-ODGEBA, NEDA-NEDA, and ODGEBA --NEDA distributions. The partial RDFs averaged over the 6 boxes are shown in Figure 3 and they help in determining if the mixture is homogeneous.
We first observe that there are no intermolecular dis-tances below 2.8 Å. Then, except for differences between RDF amplitudes, distributions are similar and oscillate around g r = 1 (dotted line), corresponding to a homoge-neous distribution. This point is important to ensure that epoxide groups are in the vicinity of amine groups to pro-mote cross-linking and mimic the effect of the experimental mechanical stirring. We also note that the highest amplitude of the partial RDFs is when EDA molecules are present, likely because of the rather high temperature for the amine. 3.2.2. Polymerization Procedure. Five boxes are generated and equilibrated as mentioned above. All boxes are then polymerized with the multistep procedure achieved at 700 K as described in Figure 2, and the conversion degree (number of created -OH over the total number of epoxy groups: NOH/2NDGEBA) is calculated at each step and plotted in Figure 4. We observe thatfinal conversion degrees are all above 90% after 11 steps. In the most promising cases, we obtain a conversion degree of 93%. The mobility of the remaining molecules or the steric availability of the remain-ing reactive sites is too low at these polymerization rates to promote further cross-linking. We also tried to maximize the polymerization rate with an additional box equilibrated in NVT and NPT at 900 K, but without more success (92%). This tends to show that the 93% limit will be difficult to surpass with these simulation parameters. As a comple-ment to our comcomple-ment in the last paragraph of Section 2.2, we show the results obtained with the multistep procedure achieved at 413 K; i.e., the temperature that is used experi-mentally. A plateau is reached at about 70% conversion
(72% after 16 steps, not shown). This confirms that higher temperatures must be chosen if one want to achieve high conversion degrees for such short simulations times. Finally, thefirst conversion degrees for given steps are different from one box to another; for instance at step 2, the conversion degree of Box#1 is 70%, whereas for Box#5 it is 48%. It is noted that there was no noticeable difference between their RDFs before polymerization. Box#1 was generated in PACK-MOL, whereas Box#2-5 were generated with the randomiza-tion algorithm of Materials Studio. Since randomizarandomiza-tion Table 1: Results obtained by FTIR spectroscopy using different
experimental conditions for postcuring.
Sample Xe,NIR
Postcuring in ambient air 0 70 ± 0 06 Postcuring under vacuum (brief air transfer) 0 84 ± 0 04 Postcuring under Ar atmosphere 0 92 ± 0 02
3.0 2.5 2.0 1.5 1.0 g(r) 0.5 0.0 2 3 4 5 6 ODGEBA-NEDA
NEDA (i)-NEDA (j)
ODGEBA (i)-ODGEBA (j)
r (Å)
7 8 9 10 11
Figure 3: Partial DGEBA-DGEBA, EDA-EDA, and DGEBA-EDA intermolecular RDF functions of the liquid mixture equilibrated at 700 K and 1 atm, averaged over the 5 boxes. RDFs are calculated between epoxy oxygen atoms of two different DGEBA molecules (i and j), amine nitrogen atoms of two different EDA molecules (i and j), and O and N atoms of DGEBA and EDA molecules.
100 90 80 70 60 50 Conversion degree (%) 40 30 0 2 4 Simulation step 6 8 10 12 1 2 3 4 5 900 K 413 K
Figure 4: Monitoring of the conversion degree during the multistep cross-linking process for 5 different boxes equilibrated at 700 K, 1 box equilibrated at 900 K, and 1 box equilibrated at 413 K.
relies on Monte Carlo algorithms, each box distribution is different and may take different trajectories during MD equilibration. Anyway, it seems that whatever the initial box configuration, the final conversion rates converge to 90% and a little more.
Box#4 is selected in its final configuration (conversion degree = 93%) in order to analyze its bonded and nonbonded RDF functions. Results are shown in Figure 5 along with a 3D representation of the box in the inset. The minimum non-bonded distances found in the polymer correspond to a peak ranging from 2 to 3 Å, i.e., the packing is dense as expected for cross-linked epoxy networks, where the interchain dis-tance is constrained by reticulation. The nonbonded RDF rapidly reaches a value of 1 (betweenr = 3 5 to 5.5 Å) that demonstrates the homogeneity of the distribution of the disordered structure.
On the bonded RDF in Figure 5, we identify 5 local max-ima that correspond tofirst-neighbor distances. Labels 1 to 5 correspond to (1) O-H (0.96 Å), (2) N-H (1.01 Å), (3) C-H (1.09 Å), (4) Cph-Cph (1.39 Å) and C-O (1.43 Å), and (5) C-C (1.54 Å) bonds. Further peaks correspond to combina-tions offirst-neighbor distances, until the RDF homogenizes abover = 3 5 − 5 5 Å.
3.2.3. Density. The polymer density, calculated at 300 K and 1 atm, is also in very good concordance with the literature. We calculate a density of 1 118 ± 0 003 g/cm3, whereas the value obtained through empirical calculations is 1.142 g/cm3. This empirical density is calculated through the relationship
ρ = 350 + 120M (kg/m3), where M is the molecular weight of the repeat unit [44, 45]. The value ofM is representative of the polyepoxy polymer based on the 2DGEBA : 1EDA stoichiometry.
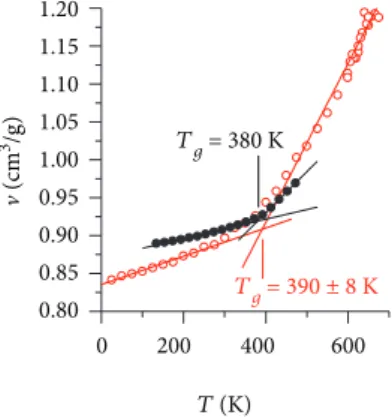
3.2.4. Glass Transition Temperature and Coefficient of Volumetric Thermal Expansion. Experimentally, the TMA analysis consists in the monitoring of the linear expansion of the polyepoxy sample during a thermal cycle from 134 K to 485 K. We then extrapolate the measuredΔl/l into a volu-micΔv/v, considering an isotropic expansion. Then, we plot the specific volume v (the inverse of the calculated density) as a function of temperature. Results are shown with (black) full circles in Figure 6. For calculations, we follow a protocol based on the work of Sirk et al. [32]. First, the procedure con-sists in heating the polymer at 700 K for 2 ns and cooling it at a rate of 25 K/ns down to 25 K (red, empty circles in Figure 6). Two different regions are observed below and above 400 K, roughly, corresponding to the vitreous and rub-bery states.
The determination ofTgis explained and involves the use of the coefficient of volumetric thermal expansion (CVTE).
An elegant procedure to analyze the plots of Figure 6 con-sists in distinguishing the glassy and rubbery temperature domains. Actually, although there is a change in physical properties during the glass transition, the structure evolves through an undefined range of temperatures. Temperature regions must then be identified to fit the linear regimes prop-erly and to estimateTgat the intersection. For that reason,
we plot the CVTE versus temperature in Figure 7 for both the experimental and the calculation procedures.
CVTEs are calculated as follows: CVTE = 1
v ∂v
∂T P
3 The term ∂v/∂T Pis calculated using afinite-difference method in Origin software.
Since glass transition is a second order transition, the CVTE should show a smooth step separating two constant regions. Figure 7(a) shows the results for 3 different simula-tion boxes (empty circles) and for one TMA cycle (full black circles). Figure 7(b) makes a focus on the 3 TMA cycles in order to extract quantitative data more easily.
By simulation (Figure 7(a)), the glassy state region is easily identified up to T = 275 K and the dispersion between the 3v t datasets is small. There, the average CVTE varies from 2 0 × 10−4K−1 at 100 K to 2 5 × 10⁻⁴K−1 at 275 K. At 1.2 1.0 0.8 0.6 5 3 2 1 4 g( r) 0.4 0.2 0.0 0 1 2 3 4 5 r (Å) 6 7 8 9 10 11 Nonbonded Bonded
Figure 5: Bonded (black line) and nonbonded (grey line) RDF functions of Box#4 after polymerization. Labeled peaks in the bonded RDF correspond to O-H and N-H bonds (1, 2), C-H bonds (3), Cph-Cphand C-O bonds (4), and C-C bonds (5). The
inset shows a 3D representation of the box.
1.20 1.15 1.10 1.05 v (cm 3/g) 1.00 0.95 0.90 0.85 0.80 0 200 T (K) 400 Tg = 390 ± 8 K Tg = 380 K 600
Figure 6: Calculated (Box#4, empty circles)) and experimental (full black circles) evolution of the specific volume v of the polymer as a function of temperature.
higher temperatures, the CVTE reaches 8 × 10⁻⁴K−1 and more, but the dispersion is high and no region can easily be identified. Nevertheless, we tentatively place a second limit at T = 450 K. By doing so, we assume that all points above 575 K are not valid because they exceed known limits for the CVTE of thermosets in the rubbery region, i.e., 4 × 10⁻⁴− 8 × 10⁻⁴K−1 [45]. An additional trial has been made to double-check the accuracy of the MD calculations at high temperatures. We applied a cooling ramp of 5 K/ns instead of 25 K/ns from 700 to 600 K, in order to equilibrate the box more smoothly (not shown). This did not improve the results, neither for the linear fitting of v T nor for the determination of a rubbery state plateau below 8 × 10⁻⁴ K−1. Consequences are that we can fit the simulated plot in Figure 6 with a single linear regression calculated from 25 K to 275 K. Above, there are multiple possibilities for the range of the linear regression, resulting in a high uncertainty of ±8 degrees in the determination ofTg. With the linear
fit-tings proposed, we determine a simulatedTgof 390 ± 8 K.
Experimentally (Figure 7(b)), the CVTE evolves linearly in the glassy region from 0 9 × 10⁻⁴K−1 at 134 K to 2 0 × 10−4K−1 at 350 K. In the transition region between 350 K and 405 K, it increases drastically before reaching the rubbery state, at an average value of 5 8 × 10⁻⁴K−1. In Figure 6, linear fittings are then executed between 134 K and 350 K and between 405 K and 485 K. The experimentalTgobtained at
the intersection is thus 380 K.
The simulation/experiment match is good. The experi-mental and calculated CVTEs are similar in the glassy state (1− 2 × 10⁻⁴ and 2 × 10⁻⁴K−1) and in the good range in the rubbery state (5 8 × 10⁻⁴ and 8 × 10⁻⁴K−1). The tempera-ture domain for the transition state is much larger in the simulations (175 K) than in the experiments (55 K), likely because this polymer is not suitable for MD at temperatures above 500 K. This adds uncertainty to the determination of the simulated glass transition. Nevertheless, the simulated
Tg (390 ± 8 K) compares very well with both experimental glass transition temperatures of 391 ± 1 K measured by dif-ferential scanning calorimetry and through TMA (380 K).
This is a good result considering the t − T dependence of the results. Actually, simulations are performed at cooling rates (qsim= 4 17 × 108) that are 108 orders of magnitude above that of TMA (qexp,TMA= 5 deg/min) and DSC (qexp,DSC= 10 deg/min). A rearrangement of the Williams-Landel-Ferry (WLF) equation (3), based on the t − T superposition principle, can express the expected difference between simulated and experimental Tg [46]:
ΔTg=Tg,sim− Tg,exp=
−C2 log qexp/qsim
C1 + log qexp/qsim
, 4
whereC1 and C2 are the WLF equation parameters. Using “universal” values (C1 = 17 44 K and C2 = 51 6 K), the simulated Tg should be found 42.9 K above the TMA one and 40.0 K above the DSC one. This is above what we determine, and we may have to find more appropriate WLF parameters. These parameters depend on the fraction of free volume within the polymer and on the CVTE of this free volume, and they may be related to the polymer density. Since the matching between experimental and sim-ulated densities is not perfect, there may be some level of porosity within the experimental samples that slightly modifies the CVTE vs. T behavior and then modifies the determination of Tg,exp. Conversely,C1 and C2 values are
probably not correct for our system which is highly cross-linked. For instance, in the DGEBA-TETA system, if the cross-linking density is high, then the free volume fraction is low (1.6-1.8%) and C1 equals 24-27 [47]. With a lower functionality and a longer aliphatic chain, the more flexible DGEBA-diaminomethylpentane system exhibits a higher fraction of free volume (4.3%) and a lowerC1 value (10) [48]. ΔTg would then be much higher in the latter example. Thus, C1 and C2 should be better determined for the DGEBA-EDA system with a series of experiments and/or calculations at different cooling rates, as it has been done for other DGEBA-primary amine systems [49].
1.4 1.2 275 K 450 K 0.8 1.0 0.6 CV TE × 10 3 (K -1) 0.4 0.2 0.0 0 200 400 600 (a) 0.5 0.6 0.4 CV TE × 10 3 (K -1) 0.3 0.2 0.1 0.0 5.8 × 10⁻⁴ K−1 2 × 10⁻⁴ K−1 9 × 10⁻⁵ K−1 350 K 405 K 100 200 Temperature (K) 400 300 500 (b)
Figure 7: Coefficients of volumetric thermal expansion (CVTE) as a function of temperature for 3 different initial mixtures (empty circles) and for one TMA cycle (full circles) (a). Zoom on the TMA experimental results (b).
4. Conclusions
In our effort to model epoxy polymers, we have created a bulk polymer model starting from a stoichiometric liquid mixture of the two reactants DGEBA and EDA, EDA being a small liquid diamine molecule with a functionality of 4, similar enough to amines used in the industry, such as DETA and TETA. Six model structures were created through a stepwise procedure. We developed a cross-linking code that identifies any close reactive centers (reaction radius 3 Å) and creates bonds. The global polymerization procedure comprises also all-atom molecular dynamics (GAFF 1.8 forcefield) equili-bration steps alternating with cross-linking. For thefirst five models, we performed 1 ns-long 700 K MD simulations between two cross-linking steps. In the latter steps, the diffu-sion of the monomers in the partially reticulated polymer could limit the cross-linking of the remaining reactive sites. To favor the diffusion of the monomers, we increased the temperature of the MD simulations to 900 K, but there was no significant increase in the conversion degree that is finally higher than 90% for the six boxes. Thanks to additional molecular dynamics simulations, we were furthermore able to equilibrate and calculate the properties for the liquid mix-ture, as well as for those of the intermediate semipolymerized phases and thefinal polymer model. The properties (the den-sity and glass transition temperature) of thefinal polymer model compare very well with experimental values, despite the uncertainty of thefitting of the rubbery state temperature region. Finally, the proposed bulk polyepoxy 3D-network is a good model, in agreement with its experimental counterpart showing the validity of the cross-linking procedure. Work is in progress to propose a surface model that will be useful to study the surface reactivity of epoxy polymers.
Data Availability
The data related to the present work are available on demand to the corresponding author.
Conflicts of Interest
The authors declare that they have no conflicts of interest.
Acknowledgments
The authors acknowledge the Agence Nationale de la Recherche for financial support in the framework of the LabCom program COCOON, under contract no. ANR-14-LAB3-0010-01 and the Ministère de l’Enseignement supérieur, de la Recherche et de l’Innovation (PhD fun-ding—A. Gavrielides). This work was performed using HPC resources from CALMIP (Grant p1526). The authors are indebted to P. Alphonse and V. Baco-Carles (CIRI-MAT) for thermomechanical characterizations.
References
[1] K. Dieter, H. Brigitte, F. Hans-Peter, and B. Andreas, “Cellu-lose: fascinating biopolymer and sustainable raw material,”
Angewandte Chemie International Edition, vol. 44, no. 22, pp. 3358–3393, 2005.
[2] A. Di Martino, M. Sittinger, and M. V. Risbud,“Chitosan: a versatile biopolymer for orthopaedic tissue-engineering,” Bio-materials, vol. 26, no. 30, pp. 5983–5990, 2005.
[3] J. G. Smith, J. W. Connell, D. M. Delozier et al.,“Space durable polymer/carbon nanotubefilms for electrostatic charge miti-gation,” Polymer, vol. 45, no. 3, pp. 825–836, 2004.
[4] P. Chandrasekhar, B. J. Zay, T. McQueeney et al., “Con-ducting polymer (CP) infrared electrochromics in spacecraft thermal control and military applications,” Synthetic Metals, vol. 135-136, pp. 23-24, 2003.
[5] C. J. Buchko, L. C. Chen, Y. Shen, and D. C. Martin, “Process-ing and microstructural characterization of porous biocom-patible protein polymer thinfilms,” Polymer, vol. 40, no. 26, pp. 7397–7407, 1999.
[6] Y. Travaly, P. Bertrand, G. M. Rignanese, and X. Gonze, “The-oretical modeling of the nucleation and growth of aluminium films thermally evaporated onto poly(ethylene terephthalate) substrate,” The Journal of Adhesion, vol. 66, no. 1-4, pp. 339– 355, 1998.
[7] G. D. Davis, B. J. Rees, and P. L. Whisnant,“Chemical evalua-tion of Cu–polyimide interfaces,” Journal of Vacuum Science & Technology A: Vacuum, Surfaces, and Films, vol. 12, no. 4, pp. 2378–2387, 1994.
[8] D. V. Guseva, V. Y. Rudyak, P. V. Komarov, A. V. Sulimov, B. A. Bulgakov, and A. V. Chertovich,“Crosslinking mecha-nisms, structure and glass transition in phthalonitrile resins: insight from computer multiscale simulations and experi-ments,” Journal of Polymer Science Part B: Polymer Physics, vol. 56, no. 5, pp. 362–374, 2018.
[9] A. A. Gavrilov, P. V. Komarov, and P. G. Khalatur,“Thermal properties and topology of epoxy networks: a multiscale simu-lation methodology,” Macromolecules, vol. 48, no. 1, pp. 206– 212, 2015.
[10] P. V. Komarov, C. Yu-Tsung, C. Shih-Ming, P. G. Khalatur, and P. Reineker,“Highly cross-linked epoxy resins: an atom-istic molecular dynamics simulation combined with a map-ping/reverse mapping procedure,” Macromolecules, vol. 40, no. 22, pp. 8104–8113, 2007.
[11] A. Prasad, T. Grover, and S. Basu,“Coarse-grained molecu-lar dynamics simulation of cross-linking of DGEBA epoxy resin and estimation of the adhesive strength,” International Journal of Engineering, Science and Technology, vol. 2, no. 4, 2010.
[12] M. S. Radue, V. Varshney, J. W. Baur, A. K. Roy, and G. M. Odegard,“Molecular modeling of cross-linked polymers with complex cure pathways: a case study of bismaleimide resins,” Macromolecules, vol. 51, no. 5, pp. 1830–1840, 2018. [13] V. Varshney, S. S. Patnaik, A. K. Roy, and B. L. Farmer,“A
molecular dynamics study of epoxy-based networks: cross-linking procedure and prediction of molecular and material properties,” Macromolecules, vol. 41, no. 18, pp. 6837–6842, 2008.
[14] N. Nouri and S. Ziaei-Rad,“A molecular dynamics investi-gation on mechanical properties of cross-linked polymer networks,” Macromolecules, vol. 44, no. 13, pp. 5481–5489, 2011.
[15] C. Li and A. Strachan,“Molecular simulations of crosslinking process of thermosetting polymers,” Polymer, vol. 51, no. 25, pp. 6058–6070, 2010.
[16] A. Bandyopadhyay, P. K. Valavala, T. C. Clancy, K. E. Wise, and G. M. Odegard, “Molecular modeling of crosslinked epoxy polymers: the effect of crosslink density on thermome-chanical properties,” Polymer, vol. 52, no. 11, pp. 2445–2452, 2011.
[17] Q. H. Zeng, A. B. Yu, and G. Q. Lu,“Multiscale modeling and simulation of polymer nanocomposites,” Progress in Polymer Science, vol. 33, no. 2, pp. 191–269, 2008.
[18] S. Yu, S. Yang, and M. Cho, “Multiscale modeling of cross-linked epoxy nanocomposites to characterize the effect of particle size on thermal conductivity,” Journal of Applied Physics, vol. 110, no. 12, p. 124302, 2011.
[19] J. Choi, S. Yu, S. Yang, and M. Cho, “The glass transition and thermoelastic behavior of epoxy-based nanocomposites: a molecular dynamics study,” Polymer, vol. 52, no. 22, pp. 5197–5203, 2011.
[20] H. B. Fan and M. M. F. Yuen,“Material properties of the cross-linked epoxy resin compound predicted by molecular dynamics simulation,” Polymer, vol. 48, no. 7, pp. 2174– 2178, 2007.
[21] H. Hörstermann, R. Hentschke, M. Amkreutz, M. Hoffmann, and M. Wirts-Rütters,“Predicting water sorption and volume swelling in dense polymer systems via computer simulation,” The Journal of Physical Chemistry B, vol. 114, no. 51, article 17013, 17024 pages, 2010.
[22] C. Wu and W. Xu,“Atomistic molecular simulations of struc-ture and dynamics of crosslinked epoxy resin,” Polymer, vol. 48, no. 19, pp. 5802–5812, 2007.
[23] P.-H. Lin and R. Khare,“Molecular simulation of cross-linked epoxy and epoxy−POSS nanocomposite,” Macromolecules, vol. 42, no. 12, pp. 4319–4327, 2009.
[24] T. C. Clancy, S. J. V. Frankland, J. A. Hinkley, and T. S. Gates, “Molecular modeling for calculation of mechanical properties of epoxies with moisture ingress,” Polymer, vol. 50, no. 12, pp. 2736–2742, 2009.
[25] S.-H. Chang and H.-S. Kim, “Investigation of hygroscopic properties in electronic packages using molecular dynamics simulation,” Polymer, vol. 52, no. 15, pp. 3437–3442, 2011. [26] T. W. Sirk, M. Karim, K. S. Khare, J. L. Lenhart, J. W. Andzelm,
and R. Khare, “Bi-modal polymer networks: composition-dependenttrends in thermal, volumetric and structural properties from molecular dynamics simulation,” Polymer, vol. 58, pp. 199–208, 2015.
[27] C. Jang, T. W. Sirk, J. W. Andzelm, and C. F. Abrams, “Com-parison of crosslinking algorithms in molecular dynamics sim-ulation of thermosetting polymers,” Macromolecular Theory and Simulations, vol. 24, no. 3, pp. 260–270, 2015.
[28] A. Shokuhfar and B. Arab,“The effect of cross linking density on the mechanical properties and structure of the epoxy poly-mers: molecular dynamics simulation,” Journal of Molecular Modeling, vol. 19, no. 9, pp. 3719–3731, 2013.
[29] S. Masoumi, B. Arab, and H. Valipour, “A study of thermo-mechanical properties of the cross-linked epoxy: an atomistic simulation,” Polymer, vol. 70, pp. 351–360, 2015. [30] T. Duguet, C. Bessaguet, M. Aufray et al.,“Toward a
computa-tional and experimental model of a poly-epoxy surface,” Applied Surface Science, vol. 324, pp. 605–611, 2015. [31] A. Gavrielides, T. Duguet, J. Esvan, C. Lacaze-Dufaure, and
P. S. Bagus,“A poly-epoxy surface explored by Hartree-Fock ΔSCF simulations of C1s XPS spectra,” The Journal of Chemi-cal Physics, vol. 145, no. 7, article 074703, 2016.
[32] T. W. Sirk, K. S. Khare, M. Karim et al.,“High strain rate mechanical properties of a cross-linked epoxy across the glass transition,” Polymer, vol. 54, no. 26, pp. 7048–7057, 2013. [33] C. E. Miller,“Near-infrared spectroscopy of synthetic
poly-mers,” Applied Spectroscopy Reviews, vol. 26, no. 4, pp. 277– 339, 1991.
[34] J. Wang, R. M. Wolf, J. W. Caldwell, P. A. Kollman, and D. A. Case, “Development and testing of a general amber force field,” Journal of Computational Chemistry, vol. 25, no. 9, pp. 1157–1174, 2004.
[35] D. A. Case, D. S. Cerutti, T. E. Cheatham et al., Amber 2017, University of California, San Francisco, 2017.
[36] S. Plimpton,“Fast parallel algorithms for short-range molecu-lar dynamics,” Journal of Computational Physics, vol. 117, no. 1, pp. 1–19, 1995.
[37] C. I. Bayly, P. Cieplak, W. Cornell, and P. A. Kollman, “A well-behaved electrostatic potential based method using charge restraints for deriving atomic charges: the RESP model,” The Journal of Physical Chemistry, vol. 97, no. 40, arti-cle 10269, 10280 pages, 1993.
[38] R. Hockney and J. Eastwood, “Particle-particle-particle-mesh (P3m) algorithms,” in Computer Simulation Using Particles, R. Hockney and J. Eastwood, Eds., p. 267, Adam Hilger, New York, USA, and Abingdon, UK, 1988. [39] L. Verlet, “Computer “experiments” on classical fluids. I.
Thermodynamical properties of Lennard-Jones molecules,” Physical Review, vol. 159, no. 1, pp. 98–103, 1967. [40] W. G. Hoover and B. L. Holian, “Kinetic moments method
for the canonical ensemble distribution,” Physics Letters A, vol. 211, no. 5, pp. 253–257, 1996.
[41] L. Martínez, R. Andrade, E. G. Birgin, and J. M. Martínez, “PACKMOL: a package for building initial configurations for molecular dynamics simulations,” Journal of Computational Chemistry, vol. 30, no. 13, pp. 2157–2164, 2009.
[42] R. L. C. Akkermans, N. A. Spenley, and S. H. Robertson, “Monte Carlo methods in Materials Studio,” Molecular Simu-lation, vol. 39, no. 14-15, pp. 1153–1164, 2013.
[43] S. G. Prolongo, F. Mikes, J. C. Cabanelas, S. Paz-Abuı́n, and J. Baselga,“Diffusion control on the cure kinetics of DGEBA with ethylenediamines,” Journal of Materials Processing Tech-nology, vol. 143-144, pp. 546–550, 2003.
[44] G. F. González, S. B. G, P. V. J, R. R, S. Rubén, and R. Jacques, “Mechanical properties of epoxy networks based on DGEBA and aliphatic amines,” Journal of Applied Polymer Science, vol. 106, no. 3, pp. 2047–2055, 2007.
[45] J. P. Pascault, H. Sautereau, J. Verdu, and R. J. Williams, Ther-mosetting Polymers, CRC Press, 2002.
[46] A. Soldera and N. Metatla, “Glass transition of polymers: atomistic simulation versus experiments,” Physical Review E, vol. 74, no. 6, article 061803, 2006.
[47] D. D. Nguyen, Revêtements polymères sous contraintes envir-onnementales couplées, [Ph.D. thesis], Université de La Rochelle, 2012.
[48] G. Bouvet, Relations entre microstructure et propriétés physi-co-chimiques et mécaniques de revêtements époxy modèles, , [Ph.D. thesis], Université de La Rochelle, 2014.
[49] S. Cukierman, J. L. Halary, and L. Monnerie,“Molecular anal-ysis of the viscoelastic properties of epoxy networks as deduced from the study of model systems,” Journal of Non-Crystalline Solids, vol. 131-133, Part 2, pp. 898–905, 1991.