Titre:
Title:
Development of a 3D analytical solution to evaluate stresses in
backfilled vertical openings
Auteurs:
Authors
: Li Li, Michel Aubertin et Tikou Belem
Date: 2005
Type:
Rapport / ReportRéférence:
Citation
:
Li, L., Aubertin, M. & Belem, T. (2005). Development of a 3D analytical solution to evaluate stresses in backfilled vertical openings (Rapport technique n° EPM– RT–2005-04).
Document en libre accès dans PolyPublie
Open Access document in PolyPublieURL de PolyPublie:
PolyPublie URL: https://publications.polymtl.ca/3142/
Version: Version officielle de l'éditeur / Published versionNon révisé par les pairs / Unrefereed Conditions d’utilisation:
Terms of Use: Tous droits réservés / All rights reserved
Document publié chez l’éditeur officiel Document issued by the official publisher
Maison d’édition:
Publisher: Les Éditions de l’École Polytechnique
URL officiel:
Official URL: https://publications.polymtl.ca/3142/
Mention légale:
Legal notice: Tous droits réservés / All rights reserved
Ce fichier a été téléchargé à partir de PolyPublie, le dépôt institutionnel de Polytechnique Montréal
This file has been downloaded from PolyPublie, the institutional repository of Polytechnique Montréal
EPM–RT–2005-04
DEVELOPMENT OF A 3D ANALYTICAL SOLUTION TO
EVALUATE STRESSES IN BACKFILLED VERTICAL
OPENINGS
Li Li, Michel Aubertin, Tikou Belem
Département des Génies civil, géologique et des mines
École Polytechnique de Montréal
EPM-RT-2005-04
DEVELOPMENT OF A 3D ANALYTICAL SOLUTION TO EVALUATE
STRESSES IN BACKFILLED VERTICAL OPENINGS
Li LI1, Michel AUBERTIN1,3, Tikou BELEM2
1Department of Civil, Geological and Mining Engineering, École Polytechnique de Montréal,
C.P. 6079, Succursale Centre-ville, Québec, H3C 3A7, Canada
2Department of Applied Sciences, Université du Québec en Abitibi-Témiscamingue
445 boulevard de l'Université, Rouyn-Noranda, Québec, J9X 5E4, Canada
3Industrial NSERC Polytechnique-UQAT Chair on Environment and Mine Wastes Management
(http://www.polymtl.ca/enviro-geremi/).
Li, Aubertin and Belem i
2005
Li Li, Michel Aubertin, Tikou Belem Tous droits réservés
Dépôt légal :
Bibliothèque nationale du Québec, 2005 Bibliothèque nationale du Canada, 2005 EPM-RT-2005-04
Development of a 3D analytical solution to evaluate stresses in backfilled vertical openings
par : Li Li1, Michel Aubertin2,3, Tikou Belem2
1Department of Civil, Geological and Mining Engineering, École Polytechnique de Montréal 2Department of Applied Sciences, Université du Québec en Abitibi-Témiscamingue
3Industrial NSERC Polytechnique-UQAT Chair on Environment and Mine Wastes Management
Toute reproduction de ce document à des fins d'étude personnelle ou de recherche est autorisée à la condition que la citation ci-dessus y soit mentionnée.
Tout autre usage doit faire l'objet d'une autorisation écrite des auteurs. Les demandes peuvent être adressées directement aux auteurs (consulter le bottin sur le site http://www.polymtl.ca/) ou par l'entremise de la Bibliothèque :
École Polytechnique de Montréal
Bibliothèque – Service de fourniture de documents Case postale 6079, Succursale «Centre-Ville» Montréal (Québec)
Canada H3C 3A7
Téléphone : (514) 340-4846
Télécopie : (514) 340-4026
Courrier électronique : [email protected]
Ce rapport technique peut-être repéré par auteur et par titre dans le catalogue de la Bibliothèque :
Li, Aubertin and Belem iii
ABSTRACT
The mechanical response of backfill in narrow openings is significantly influenced by its interaction with the surrounding walls. Previous work conducted on backfilled trenches and mining stopes indicates that the theory of arching can be used to estimate earth pressures in narrow, vertical backfilled openings. In this report, a 3D analytical solution is proposed to evaluate the state of stress along the boundaries of the openings. The proposed solution, based on a generalized version of the Marston approach, is compared to numerical modeling and laboratory experimental results taken from the literature. A discussion follows on some particular features and limitations of the analytical solutions.
Key words: backfill, earth pressure, 3D openings, analytical solutions, trenches, mining stopes.
RÉSUMÉ
La réponse mécanique du remblai placé dans des ouvertures étroites est largement influencée par son inteaction avec les paroies adjacentes. Les travaux antérieurs portant sur les tranchées et les chantiers remblayés montrent que la théorie de l’effet d’arche peut être utilisée pour estimer la pression dans les ouvertures étroites. Dans cet article, une solution analytique tridimensionnelle est proposée pour évaluer l'état de contraintes dans le remblai le long des parois de l’ouverture. La solution, basée sur une généralisation de l’approche de Marston, est comparée avec des résultats numériques et expérimentaux de laboratoire tirés de la littérature. L’article se termine par une discussion sur certaines caractéristioques et limitations de la solution analytique.
TABLE OF CONTENTS
ABSTRACT... ii
RÉSUMÉ... ii
TABLE OF CONTENTS... iii
LIST OF TABLES ... ………..iv
LIST OF FIGURES ... ……….v
LIST OF SYMBOLS ... ……..vii
1. INTRODUCTION... 1
1.1 Arching concept and solutions... 2
2. PROPOSED 3D ANALYTICAL SOLUTIONS ... 3
2.1 Theoretical development ... 3
2.2 Special cases... 9
2.3 Graphical representation ... 10
3. COMPARISON WITH NUMERICAL MODELING RESULTS... 15
4. APPLICATION TO LABORATORY DATA... 18
5. EXTENSION TO CYLINDRICAL BINS... 21
6. DISCUSSION ... 25
7. CONCLUSION ... 27
ACKNOWLEDGEMENT ... 28
Li, Aubertin and Belem v
LIST OF TABLES
Table 1. Definition of Ki and αi (in eq. [11]) for different pressure fill conditions.
Table 2. Internal (φ) and interface (δ) friction angles for the backfill (after Take and Valsangkar 2001). Table 3. Parameters used in the calculation results presented in Figs. 11 – 13, base on data taken from Take
and Valsangkar (2001).
Table 4. Parameters used in the calculation results presented in Figs. 14 – 16, base on data taken from Blight (1986a, b).
LIST OF FIGURES
Fig. 1. A vertical backfilled opening with acting forces on an isolated layer element.
Fig. 2. Calculated values of vertical (a), horizontal (b), and shear (c) stresses versus elevation h; B = 5 m, L = 10 m, c1 = c2 = c3 = c4 = c = 1 kPa, φ = 35°, γ = 0.02 MN/m3; the fill is at rest (K1 = K2 = K3 = K4 = K =
1 - sinφ and α1 = α2 = α3 = α4 = α = 0); three cases are concerned: a base case (δ1 = 10°, δ2 = 20°, δ3 =
30°, δ4 = 35°), the upper bound limit (δ1 = δ2 = δ3 = δ4 = 10°) and the lower bound limit (δ1 = δ2 = δ3 =
δ4 = 35°).
Fig. 3. Calculated values of vertical (a), horizontal (b), and shear (c) stresses versus elevation h; B = 5 m, L = 10 m, c1 = c2 = c3 = c4 = c = 1 kPa, φ = 35°, γ = 0.02 MN/m3; the fill is in active state (K1 = K2 = K3 =
K4 = K, α1 = α2 = α3 = α4 = α; see Table 1); base case (δ1 = 10°, δ2 = 20°, δ3 = 30°, δ4 = 35°), upper
bound limit (δ1 = δ2 = δ3 = δ4 = 10°) and lower bound limit (δ1 = δ2 = δ3 = δ4 = 35°).
Fig. 4. Calculated values of vertical (a), horizontal (b), and shear (c) stresses versus elevation h; B = 5 m, L = 10 m, c1 = c2 = c3 = c4 = c = 1 kPa, φ = 35°, γ = 0.02 MN/m3; the fill is in passive state (K1 = K2 = K3 =
K4 = K, α1 = α2 = α3 = α4 = α; see Table 1); base case (δ1 = 10°, δ2 = 20°, δ3 = 30°, δ4 = 35°), the upper
bound limit (δ1 = δ2 = δ3 = δ4 = 10°) and the lower bound limit (δ1 = δ2 = δ3 = δ4 = 35°).
Fig. 5. Calculated values of vertical (a), horizontal (b), transverse (c), and longitudinal shear (d) stresses versus elevation h; B = 5 m, L = 10 m, φ = 35°, γ = 0.02 MN/m3, δ
1 = 10°, δ2 = 20°, δ3 = 30°, and δ4 =
35°; the fill is in at rest state (see Table 1).
Fig. 6. Calculated values of vertical (a), horizontal (b) stresses versus the ratio h/B obtained using 2D (eq. [30]) and 3D (eq. [29]) solutions with the fill in at rest state (see Table 1); B = 6 m, L = 10 m, c = 0.001 MPa, δ = φ = 30°, K = 1 - sinφ = 0.5, γ = 0.02 MN/m3.
Fig. 7. Calculated values of vertical (a), horizontal (b) stresses versus length to width ratio L/B obtained using the 2D (eq. [30]) and 3D (eq. [29]) solutions with the fill in at rest state (see Table 1); B = 6 m, h = 10 m, c = 0.001 MPa, δ = φ = 30°, γ = 0.02 MN/m3.
Li, Aubertin and Belem vii
Fig. 8. Numerical model geometry of a narrow backfilled stope (not to scale) for FLAC-2D (Itasca 2002); the main properties for the rock mass and backfill are given using classical geomechanical notations. Fig. 9. Comparison of vertical (a), and horizontal (b) stresses along the vertical central line (VCL) and left
wall (LW) obtained from the numerical modeling and the analytical solutions, with c1 = c3 = c = 0 kPa,
δ1 = δ3 = φ = 35°.
Fig. 10. Comparison between the numerical model and the analytical solutions for vertical (a), horizontal (b) and shear (c) stresses versus the opening height, with c1 = c3 = c = 0 kPa, δ1 = 25°, δ3 = φ = 35°. Fig. 11. Comparison between the proposed solution (eqs. [19] and [29]) and experimental results obtained on
3D physical model backfilled with dense sand (data taken from Take and Valsangkar 2001; see text for details).
Fig. 12. Comparison between the proposed general solution (eq. [18] and [19]) and the experimental results obtained on a 3D physical model backfilled with dense sand (data taken from Take and Valsangkar 2001; see text for details).
Fig. 13. Comparison between the proposed solution (eqs. [18] and [19]) and experimental results obtained on a 3D physical model backfilled with loose sand (data taken from Take and Valsangkar 2001; see text for details).
Fig. 14. Comparison between the proposed solution (eq. [38]) and the experimental measurements made in coal load-out silo; D = 20 m (data taken from Fig. 6 in Blight 1986a).
Fig. 15. Comparison between the proposed solution (eq. [38]) and the experimental measurements made in a grain silo; D = 7 m (data taken from Fig. 9 in Blight 1986a).
Fig. 16. Comparison between the proposed solution (eq. [38]) and the experimental measurements made in a fine powder silo; D = 15 m (data taken from Fig. 5 in Blight 1986b).
LIST OF SYMBOLS
A, cross section area of an opening; B, opening width;
BW, back wall of an opening;
c, fill cohesion;
ci, cohesion of the ith fill-wall interface (i = 1 to 4);
Ci, lateral compressive forces on the ith wall (i = 1 to 4);
D, diameter of a silo;
dh, thickness of layer element; FW, front wall of an opening;
g, the gravity acceleration; h, elevation in backfill; H, backfill height;
Ki, reaction coefficient for cohesionless material on the ith wall (i = 1 to 4);
K0, at rest reaction coefficient for cohesionless material;
Ka, active reaction coefficient for cohesionless material;
Kci, coefficient of lateral pressure (i = 1 to 4) for cohesive or cohesionless fill material;
Kp, passive reaction coefficient for cohesionless material;
L, opening length;
LW, left wall of an opening;
P, cross section perimeter of an opening;
RW, right wall of an opening;
SB (and SB + dSB), backfill material transverse internal shearing force;
Li, Aubertin and Belem ix
SL (and SL + dSL), backfill material longitudinal internal shearing force;
Ti, horizontal fill-wall shearing force on the ith wall (i = 1 to 4);
V (and V + dV), internal vertical force;
VCL, vertical central line;
W, weight of the backfill; z, depth of a modeled stope;
αi, backfill state angle on the ith wall (i = 1 to 4); δ, a unique value of wall-fill friction angle;
δi, the friction angle of the ith fill-wall interface (i = 1 to 4); φ, fill friction angle;
γ, unit weight of backfill;
κ13 and κ24, parameters defined in eq. [16];
λ13 and λ24, parameters defined in eq. [17];
ν, Poisson ratio;
σhhi, horizontal stress on the ith wall (i = 1 to 4);
σvh, vertical stress at position h;
τB, transverse shear stress;
1. INTRODUCTION
Many situations encountered in geotechnique require a quantitative evaluation of the loading conditions induced by backfill placed in confined narrow openings. Examples include load on conduits in trenches (e.g., Spangler and Handy 1984; McCarthy 1988), lateral stress on retaining walls (Frydman and Keissar 1987), vertical stress above tunnels (Iglesia et al. 1999), and pressure in backfilled mined stopes (e.g., Hustrulid et al. 1989; Aubertin et al. 2003; Harvey 2004; Belem et al. 2004). The latter applications are of particular interest to the authors as the practice of stope backfilling is increasingly important in mining around the world, for reasons of ground stability (e.g., Thomas et al. 1979; Singh and Hedley 1981; Hassani and Archibald 1998; Kump 2001; Jung and Biswas 2002) and also for improved mine waste management (Aubertin et al. 2002).
The backfill material placed in openings is usually much softer than that of the surrounding walls, which are often made of concrete or rock. As backfill tends to settle under its own weight, the two types of media interact in a complex manner. The characteristics of the fill material and of the walls must therefore be taken into account to evaluate the induced stress distribution in and around the openings. Numerical modeling tools constitute powerful means to investigate the response of such systems, as they can consider various factors such as natural stress conditions, excavation and placement sequence and discontinuities (e.g., Pariseau 1981; Hustrulid et al. 1989; Brummer et al. 1996; Brechtel et al. 1999; Li et al. 2003). Nevertheless, analytical methods may also provide rapid, low cost and valuable solutions for evaluating the behavior of backfilled openings (e.g., Knutsson 1981; Mitchell 1983; Aubertin et al. 2003; Belem et al. 2004; James et al. 2004). Previous work on this issue, including some recent studies conducted by the authors, indicates that the theory of arching may be well suited for estimating the earth pressures in narrow vertical openings (e.g., Handy 1985; Aubertin 1999; Take and Valsangkar 2001; Aubertin et al. 2003; Li et al. 2003). However, most existing arching solutions are based on 2D limit equilibrium analysis, in which the two long walls of the opening are identical. In some practical cases, such solutions are incomplete, especially when the backfilled opening has a limited length or when the walls have different characteristics.
Li, Aubertin and Belem 2
In this report, a general 3D analytical solution is proposed. Its validity is demonstrated, at least in part, using numerical modeling and representative experimental results. A discussion follows on the main assumptions and limitations of the proposed approach.
1.1 Arching concept and solutions
When a frictional particulate material is placed in a confined narrow opening, the fill tends to yield as it moves downward. The surrounding rigid walls then hold the yielding material by shear forces along the interfaces. Part of the load due to the weight of the material is thus transferred to the walls, so the resulting vertical stress in the fill is reduced. This type of phenomenon is known as arching (e.g., Richmond and Gardner 1962; Handy 1985; Hunt 1986).
Arching effects have been observed in many situations, particularly within silos and bins used to store particulate materials. Handling materials such as powder and grain requires an estimate of the minimum span needed to avoid the formation of a stable arch in the containers (e.g., Richards 1966; Cowin 1977; Blight 1986a,
b). The basic arching theory, initially proposed by Janssen (1895), is often used to analyse this type of situation.
Arching was later introduced to geotechnical engineering by Marston (1930) and his team, for calculating pressures on underground conduits placed in ditches (see also Handy 1985; McCarthy 1988), and by Terzaghi (1936, 1943) to evaluate the stress distribution above tunnels (e.g., Ladanyi and Hoyaux 1969; Atkinson and Caircross 1974). Arching theory has also been applied to retaining walls (Frydman and Keissar 1987; Take and Valsangkar 2001) and to dams (Kutzner 1997).
In geotechnique, many of the above mentioned types of structure have a dimension that is much larger than the other two, so most practical problems are treated with 2D (plane strain) models (e.g., Hustrulid et al. 1989; Iglesia et al. 1999; Aubertin et al. 2003). Nevertheless, there are exceptions, including the solution given by Van Horn (1964) who used the Marston theory to obtain three dimensional loads on underground structures. Three dimensional considerations have also been given to cases where one of the retaining walls around the opening is removed (e.g., Mitchell 1983).
In the powder and grain industry on the other hand, containers have finite dimensions on all sides, so three dimensional models have typically been adopted (e.g., Richmond and Gardner 1962; Richards 1966; Cowin 1977; Blight 1986a, b; Williams et al. 1987); these solutions are often axisymmetric.
With most existing (2D and 3D) solutions, a unique fill-wall friction angle is used. In practice, it is not uncommon that the walls around vertical openings have different characteristics.
In the following, a set of 3D equations is developed to evaluate the stress along vertical walls of narrow backfilled openings having different properties; the proposed equations are extensions of those recently proposed by Li et al. (2004).
2. PROPOSED 3D ANALYTICAL SOLUTIONS
2.1 Theoretical development
Figure 1 shows schematically a vertical, narrow backfilled opening, with the various forces on a layer element, based on uniformly distributed stresses on the isolated layer. This representation is based on the model proposed by Marston (1930) for 2D conditions (see also Handy 1985; McCarthy 1988). In Figure 1, H is the backfill height, B is the opening width and L is its length. The four walls are identified as 1 for left wall (LW), 2 for front wall (FW), 3 for right wall (RW) and 4 for back wall (BW). At position h, the horizontal layer element is subjected to lateral compressive forces Ci (i = 1 to 4), vertical and horizontal fill-wall shearing forces Si and Ti (i = 1 to 4), backfill material longitudinal and transverse internal shearing forces SL (and SL + dSL) and SB (and SB
+ dSB), and internal vertical forces V (and V + dV). Based on this representation, general 3D equations can be
developed, as described below.
The weight of the backfill W in the thin layer element is given by:
[1] W = γ B L dh
where γ is the unit weight of the backfill, and dh is the thickness of the layer element.
Li, Aubertin and Belem 4
[2] V = σvh B L
where σvh is the vertical stress at position h.
H B V V + dV S1 S3 C3 C1 W dh h L backfill stope void space rock mass layer element S4 C4 S2 C2 (1) (2) (3) (4) SL SL + dSL SB SB + dSB T1 T3 T4 T2 x y z
Fig. 1. A vertical backfilled opening with acting forces on an isolated layer element.
The longitudinal (SL) and transverse (SB) shearing forces are expressed as:
[3a] SL = τL B L
[3b] SB = τB B L
where τL and τB are the longitudinal and transverse shear stresses, respectively. These are also assumed to be
uniformly distributed on the horizontal plane.
Using a linear relationship between the vertical stress σvh and horizontal stress σhhi (i = 1 to 4) in the backfill
layer element, the lateral compressive force Ci (i = 1 to 4) on each wall can be expressed as: [4a] Cj = dh L σhhj = dh L Kcj σvh = dh Kcj V/B, for j = 1, 3
where the coefficient of lateral pressure Kci (i = j, k) is the ratio of the horizontal stress to vertical stress at the ith
fill-wall interface:
[5] Kci = σhhi/σvh
For conditions where the walls do not move and the lateral strain is zero (the “at rest” condition), the coefficient of lateral pressure can be empirically defined as (Jaky 1948):
[6] Kci = K0i = 1 - sinφ
The value of K0i could also be defined using an elastic solution, as a function of Poisson ratio ν (Jaeger and Cook
1979). For typical values of φ and ν, the values of K0i obtained by both approaches are often very similar.
In some cases, the wall may move outward, away from the opening, due to the backfill pressure. In such a case, the coefficient Kci is sometimes approximated by the Rankine active earth pressure coefficient (see
discussion below). The reaction coefficient is then expressed as:
[7]
°
−
−
=
2
45
tan
2
v a cφ
σ
h i ic
K
K
where [8]φ
φ
sin
1
sin
1
a+
−
=
iK
For in situ cases where the fill is placed between walls already under elastic equilibrium, the reaction coefficient can be expected to be somewhere between K0i and Kai.
Similarly, for a wall that moves inside the opening (due to convergence), Kci can be taken (as a first
approximation) as the Rankine passive pressure, which can be expressed as:
[9]
°
+
+
=
2
45
tan
2
v p cφ
σ
h i ic
K
K
whereLi, Aubertin and Belem 6 [10]
φ
φ
sin
1
sin
1
p−
+
=
iK
In these equations, φ and c are the friction angle and cohesion of the fill material, respectively. Eqs [6], [7] and [9] can be rewritten in a unified format, as:
[11] i h i i
c
K
K
α
σ
tan
2
v c=
+
The values for Ki and αi in eq. [11] are given in Table 1; c in eq. [11] and φ in Table 1 are cohesion and friction angle of the fill material, respectively. For typical backfill problems with almost fixed walls, the actual value of
Ki is expected to be between the at rest (K0) and active (Ka) states, depending on the position in the opening, as
was described by Frydman and Keissar (1987). Hence, calculations shown below will include both values of the coefficient of lateral pressure.
Table 1. Definition of Ki and αi (in eq. [11]) for different fill pressureconditions.
Fill condition Ki αi At rest (K0) 1 - sinφ 0° Active (Ka)
φ
φ
sin
1
sin
1
+
−
°
− 45
2
φ
Passive (Kp)φ
φ
sin
1
sin
1
−
+
2
45
°
+
φ
The Coulomb criterion is used to define the shearing forces Si (i = 1 to 4) along the walls: [12a] Sj = (σhhj tanδj + cj) L dh = (Kcj σvh tanδj + cj) L dh, for j = 1, 3
[12b] Sk = (σhhk tanδk + ck) B dh = (Kck σvh tanδk + ck) B dh, for k = 2, 4
where δi and ci (i = j, k) are the friction angle and cohesion of the ith fill-wall interface, respectively. Static equilibrium of the layer element in the vertical (z) direction implies that:
[13]
∑
=+
=
4 1d
i iS
V
W
Introducing eqs. [1], [2] and [12] into eq. [13] gives the following:
[14]
tan
tan
tan
tan
0
d
d
c1 1 c3 3 c2 2 c4 4 1 3 2 4 v v
−
=
+
+
+
+
+
+
+
+
σ
δ
δ
δ
δ
γ
σ
L
c
c
B
c
c
L
K
K
B
K
K
h
h hCombining eqs. [11] and eq. [14], one then obtains:
[15]
0
d
d
13 24 13 24 v v
−
=
+
+
+
+
σ
λ
λ
κ
κ
γ
σ
L
B
L
B
h
h h where [16] 4 4 2 2 24 3 3 1 1 13tan
tan
tan
tan
δ
δ
λ
δ
δ
λ
K
K
K
K
+
=
+
=
and [17](
(
)
)
4 4 2 2 4 2 24 3 3 1 1 3 1 13tan
tan
tan
tan
2
tan
tan
tan
tan
2
δ
α
δ
α
κ
δ
α
δ
α
κ
+
+
+
=
+
+
+
=
c
c
c
c
c
c
with δi ≤ φ and ci ≤ c (i = 1 to 4). Note that for δi > φ and/or ci > c along the interface, yielding is expected to take place in the fill (rather than directly along the fill-wall interface), so the values of φ and c are taken for δi and ci, respectively.
From eq. [15], the vertical stress acting across the horizontal plane at position h is deduced as follows:
[18]
{
1
exp
(
(
)
)
}
)
(
)
(
1 24 1 13 1 24 1 13 1 24 1 13 v − − − − − −+
−
−
+
+
−
=
h
B
L
L
B
L
B
hλ
λ
λ
λ
κ
κ
γ
σ
With this equation, it can be shown that the value of the vertical stress tends toward the overburden pressure (γh) when the size of the opening (B, L) is large enough (i.e. when arching effects become negligible).
The horizontal stress σhhi can now be obtained from eqs. [5], [11] and [18]:
[19]
σ
hhi=
K
iσ
vh+
2
c
tan
α
iLi, Aubertin and Belem 8
[20a] (S2 – S4) L + (2SL + dSL) dh = 0
[20b] (S1 – S3) B + (2SB + dSB) dh = 0
By neglecting the second order terms (dSBdh and dSLdh) which are very small, eqs. [20a, b] give:
[21a] SL = L (S4 – S2)/(2dh)
[21b] SB = B (S3 – S1)/(2dh)
Introducing eqs. [3] and [12] into these last two equations, the longitudinal (τL) and transverse (τB) shear
stresses can be deduced as: [22a]
2
2
tan
tan
4 2 v 2 2 c 4 4 c Lc
c
K
K
h−
+
−
=
δ
δ
σ
τ
[22b]2
2
tan
tan
3 1 v 1 1 c 3 3 c Bc
c
K
K
h−
+
−
=
δ
δ
σ
τ
Replacing Kci of eqs. [22a, b] by eq. [11], one obtains:
[23a]
(
)
2
tan
tan
tan
tan
2
2
tan
tan
4 2 4 4 2 2 v 2 2 4 4 Lδ
α
δ
α
σ
δ
δ
τ
=
K
−
K
h+
c
−
c
+
c
−
[23b](
)
2
tan
tan
tan
tan
2
2
tan
tan
3 1 3 3 1 1 v 1 1 3 3 Bδ
α
δ
α
σ
δ
δ
τ
=
K
−
K
h+
c
−
c
+
c
−
In general, the two opposite walls react in the same manner so that K1 = K3, K2 = K4, α1 = α3 and α2 = α4. In
this case, eqs. [16] and [17] become:
[24a]
(
)
(
2 4)
2 24 3 1 1 13tan
tan
tan
tan
δ
δ
λ
δ
δ
λ
+
=
+
=
K
K
[24b] 2 4 2 4 2 24 1 3 1 3 1 13)tan
tan
(tan
2
)tan
tan
(tan
2
α
δ
δ
κ
α
δ
δ
κ
+
+
+
=
+
+
+
=
c
c
c
c
c
c
Eqs. [18], [19], [23], and [24] represent the proposed 3D general solution for the stresses in vertical backfilled openings.
2.2 Special cases
When the four fill-wall interfaces have the same cohesion c, equal to that of the backfill, the following parameters are used in eqs. [18] and [19]:
[25a]
(
)
(
2 4)
2 24 3 1 1 13tan
tan
tan
tan
δ
δ
λ
δ
δ
λ
+
=
+
=
K
K
[25b](
)
(
2 4 2)
24 1 3 1 13)tan
tan
(tan
1
2
)tan
tan
(tan
1
2
α
δ
δ
κ
α
δ
δ
κ
+
+
=
+
+
=
c
c
Eq. [23] can then be rewritten as:
[26a]
(
)
+
−
=
2 v 2 2 4L
tan
tan
2
tan
α
σ
δ
δ
τ
K
hc
[26b](
)
+
−
=
1 v 1 1 3B
tan
tan
2
tan
α
σ
δ
δ
τ
K
hc
The case of opposite walls that have the same properties may be encountered in practical situation. For instance, in backfilled mine stopes, the hanging and foot walls are often made of one rock type while the two side (lateral) walls are made of another rock type (i.e., δ1 = δ3, δ2 = δ4, c1 = c3, and c2 = c4). In this particular case,
eq. [18] becomes:
[27]
(
(
)
)
{
1 exp(
2 ( tan tan ))
}
tan tan 2 ) tan tan 2 ( ) tan tan 2 ( 2 2 2 1 1 1 1 2 2 1 1 1 1 1 2 2 2 1 1 1 1 v δ δ δ δ δ α δ α γ σ h B K L K K L K B L c c B c c h − − − − − − + − − + + + + − =
It is also possible that the four walls around the opening are composed of a single material (i.e., δ1 = δ2 = δ3 =
δ4 = δ and c1 = c2 = c3 = c4 = c); eq. [18] then becomes:
[28]
(
(
)
)
{
(
δ
)
}
δ
δ
α
δ
α
γ
σ
1
exp
2
(
)tan
tan
2
)
tan
tan
2
(1
)
tan
tan
2
1
(
2
2 1 1 1 2 1 1 1 1 2 1 1 vh
B
K
L
K
K
L
K
B
L
B
c
h − − − − − −+
−
−
+
+
+
+
−
=
If the four walls react in the same manner, K1 = K2 = K3 = K4 = K, and α1 = α2 = α3 = α4 = α, and eq. [28]
Li, Aubertin and Belem 10 [29]
(
)
(
)
{
(
δ
)
}
δ
δ
α
γ
σ
1
exp
2
(
)tan
tan
2
tan
tan
2
1
2
1 1 1 1 1 v − − − − −+
−
−
+
−
+
=
hK
B
L
K
c
L
B
hThis would be equivalent to the Van Horn's (1964) solution if the fill is in at rest state (α = 0) or for a cohesionless material (c = 0).
If the opening length is significantly larger than its width (i.e. L >> B), eq. [29] reduces to a 2D solution:
[30]
{
(
δ
)
}
δ
δ
α
γ
σ
1
exp
2
tan
tan
2
)
tan
tan
2
1
(
2
1 v−
−
−+
−
=
KhB
K
c
B
hFor a friction angle of the fill equal to or smaller than the fill-wall friction angle (i.e. φ ≤ δ), one can then write: [31]
{
(
φ
)
}
φ
φ
α
γ
σ
1
exp
2
tan
tan
2
)
tan
tan
2
1
(
2
1 v−
−
−+
−
=
KhB
K
c
B
hFor a cohesionless fill, eq. [31] reduces to one of the Marston's equations (McCarthy 1988; Aubertin et al. 2003) as: [32]
−
−
=
−φ
φ
γ
σ
tan
2
)
tan
2
exp(
1
1 vK
KhB
B
h2.3 Graphical representation
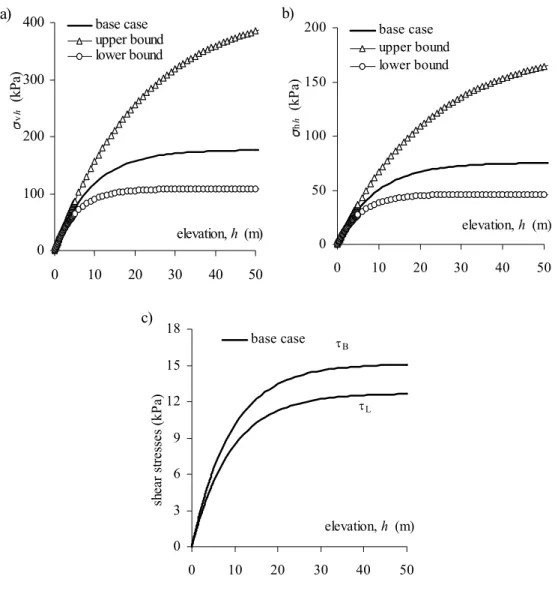
Figure 2 shows the vertical (Fig. 2a), horizontal (Fig. 2b) and shear (Fig. 2c) stress variation in a backfilled opening using the general 3D solution (eqs. [18], [19] and [23]) with the fill and walls at rest (K1 = K2 = K3 = K4
= K = 1 - sinφ and α1 = α2 = α3 = α4 = α = 0); a single fill-wall interface cohesion is considered (c1 = c2 = c3 = c4
= c = 1 kPa). For this illustrative example, the opening size is B = 5 m and L = 10 m. The fill internal friction angle, φ, is 35°, while the fill-wall friction angles are δ1 = 10°, δ2 = 20°, δ3 = 30°, and δ4 = 35°. The arching
effect can be clearly observed for each case. All the graphs in Fig. 2 show that the stress magnitude in the fill is reduced, compared to overburden stresses, when depth increases. It can also be seen that the internal shear
stresses τB and τL are not nil (Fig. 2c), as would be the case for a single side wall friction angle δ. It can equally
be seen that the vertical (Fig. 2a) and horizontal (Fig. 2b) stresses would be overestimated (for δ1 = δ2 = δ3 = δ4 =
10°; upper limit) or underestimated (for δ1 = δ2 = δ3 = δ4 = 35°; lower limit) if a single value of the fill-wall
friction angle had been used.
0 100 200 300 400 0 10 20 30 40 50 elevation, h (m) v h (k Pa ) base case upper bound lower bound a) 0 50 100 150 200 0 10 20 30 40 50 elevation, h (m) h h (k P a) base case upper bound lower bound b) 0 3 6 9 12 15 18 0 10 20 30 40 50 elevation, h (m) sh ea r st re ss es (k P a) base case τL τB c)
Fig. 2. Calculated values of vertical (a), horizontal (b), and shear (c) stresses versus elevation h; B = 5 m, L = 10 m, c1 = c2 = c3 = c4 = c = 1 kPa, φ = 35°, γ = 0.02 MN/m3; the fill is at rest (K1 = K2 = K3 = K4 = K = 1 - sinφ and α1 = α2 = α3 = α4 = α
= 0); three cases are concerned: a base case (δ1 = 10°, δ2 = 20°, δ3 = 30°, δ4 = 35°), the upper bound limit (δ1 = δ2 = δ3 = δ4 = 10°) and the lower bound limit (δ1 = δ2 = δ3 = δ4 = 35°).
Li, Aubertin and Belem 12
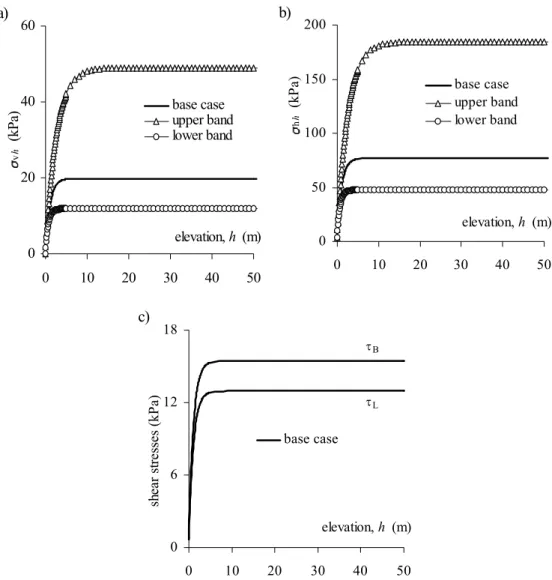
Stress distributions are shown for the case where the reaction coefficient Ki is defined from the active (Fig. 3) and passive (Fig. 4) state. Under an active state, the vertical load at depth is larger than for the “at rest case” (compare Figs. 2 and 3). For the passive case (Fig. 4), the vertical (Fig. 4a), horizontal (Fig. 4b) and shear (Fig. 4c) stresses rapidly increase at small depth and become constant for a deeper opening. These stresses are much smaller than for the active and at rest cases, indicating a more developed arching effect in the backfilled opening.
0 100 200 300 400 500 0 10 20 30 40 50 elevation, h (m) v h (k Pa ) base case upper bound lower bound a) 0 50 100 150 200 0 10 20 30 40 50 elevation, h (m) h h (k P a) base case upper bound lower bound b) 0 6 12 18 0 10 20 30 40 50 elevation, h (m) sh ear s tr es ses ( kP a) base case τL τB c)
Fig. 3. Calculated values of vertical (a), horizontal (b), and shear (c) stresses versus elevation h; B = 5 m, L = 10 m, c1 = c2 = c3 = c4 = c = 1 kPa, φ = 35°, γ = 0.02 MN/m3; the fill is in active state (K1 = K2 = K3 = K4 = K, α1 = α2 = α3 = α4 = α; see Table 1); base case (δ1 = 10°, δ2 = 20°, δ3 = 30°, δ4 = 35°), upper bound limit (δ1 = δ2 = δ3 = δ4 = 10°) and lower bound limit
0 20 40 60 0 10 20 30 40 50 elevation, h (m) v h (k Pa
) base caseupper band
lower band a) 0 50 100 150 200 0 10 20 30 40 50 elevation, h (m) h h (k P a) base case upper band lower band b) 0 6 12 18 0 10 20 30 40 50 elevation, h (m) sh ea r st re ss es (k P a) base case τL τB c)
Fig. 4. Calculated values of vertical (a), horizontal (b), and shear (c) stresses versus elevation h; B = 5 m, L = 10 m, c1 = c2 = c3 = c4 = c = 1 kPa, φ = 35°, γ = 0.02 MN/m3; the fill is in passive state (K1 = K2 = K3 = K4 = K, α1 = α2 = α3 = α4 = α; see
Table 1); base case (δ1 = 10°, δ2 = 20°, δ3 = 30°, δ4 = 35°), the upper bound limit (δ1 = δ2 = δ3 = δ4 = 10°) and the lower bound limit (δ1 = δ2 = δ3 = δ4 = 35°).
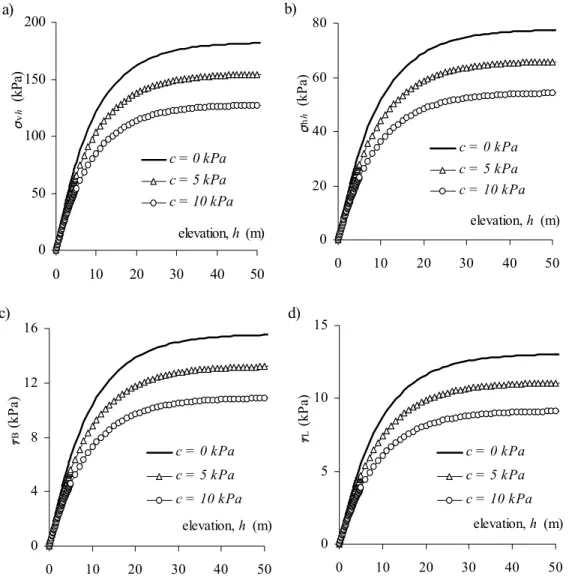
The influence of cohesion on the vertical (Fig. 5a), horizontal (Fig. 5b) and shear (Figs. 5c and 5d) stresses is shown in Fig. 5 for the case where the fill is at rest state (K1 = K2 = K3 = K4 = K = 1 - sinφ and α1 = α2 = α3 = α4
= α = 0). One can see that increasing the internal cohesion of fill decreases the stress magnitude; this is in accordance with field observations (e.g., Grice 1989).
Li, Aubertin and Belem 14
solution (eq. [29]) are compared to those obtained with the two dimensional solution (eq. [30]). It shows that both the vertical and horizontal stress magnitudes are significantly overestimated by the two dimensional solution, and the overestimation increases with depth. Figure 7 shows that this overestimation becomes smaller when the opening is longer (at high L:B ratio). The difference between the stress value provided by the two solutions depends on material properties (c, φ) and dimension of the openings (B, L, h) (see Discussion below).
0 50 100 150 200 0 10 20 30 40 50 elevation, h (m) v h (k Pa ) c = 0 kPa c = 5 kPa c = 10 kPa a) 0 20 40 60 80 0 10 20 30 40 50 elevation, h (m) h h (k P a) c = 0 kPa c = 5 kPa c = 10 kPa b) 0 4 8 12 16 0 10 20 30 40 50 elevation, h (m) B (k P a) c = 0 kPa c = 5 kPa c = 10 kPa c) 0 5 10 15 0 10 20 30 40 50 elevation, h (m) L (k P a) c = 0 kPa c = 5 kPa c = 10 kPa d)
Fig. 5. Calculated values of vertical (a), horizontal (b), transverse (c), and longitudinal shear (d) stresses versus elevation h;
B = 5 m, L = 10 m, φ = 35°, γ = 0.02 MN/m3, δ
1 = 10°, δ2 = 20°, δ3 = 30°, and δ4 = 35°; the fill is in at rest state (see Table 1).
0 50 100 150 200 250 0 2 4 6 8
height to width ratio, h /B
v h (k P a) 3D 2D a) 0 40 80 120 0 2 4 6 8
height to width ratio, h /B
h h (k P a) 3D 2D b)
Fig. 6. Calculated values of vertical (a), horizontal (b) stresses versus the ratio h/B obtained using 2D (eq. [30]) and 3D (eq.
[29]) solutions with the fill in at rest state (see Table 1); B = 6 m, L = 10 m, c = 0.001 MPa, δ = φ = 30°, K = 1 - sinφ = 0.5, γ = 0.02 MN/m3. 0 50 100 150 0 4 8 12 16
length to width ratio, L /B
v h (k Pa ) 3D 2D a) 0 20 40 60 80 0 4 8 12 16
length to width ratio, L /B
h h (k Pa ) 3D 2D b)
Fig. 7. Calculated values of vertical (a), horizontal (b) stresses versus length to width ratio L/B obtained using the 2D (eq.
[30]) and 3D (eq. [29]) solutions with the fill in at rest state (see Table 1); B = 6 m, h = 10 m, c = 0.001 MPa, δ = φ = 30°, γ = 0.02 MN/m3.
3. COMPARISON WITH NUMERICAL MODELING RESULTS
Numerical modeling results obtained by Li et al. (2003) with FLAC-2D (Itasca 2002) and a few new cases have been used for comparison purposes, to help assess the proposed analytical solutions. The geometry of the
Li, Aubertin and Belem 16
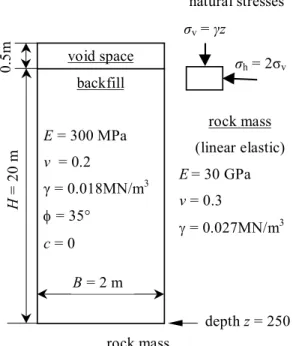
rock mass is linearly elastic while the fill is modeled as a nonlinear elastoplastic Coulomb material. A one step mining and one step backfilling sequence is considered; hence, wall convergence occurs before the backfill is put in place. backfill E = 300 MPa v = 0.2 γ = 0.018MN/m3 φ = 35° c = 0 rock mass (linear elastic) E= 30 GPa v = 0.3 γ = 0.027MN/m3 σv = γz σh = 2σv H = 2 0 m B = 2 m depth z = 250 0. 5m void space natural stresses rock mass
Fig. 8. Numerical model geometry of a narrow backfilled stope (not to scale) for FLAC-2D (Itasca 2002); the main
properties for the rock mass and backfill are given using classical geomechanical notations.
For this 2D problem, the following equations are used to compare the analytical solution with some of the numerical modeling results:
[33]
{
(
1)
}
13 13 13 v1
exp
−−
−
−
=
B
h
B
hλ
λ
κ
γ
σ
with [34](
)
(
1 3)
1 3 1 13 3 1 1 13tan
tan
tan
2
tan
tan
α
δ
δ
κ
δ
δ
λ
+
+
+
=
+
=
c
c
c
K
Two cases are selected to illustrate the results for two sets of material parameters:
1) Granular fill: c1 = c3 = c = 0 kPa, δ1 = δ3 =
φ =
35°. The results obtained from eqs. [19] and [33] and fromfill is considered at rest or in an active state (the passive state does not apply here). Arching effects are clearly visible, reducing the vertical stress gradient as depth is increased. In all simulations, the vertical stress is close to the vertical overburden stress (γh) at low depth, but it progressively deviates from this tendency to reach a plateau when h/B is high enough.
2) Granular fill, with different wall friction properties: c1 = c3 = c = 0 kPa, δ1 = 25°, δ3 =
φ =
35°. In this case,shear stress appears in the horizontal planes. As seen in Fig. 10, the proposed equations (with K = K0 and Ka)
appear suitable for this case (see Figs. 10a, b, c), accounting for the internal shear stress in the fill. Although the numerical and analytical results shown in Fig. 10 (and others; not presented here) are not identical, they show the same tendencies with about the same stress magnitudes. Considering the basic assumptions and simplifications made with the numerical modeling (e.g., Aubertin et al. 2003; Li et al. 2003), the correspondence between the two sets of results is deemed satisfactory for this preliminary assessment.
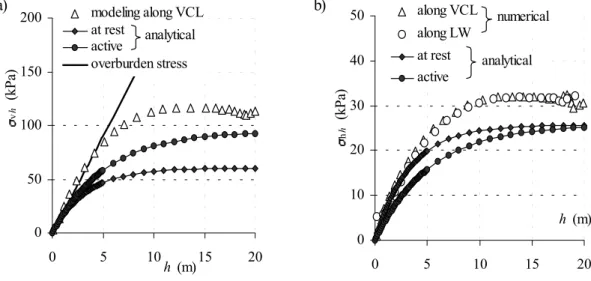
0 50 100 150 200 0 5 10 15 20 h (m) v h (k Pa ) modeling along VCL at rest active overburden stress analytical a) 0 10 20 30 40 50 0 5 10 15 20 h (m) h h (k Pa ) along VCL along LW at rest active analytical numerical b)
Fig. 9. Comparison of vertical (a), and horizontal (b) stresses along the vertical central line (VCL) and left wall (LW)
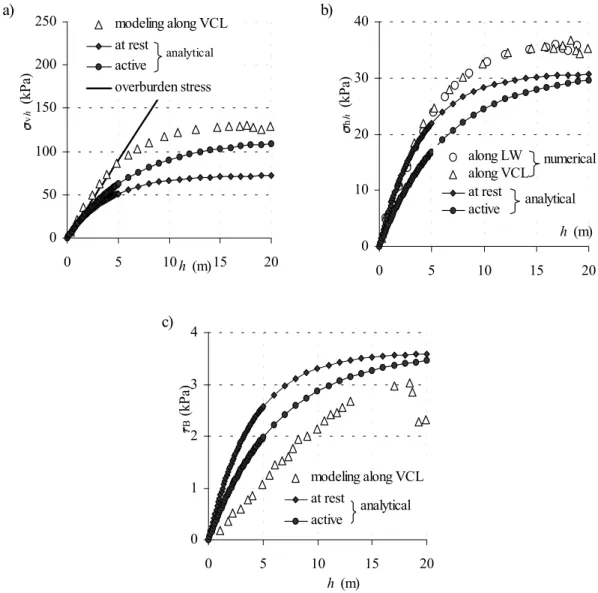
Li, Aubertin and Belem 18 0 50 100 150 200 250 0 5 10h (m)15 20 v h (k Pa ) modeling along VCL at rest active overburden stress analytical a) 0 10 20 30 40 0 5 10 15 20 h (m) h h (k Pa ) along LW along VCL at rest active analytical numerical b) 0 1 2 3 4 0 5 10 15 20 h (m) B (k Pa ) modeling along VCL at rest active analytical c)
Fig. 10. Comparison between the numerical model and the analytical solutions for vertical (a), horizontal (b) and shear (c)
stresses versus the opening height, with c1 = c3 = c = 0 kPa, δ1 = 25°, δ3 = φ = 35°.
4. APPLICATION TO LABORATORY DATA
Centrifuge test results were reported by Take and Valsangkar (2001). In these experiments, earth pressure cells were mounted inside a backfilled box with aluminum walls. To investigate the effect of boundaries with dissimilar frictional characteristics, one of the aluminum surfaces was covered with a sheet of 120A-grit sandpaper (Take 1998). The backfill used in these tests was a poorly graded sand with little or no fines. The maximum and minimum dry densities were 1.62 and 1.34 g/cm3, respectively. Angles of internal friction (φ) and
of 35.7g (g is the gravity acceleration) to simulate a 5 m high retaining wall prototype. With this acceleration, the equivalent unit weight of the dense backfill (having a 79% relative density) is 0.554 MN/m3, while that of the
loose backfill (34% relative density) becomes 0.508 MN/m3. Table 3 gives the conditions and parameters for the
different cases.
Table 2. Internal (φ) and interface (δ) friction angles for the backfill (after Take and Valsangkar 2001). Loose backfill (34% Dense backfill (79% relative density, relative density, density 1.42 g/cm3) density 1.55 g/cm3)
φ backfill 30° 36°
δ backfill and aluminium 23° 25° δ backfill and sandpaper 32° 36°
Table 3. Parameters used in the calculation results presented in Figs. 11 – 13, base on data taken from Take and Valsangkar
(2001).
Figure Backfill Geometry Fill parameters Wall-fill friction angle ‡ (°)
B (cm) × L (cm) c γ † φ (°) δ 1 δ2 δ3 δ4 11a dense 18.4 × 25.4 0 0.554 36 25 25 25 25 11b dense 7.5 × 25.4 0 0.554 36 25 25 25 25 11c dense 3.8 × 25.4 0 0.554 36 25 25 25 25 11d dense 1.5 × 25.4 0 0.554 36 25 25 25 25 12a dense 18.4 × 25.4 0 0.554 36 25 36 25 25 12b dense 7.5 × 25.4 0 0.554 36 25 36 25 25 12c dense 3.8 × 25.4 0 0.554 36 25 36 25 25 12d dense 1.5 × 25.4 0 0.554 36 25 36 25 25 13a loose 3.8 × 25.4 0 0.508 30 23 32 ‡ 23 23 13b loose 1.5 × 25.4 0 0.508 30 23 32 ‡ 23 23 † Values obtained by multiplying the backfill density by the centrifuge acceleration (in MN/m3);
Li, Aubertin and Belem 20
A first series of tests was conducted on dense backfill. The walls were not covered, so φ = 36°, δ1 = δ2 = δ4 =
δ3 = 25°. Figure 11 shows the comparison between the experimental results and the proposed analytical solution
(eqs. [19] and [29]). At rest (K0) and active (Ka) states are considered here (K1 = K2 = K3 = K4 = K and α1 = α2 =
α3 = α4 = α; see Table 1 for values of K and α). The horizontal stress based on the overburden calculation is also
plotted for the four geometries considered (L = 25.4 cm and B = 1.5, 3.8, 7.5 and 18.4 cm; see Table 3). The proposed analytical solution describes the experimental results quite well, and confirms the existence of stress transfer to the abutment (due to the arching effect).
Another series of tests was performed by Take and Valsangkar (2001) with this same dense backfill, with wall 2 covered with sandpaper to simulate a rough surface. In this case, φ = 36°, δ1 = δ3 = δ4 = 25°, δ2 = 36°.
There were no solutions available to analyze this type of test which includes two different fill-wall friction angles. Take and Valsangkar (2001) used two dimensional calculations with upper and lower parameter bounds to compare to their experimental results. Here, the proposed general analytical solution (eqs. [18] and [19]) is used to evaluate this situation in more detail. Figure 12 shows a comparison between the experimental results and the proposed solution for at rest and active states (K1 = K2 = K3 = K4 = K and α1 = α2 = α3 = α4 = α; see
Table 1 for values of K and α). Again, the newly developed equations describe the experimental results well (with the parameters given in Table 3).
Take and Valsangkar (2001) have also conducted a series of tests with loose backfill (34% relative density). The model rock face (wall 2) was again covered with sandpaper to simulate a rough surface. The friction angles are φ = 30°, δ1 = δ3 = δ4 = 23°, δ2 = 32°. As indicated previously, when the fill-wall friction angle is larger than
the fill material friction angle φ, the latter is used for the interface, so δ2 = φ = 30° is adopted here (see Table 3).
Again, the proposed general solution (eqs. [18] and [19]) with an active or an at rest state (K1 = K2 = K3 = K4 = K
and α1 = α2 = α3 = α4 = α; see Table 1 for values of K and α) gives a fairly good prediction of the experimental
0 10 20 30 0 50 100 150 h (mm) h h (k Pa ) based on overburden proposed solution data Ka K0 a) 0 10 20 30 0 50 100 150 h (mm) h h (k Pa ) based on overburden proposed solution data K0 Ka b) 0 10 20 30 0 50 100 150 h (mm) h h (k Pa ) based on overburden proposed solution data K0 Ka c) 0 5 10 15 20 0 50 100 150 h (mm) h h (k Pa ) based on overburden proposed solution data K0 Ka d)
Fig. 11. Comparison between the proposed solution (eqs. [19] and [29]) and experimental results obtained on 3D physical
model backfilled with dense sand (data taken from Take and Valsangkar 2001; see text for details).
5. EXTENSION TO CYLINDRICAL BINS
When the walls of the opening are made of one type of material, the proposed solution (eq. [18] or [29]) can be (in principal) extended to other cross section shapes, using the following equations:
[35] 2(L + B) = P
[36] L.B = A
where A is the cross sectional area and P is its perimeter. Introducing eqs. [35] and [36] into eq. [29], one obtains:
Li, Aubertin and Belem 22 0 10 20 30 0 50 100 150 h (mm) h h (k Pa ) based on overburden proposed solution exp. data K0 Ka a) 0 10 20 30 0 50h (mm)100 150 h h (k Pa ) baed on overburden proposed solution data K0 Ka b) 0 10 20 0 50 h (mm) 100 150 h h (k Pa ) based on overburden proposed solution data K0 Ka c) 0 5 10 15 0 50 100 150 h (mm) h h (k P a) based on overburden proposed solution data K0 Ka d)
Fig. 12. Comparison between the proposed general solution (eq. [18] and [19]) and the experimental results obtained on a
3D physical model backfilled with dense sand (data taken from Take and Valsangkar 2001; see text for details).
[37]
{
(
δ
)
}
δ
δ
α
γ
σ
1
exp
tan
tan
)
tan
tan
2
1
(
/
1 v−
−
−+
−
=
KhPA
K
c
P
A
hThis equation reduces to Janssen’s formula for c = 0 (Cowin 1977). If the cross section is circular with a diameter D, eq. [37] becomes:
[38]
{
(
δ
)
}
δ
δ
α
γ
σ
1
exp
4
tan
tan
)
tan
tan
2
1
(
4
/
1 v−
−
−+
−
=
KhD
K
c
D
h0 10 20 30 0 50 100 150 h (mm) h h (k P a) based on overburden proposed solution data K0 Ka a) 0 5 10 15 20 0 50 100 150 h (mm) h h (k P a) based on overburden proposed solution data K0 Ka b)
Fig. 13. Comparison between the proposed solution (eqs. [18] and [19]) and experimental results obtained on a 3D physical
model backfilled with loose sand (data taken from Take and Valsangkar 2001; see text for details).
Figs. 14 to 16 show a comparison between experimental results obtained in silos and the proposed analytical solution (eq. [38]) with K = K0 (at rest state) and Ka (active state). Material properties and parameters used here
are taken from Blight (1986a, b) and are given in Table 4. One can see that the proposed solution reproduces the experimental results well.
Table 4. Parameters used in the calculation results presented in Figs. 14 – 16, base on data taken from Blight (1986a, b).
Figure Backfill Wall D (m) c γ (kN/m3) φ (°) δ (°) Reference
14 coal concrete 20 0 8.1 40 36 Blight 1986a
15 wheat and barley concrete 7 0 7.8 24 24 Hartlen et al. 1984 16 fine powder --- 15 0 11.5 38 36 Blight 1986b
Li, Aubertin and Belem 24 0 50 100 150 200 0 10 20 30 40 50 h (m) h h (k P a) based on overburden proposed solution exp. data K0 Ka
K
0Fig. 14. Comparison between the proposed solution (eq. [38]) and the experimental measurements made in coal load-out
silo; D = 20 m (data taken from Fig. 6 in Blight 1986a).
0 50 100 150 200 0 10 20 30 40 50 h (m) h h (k P a) based on overburden proposed solution exp. data K0 Ka
K
0Fig. 15. Comparison between the proposed solution (eq. [38]) and the experimental measurements made in a grain silo; D =
0 50 100 150 200 0 10 20 30 40 50 h (m) h h (k P a) based on overburden proposed solution exp. data K0 Ka
K
0Fig. 16. Comparison between the proposed solution (eq. [38]) and the experimental measurements made in a fine powder
silo; D = 15 m (data taken from Fig. 5 in Blight 1986b).
6. DISCUSSION
A general 3D analytical solution (eqs. [18], [19] and [23]) has been developed based on the arching theory, using the Marston solution as a starting point. The proposed solution has been shown in the previous sections to provide representative estimates for the earth pressures in backfilled openings with four walls having different interface properties. However, the potential user should keep in mind that this analytical solution is based on some simplifying assumptions. Some key aspects are recalled below.
The analytical solutions presented above (eqs. [18], [19] and [23]) are based on the approach proposed by Marston (1930) and co-workers, which has been extended here for generalized 3D conditions. The approach divides the narrow, vertical backfilled opening into thin horizontal layer elements on which acts a uniform state of stress. The contact stress between the fill and walls is expressed as a function of the coefficient of lateral earth pressure Kci (i = 1 to 4). When the wall does not move, an 'at rest' condition can be adopted to define Kci (= K0,
see eq. [6]). However, for cases where an outward displacement is expected to occur at the interface, the value of
Kci has become a topic of investigation and discussion for many arching problems (e.g., Krynine 1945; Handy
Li, Aubertin and Belem 26
In many practical applications of arching equations ensuing from Janssen’s (1895) basic theory, problems with outward movement of the walls have been linked to active earth pressure conditions, so the Rankine active earth pressure coefficient is often used (i.e. Kci = Ka). The use of Ka is, however, known to be strictly
(theoretically) incorrect as the Rankine active coefficient defines the ratio of the principal stresses σ3/σ1 (where
σ3 and σ1 are the minor and major principal stress, respectively). For an opening backfilled with a soft, yielding
material, shearing along the interface induces a rotation of the stresses. Thus, the horizontal and vertical stresses acting on the wall are not the principal stresses if a shear stress is induced (as is expected to occur with frictional materials).
Both analytical solutions and numerical modeling results show that there is indeed a rotation of the principal stresses, and that the stresses are not distributed uniformly in the horizontal layer element (e.g., Handy 1985; Li et al. 2003).
Data presented by Frydman and Keissar (1987) show that the value of the σh/(γh) ratio (horizontal stress over
vertical overburden pressure) is typically close to K0 near the surface of the fill, and progressively decreases with
depth to values below Ka (down to about 1/3 to 1/2 Ka). This would tend to indicate that adopting Kci = Ka would
overestimate σh. However, with the approach proposed here, Kci has been defined by the ratio of the horizontal
(σhh) to vertical (σvh) stress at a given position h. In this definition of Kci, the value of σvh is obtained from the
arching equation, so it can be much smaller than the overburden weight of the fill column. Comparisons made with both numerical and experimental results tend to indicate that the calculated value of σhh is generally close to
the expected value. Hence, the simplifying assumptions adopted to develop the analytical solutions and to define
Kci are seen to provide realistic estimates of the earth pressure on the boundaries.
Considering the other uncertainties encountered in such types of geotechnical applications (including opening geometry and material properties), the proposed solution is hence considered an acceptable compromise with more rigorous definitions of earth pressure (when K0 or Ka are used for Kci).
A similar argument could be made for conditions where there is an inward displacement of the walls. This could be the case, for example, with cut and fill stopes excavated and backfilled progressively. In such
situations, depending on the amount of wall convergence and backfill compression, the confined fill can even be submitted to a horizontal pressure that exceeds the value obtained from a Rankine passive coefficient Kp (e.g.
Aubertin et al. 2003). This aspect, however, requires more work before it can be assessed more completely, as wall sizes, interface properties, and filling sequence are known to have a large influence on such passive earth pressure (e.g., Bransby and Smith 1975; Li et al. 2003).
Another aspect that will require more work is the influence of pore pressure under saturated and unsaturated conditions, and backfill material response in confined openings.
Finally, even if the solution proposed here was developed for vertical openings, it could also be applicable for sub-vertical openings when the stresses on each side have about the same magnitude (e.g., Knutsson 1981). A more complete extension to inclined openings is nevertheless needed for general applications and has been object of publications (e.g., James et al. 2004; Li et al. 2005).
7. CONCLUSION
The stress components in backfilled openings are affected not only by the weight of the fill, but also by interaction between the fill and the opening walls. Some of the stress in the backfill is thus transferred to the adjacent walls through shearing forces between the fill and walls. This leads to a decrease of stress in the fill compared to the overburden stress. This phenomenon is known as the arching effect.
Based on the arching theory, a three-dimensional analytical solution was developed using the Marston method as a starting point to evaluate the earth pressures in narrow, vertical backfilled openings. Both the 3D opening geometry and the fill-wall interface properties were taken into account. It has been shown that pressure estimations which ignore different shear properties along the four walls of the opening may generate some significant errors. The proposed solution can, however, provide representative estimates for the earth pressures in backfilled openings with four walls having different interface properties. It has also been shown that the opening length has a significant influence on the earth pressure in the backfill. The length to width ratio at which the 2D solution becomes significantly different from the 3D solution is a function of opening size and material
Li, Aubertin and Belem 28
bins. The versatility and descriptive capability of the proposed solution were demonstrated by comparison with a numerical model and with experimental results taken from the literature. The proposed analytical solution can thus be used, at a preliminary phase, to estimate the earth pressure in narrow, vertical backfilled openings, including mining stopes, trenches, bins or silos.
ACKNOWLEDGEMENT
The authors acknowledge the financial support from the Institut de Recherche Robert-Sauvé en Santé et en Sécurité du Travail du Québec (IRSST) and from the participants of the Industrial NSERC Polytechnique-UQAT Chair (http://www.polymtl.ca/enviro-geremi/). The authors thank John Molson and Michael James for their review of this manuscript.
REFERENCES
Atkinson, J.H., Cairncross, A.M., James, R.G. 1974. Model tests on shallow tunnels in sand and clay. Tunnels and Tunnelling, 6(4): 28-32.
Aubertin, M. 1999. Application de la mécanique des sols pour l'analyse du comportement des remblais miniers souterrains. Short Course (unpublished lecture notes), 14e Colloque en Contrôle de Terrain, Val-d'Or, 23-24 mars 1999. Association Minière du Québec.
Aubertin, M., Bussière, B., Bernier, L. 2002. Environnement et gestion des rejets miniers. Manual on CD-ROM, Presses Internationales Polytechniques.
Aubertin, M., Li, L., Simon, R. 2000. A multiaxial stress criterion for short term and long term strength of isotropic rock media. International Journal of Rock Mechanics and Mining Sciences, 37: 1169-1193.
Aubertin, M., Li, L., Arnoldi, S., Belem, T., Bussière, B., Benzaazoua, M., Simon, R. 2003. Interaction between backfill and rock mass in narrow stopes. In P.J. Culligan, H.H. Einstein, A.J. Whittle (eds), Soil and Rock America 2003, vol. 1, pp. 1157-1164. Essen: Verlag Glückauf Essen (VGE).
Belem, T., Harvey, A., Simon, R., Aubertin, M. 2004. Measurement and prediction of internal stresses in an underground opening due to backfilling with cemented paste. Fifth International Symposium on Ground Support in Mining and Underground Construction: Ground Support 2004, 28-30 September 2004, Perth, Western Australia.
Blight, G.E. 1986a. Pressure exerted by materials stored in silos: part I, coarse materials. Géotechnique, 36(1): 33-46. Blight, G.E. 1986b. Pressure exerted by materials stored in silos: part II, fine powders. Géotechnique, 36(1): 47-56. Bowles, J.E. 1988. Foundation Analysis and Design. McGraw-Hill.
Bransby, P. L., Smith, A.A. 1975. Side friction in model retaining-wall experiments. Journal of Geotechnical Engineering Division, 101(GT7): 615-632.
Brechtel, C.E., Struble, G.R., Guenther, B. 1999. The evaluation of cemented rockfill spans at the Murray mine. In B. Amadei, Kranz, Scott, Smeallie (eds.), Rock Mechanics for Industry, vol. 1, pp. 481-487. Rotterdam: Balkema.
Brummer, R.K., Gustas, R., Landriault, D.A., Steed, C.M. 1996. Mining under backfill - Field measurements and numerical modelling. In M. Aubertin, F. Hassani, H. Mitri (eds.), Rock Mechanics: Tools and Techniques, pp. 269-276. Rotterdam: A.A. Balkema.
Chen, W.F., Liu, X.L. 1990. Limit analysis in soil mechanics. Amsterdam: Elsevier.
Cowin, S.C. 1977. The theory of static loads in bins. Journal of Applied Mechanics, 44: 409-412.
Frydman, S.F., Keissar, I. 1987. Earth pressure on retaining walls near rock mass faces. Journal of Geotechnical Engineering, ASCE, 113(6): 586-599.
Grice, A.G. Fill research at Mount Isa Mines Limited. In F.P. Hassani, M.J. Scoble and T.R. Yu (eds.), Innovations in Mining Backfill Technology; Proceedings of the 4th International Symposium on Mining with Backfill, Montreal, 2-5 October 1989, pp.15-22. Rotterdam: A.A. Balkema, The Netherlands.
Handy, R.L. 1985. The arch in soil arching. Journal of Geotechnical Engineering, ASCE, 111(3): 302-318.
Handy, R.L. 2004. Anatomy of an error. Journal of Geotechnical and Geoenvironmental Engineering, 130(7): 768-771. Harrop-Williams, K. 1989. Arch in soil arching. Journal of Geotechnical Engineering, 115(3): 415-419.
Hartlen, J., Nielsen, J., Ljunggren, L. 1984. The wall pressure in large grain silos. Swedish Council for Building Research, Stockholm.
Harvey, A. 2004. Étude comparative des contraintes triaxiales dans le remblai en pâte selon la portée des chantiers. M.Sc.A. thesis, École Polytechnique de Montréal.
Hassani, F., Archibald, J.H. 1998. Mine Backfill. CIM, CD-ROM.
Hassani, F., Fotoohi, K. 1997. Quantitative evaluation of pastefill performance to alleviate rock burst. Séminaire sur l'Emploi du Remblai en Pâte dans les Mines Souterraines, Bibliothèque Nationale du Québec, vol. 1, pp. 65-77.

![Table 1. Definition of K i and α i (in eq. [11]) for different fill pressure conditions.](https://thumb-eu.123doks.com/thumbv2/123doknet/8253131.277786/19.918.81.848.593.779/table-definition-k-α-eq-different-pressure-conditions.webp)