Publisher’s version / Version de l'éditeur:
BMC Plant Biology, 13, 1, 2013
READ THESE TERMS AND CONDITIONS CAREFULLY BEFORE USING THIS WEBSITE.
https://nrc-publications.canada.ca/eng/copyright
Vous avez des questions? Nous pouvons vous aider. Pour communiquer directement avec un auteur, consultez la première page de la revue dans laquelle son article a été publié afin de trouver ses coordonnées. Si vous n’arrivez pas à les repérer, communiquez avec nous à PublicationsArchive-ArchivesPublications@nrc-cnrc.gc.ca.
Questions? Contact the NRC Publications Archive team at
PublicationsArchive-ArchivesPublications@nrc-cnrc.gc.ca. If you wish to email the authors directly, please see the first page of the publication for their contact information.
This publication could be one of several versions: author’s original, accepted manuscript or the publisher’s version. / La version de cette publication peut être l’une des suivantes : la version prépublication de l’auteur, la version acceptée du manuscrit ou la version de l’éditeur.
For the publisher’s version, please access the DOI link below./ Pour consulter la version de l’éditeur, utilisez le lien DOI ci-dessous.
https://doi.org/10.1186/1471-2229-13-84
Access and use of this website and the material on it are subject to the Terms and Conditions set forth at
Perturbing the metabolic dynamics of myo-inositol in developing
Brassica napus seeds through in vivo methylation impacts its
utilization as phytate precursor and affects downstream metabolic
pathways
Dong, J.; Yan, W.; Bock, Cheryl; Nokhrina, K.; Keller, W.; Georges, F.
https://publications-cnrc.canada.ca/fra/droits
L’accès à ce site Web et l’utilisation de son contenu sont assujettis aux conditions présentées dans le site
LISEZ CES CONDITIONS ATTENTIVEMENT AVANT D’UTILISER CE SITE WEB.
NRC Publications Record / Notice d'Archives des publications de CNRC:
https://nrc-publications.canada.ca/eng/view/object/?id=952f9839-0719-43f8-95db-67a231ae27f1 https://publications-cnrc.canada.ca/fra/voir/objet/?id=952f9839-0719-43f8-95db-67a231ae27f1
R E S E A R C H A R T I C L E
Open Access
Perturbing the metabolic dynamics of myo-inositol
in developing Brassica napus seeds through
in vivo methylation impacts its utilization as
phytate precursor and affects downstream
metabolic pathways
Jinzhuo Dong
1†, Wei Yan
2†, Cheryl Bock
2, Kateryna Nokhrina
2, Wilf Keller
3and Fawzy Georges
2*Abstract
Background: myo-Inositol (Ins) metabolism during early stages of seed development plays an important role in determining the distributional relationships of some seed storage components such as the antinutritional factors, sucrose galactosides (also known as raffinose oligosaccharides) and phytic acid (PhA) (myo-inositol 1,2,3,4,5,6-hexakisphosphate). The former is a group of oligosaccharides, which plays a role in desiccation at seed maturation. They are not easily digested by monogastric animals, hence their flatulence-causing properties. Phytic acid is highly negatively charged, which chelates positive ions of essential minerals and decreases their bioavailability. It is also a major cause of phosphate-related water pollution. Our aim was to investigate the influence of competitive diversion of Ins as common substrate on the biosynthesis of phytate and sucrose galactosides.
Results: We have studied the initial metabolic patterns of Ins in developing seeds of Brassica napus and determined that early stages of seed development are marked by rapid deployment of Ins into a variety of pathways, dominated by interconversion of polar (Ins phosphates) and non-polar (phospholipids) species. In a time course experiment at early stages of seed development, we show Ins to be a highly significant constituent of the endosperm and seed coat, but with no phytate biosynthesis occurring in either tissue. Phytate accumulation appears to be confined mainly within the embryo throughout seed development and maturation. In our approach, the gene for myo-inositol
methyltransferase (IMT), isolated from Mesembryanthemum crystallinum (ice plant), was transferred to B. napus under the control of the seed-specific promoters, napin and phaseolin. Introduction of this new metabolic step during seed development prompted Ins conversion to the corresponding monomethyl ether, ononitol, and affected phytate accumulation. We were able to produce homozygous transgenic lines with 19% - 35% average phytate reduction. Additionally, changes in the raffinose content and related sugars occurred along with enhanced sucrose levels. Germination rates, viability and other seed parameters were unaffected by the IMT transgene over-expression. Conclusions: Competitive methylation of Ins during seed development reduces seed antinutritional components and enhances its nutritional characteristics while maintaining adequate phosphate reserves. Such approach should potentially raise the canola market value and likely, that of other crops.
Keywords: Brassica napus, Seed coat, Protein translation, Ononitol, Seed development, myo-Inositol methyltransferase, Phytic acid, Sucrose, Raffinose oligosaccharides, Galactinol
* Correspondence:fawzy.georges@nrc-cnrc.gc.ca
†
Equal contributors
2National Research Council Canada, Plant Biotechnology Institute, 110 Gymnasium Place, Saskatoon, SK S7N 0W9, Canada
Full list of author information is available at the end of the article
© 2013 Dong et al.; licensee BioMed Central Ltd. This is an Open Access article distributed under the terms of the Creative Commons Attribution License (http://creativecommons.org/licenses/by/2.0), which permits unrestricted use, distribution, and reproduction in any medium, provided the original work is properly cited.
Background
myo-Inositol is an essential component in the biosyn-thesis of an array of derivatives ranging from simple inositol phosphates to complex membrane-associated products with important cellular functions. It can be isomerized and (or) methylated to form a variety of species-specific epimers and methyl ethers. A number of these, including Ins, have been noted to accumulate mostly in osmotically challenged plants and have since been recognized as osmoprotectant metabolites [1].
Ins is also central to the biosynthesis of a number of antinutritional components such as sucrose galactosides (e.g. RFO) and inositol polyphosphates such as PhA (also known as InsP6). The synthesis of PhA predominates in
developing seeds, and constitutes the major storage form of seed phosphorus. Both Ins and its bound phosphates are released by hydrolysis upon germination.
The antinutritional properties of PhA reside in its strong binding affinity for positively charged species such as es-sential minerals (e.g. iron and zinc) and proteins, signi-ficantly lowering their bioavailability to humans and animals. As a consequence, the presence of high levels of PhA in canola seed hinders the full exploitation of the pure meal and underrates its potential as a major crop worldwide.
In contrast, PhA has been accredited as an effective antioxidant with antitumor properties and risk reduction of certain types of cancer [2]. Besides decreasing uncon-trolled cellular proliferation, PhA is also thought to cause differentiation of malignant cells resulting in re-version to the normal phenotype [3]. Further, PhA has been shown to play a critical role in many cellular events such as signaling [4], apoptosis [5,6], neuroprotection [7], as well as functioning as enzyme cofactor [8]. The antioxidant properties of PhA have also been shown to inhibit free radical formation and lower lipid peroxida-tion, making it a very efficient natural food and feed pre-servative [9]. Moreover, PhA has been shown recently to protect developing seeds against oxidative stress [10]. Because of the seemingly paradoxical and unique roles of PhA, and in view of the agronomic value placed on low phytate-containing seeds and (or) meals, total elim-ination of PhA was not our intended goal.
Phytic acid biosynthesis constitutes a uniquely com-plex process, consisting of a primary substrate, Ins, and a number of interjecting secondary Ins polyphosphate substrates from other sources and pathways [11,12]. In the primary pathway, the de novo synthesis of Ins in-volves the oxidative cyclization of glucose 6-phosphate (G-6-P) to L-myo-inositol-1-phosphate (L-Ins-1-P) by the action of a single enzyme, L-myo-inositol-1-phos-phate synthase (MIPS). It has been shown that by affec-ting the production of this enzyme directly or indirectly through mutagenesis in maize [13,14] and soybean [15]
or by genetic engineering methods in rice [16,17], soy-bean [18] and canola [19] PhA accumulation can be reduced by 20–94.5% with a concomitant increase in inorganic phosphate (Pi). Of the various transgenic
approaches reported, RNAi [18] and MIPS-cosuppression [19] transgenics yielded the lowest levels of PhA in the corresponding mature seeds (94.5 and 44%, respectively). However, the RNAi approach repor-tedly has resulted in hindered seed development [18]. Thus, in view of the fact that Ins is a key substrate in the biosynthesis of many essential cell components, we decided to assess the consequences of its metabolic diversion versus its complete elimination through MIPS down-regulation, and compare the effects associated with each approach. We reasoned that while metabolic diver-sion of Ins may not interfere with its biosynthesis, it could preferably limit its participation in PhA production.
The first MIPS product, L-Ins-1-P, appears to be in quasi equilibrium with free Ins due to the activity of a two-enzyme system, in which L-myo-inositol-1-phos-phate monophosphatase converts L-Ins-1-P to free Ins, while myo-inositol-1-kinase regenerates it (Scheme 1). Depending on the rigidity of the requirements for free Ins vs. L-Ins-1-P in the developing seed, the relative abundance of each substrate is ultimately determined by the differences in the kinetics of the two opposing reac-tions. We hypothesized that continual exclusion of free Ins from this quasi equilibrium by metabolic diversion through methylation, could drive the quasi equilibrium in the direction of free Ins. This would subsequently limit the participation of both substrates (Ins and L-Ins-1-P) in PhA biosynthesis. Towards this end, we studied the effect of over-expressing the gene encoding IMT (EC 2.1.1.129) from M. crystallinum [20] on seed PhA accu-mulation in transgenic B. napus under two different seed-specific promoters, napin and phaseolin [21]. We also examined the effect of enhancing the translational context of IMT on its gene product accumulation and PhA reduction during seed development.
Although the M. crystallinum IMT (McIMT) has been used to study the osmoprotective properties of methyl-ated cyclitols in transgenic plants [22-25], the current investigation is the first example of seed-specific McIMT-mediated metabolic diversion to reduce phytic acid biosynthesis in seed crops through in vivo methyla-tion of Ins.
Results
3H-myo-inositol metabolism in developing seeds of B.
napus
In vivo labeling of developing B. napus seeds with
3
H-myo-inositol, and subsequent fractionation of different cell components (acid-soluble, hexane-soluble, trifluoroa-cetic acid [TFA]-soluble) and cell debris revealed the
relative incorporation of3H-myo-inositol in each fraction (Figure 1). The acid-soluble fraction contains free Ins, Ins monophosphates and Ins polyphosphates. The hexane-soluble fraction consists mainly of Ins-containing phos-pholipids. The TFA-soluble fraction and cell debris mainly include tightly bound membrane components such as glycosyl-phosphatidyl inositol (GPI) protein anchors [26]. Between 15 and 20 DAP, most of the label was recovered in the acid soluble fraction, which contains PhA. After 20 DAP, a decrease in the relative content of the acid-soluble
3
H-myo-inositol-labeled fraction occurred until at least 30
DAP. A simultaneous increase in the relative amount of label incorporation appeared in the corresponding hexane-soluble fraction. After 30 DAP, the relative rates of incor-poration in the acid-soluble fraction increased again and remained high until at least 40 DAP.
Phytic acid accumulation in developing seeds of Brassica napus
HPLC analysis profiles indicate that PhA started to accu-mulate in detectable amounts during very early stages of seed development (12 DAP). Its accumulation became more pronounced at 20 DAP and continued progressively, reaching maximum levels at about 35 DAP (Figure 2). This time window (12–35 DAP) is, therefore, important in temporal targeting of molecular strategies for phytic acid reduction in canola seeds. In spite of the fact that Ins was shown to be present in both endosperm and seed coat at all stages examined (Figure 3B), no phytate accumulation was found in either tissue (Figure 2).
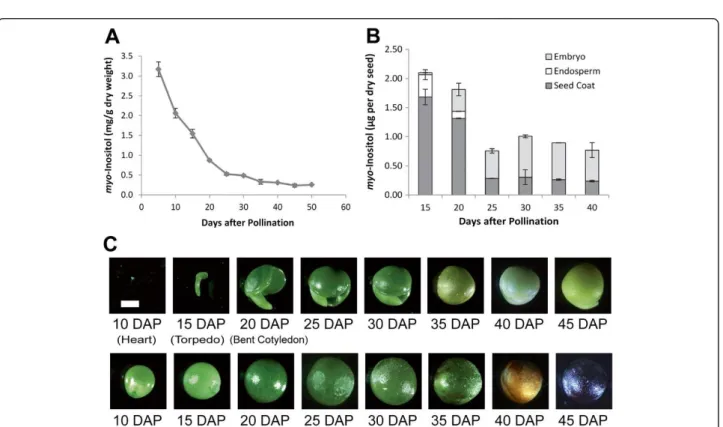
Variations in myo-inositol levels during seed development
At early stages of seed development, a steady decline in Ins levels occurred from 5 DAP up to 25 DAP (Figure 3A). These levels continued to decline further at 30 DAP, reaching their lowest point at 45 DAP through maturity. The sharp decline in the levels of Ins during the period 5–20 DAP coincided with the initial gradual accumulation of PhA (Figure 2) as well as the increase in the levels of the non-polar derivatives (Figure 1 at 15–30 DAP). At 30 DAP the rapid decline in Ins levels resumed with a
Figure 1 Differential extraction of3H-myo-inositol incorporated
in developing seeds. Developing seeds of B. napus were labeled with3H-myo-inositol (3H-Ins) and different fractions were extracted
as described in Methods. Data represent the percentage of total incorporated3H-Ins in cell debris (black); TFA, (trifluoroacetic acid)
(white); hexane (dark grey) and hydrochloric acid (light grey).
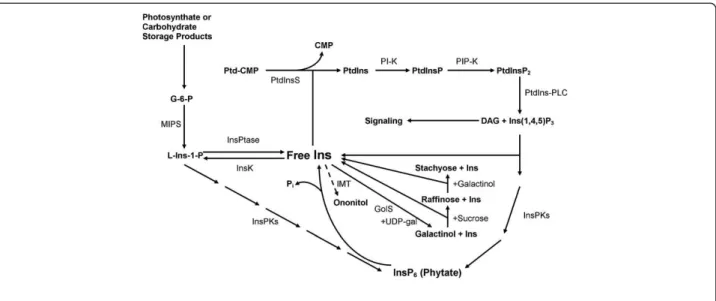
Scheme 1 Metabolic interconversions of phosphorylated myo-inositol and related derivatives in developing B. napus seeds. Dashed arrow indicates the newly introduced methylation step. Solid lines represent established metabolic pathways. PI-K, phosphatidylinositol kinase; GolS, galactinol synthase; MIPS, myo-inositol phosphate synthase; InsPKs, myo-inositol kinases; PtdInsS, PtdIns synthase; PtdIns-PLC, PtdIns-specific phospholipase C; InsPtase, myo-inositol phosphate phosphatase; InsK, myo-inositol kinase; G-6-P, glucose-6-phosphate; DAG, diacylglycerol; UDP-gal, uridine diphosphate galactose; Ptd-CMP, phosphatidylcytosine monophosphate; PtdIns, phosphatidylinositol; PtdInsP, phosphatidylinositol monophosphate; Pi, inorganic phosphate.
concomitant rise in PhA levels (Figure 2) at the expense of the non-polar components (Figure 1).
Meanwhile, as the embryo continued to expand through the different stages (Figure 3C), the level of Ins declined from its highest point in seed coat and en-dosperm and gradually increased in embryo tissues starting at 15–20 DAP (Figure 3B). At this point the rate of PhA biosynthesis in the embryo began to increase (Figure 2). No PhA synthesis was observed in either seed coat or endosperm.
Generation of transgenic lines of B. napus carrying the myo-inositol methyltransferase gene
Transgenic lines were generated from constructs pNIMT (IMT under napin promoter) and pPhIMT (IMT under phaseolin promoter). In both napin and phaseolin groups of transgenics, 80% of the lines showed reduced levels of PhA. Three transgenic lines with the highest PhA reduc-tion were chosen from each promoter group for subse-quent experiments. These were selfed to homozygosity and were shown to be consistently stable in terms of the IMTgene integrity and phytate reduction. One line from each group was chosen for further studies, namely N-11
Figure 3 Analysis of myo-Inositol in whole and dissected seed at different developmental stages. (A) Declining levels of myo-Inositol (Ins) during B. napus seed development expressed as Ins content of whole seed. Ins was analyzed in Westar seed at different developmental stages from 5 to 50 days after pollination (DAP). Each data point represents mean value of three biological replicates ±SE (standard error). (B) myo-Inositol distribution in different tissues of developing seed. Ins was measured in seed coat, endosperm and embryo at different developing stages. Data represent the amount of Ins distributed in seed coat (dark grey column), endosperm (white column) and embryo (light grey column) of one single seed. Each data point represents mean value of three biological replicates ±SE (standard error). (C) Relative sizes of the developing embryo (top row) relative to seed coat (bottom row) at various stages of seed development. The white bar represents the length of 1 mm.
Figure 2 Phytic acid accumulation during B. napus seed development in whole and dissected seed. The level of phytic acid (PhA) was measured by HPLC in Westar whole seed, seed coat, endosperm and embryo at different developmental stages from12 to 50 days after pollination (DAP). Each data point represents mean value of three biological replicates ±SE (standard error).
(napin) and Ph1-18 (phaseolin). Lines Ph2-15 and Ph3-19 originated from two more transformation events and were chosen in the same way. These lines differed from Ph1-18 in that they harbored changes in the translational con-text of the IMT gene (Table 1). In all transgenic lines germination rate was 100% for fresh seed, which did not differ from Westar controls. Additionally, over several generations the IMT transgenics did not exhibit changes in seed yield.
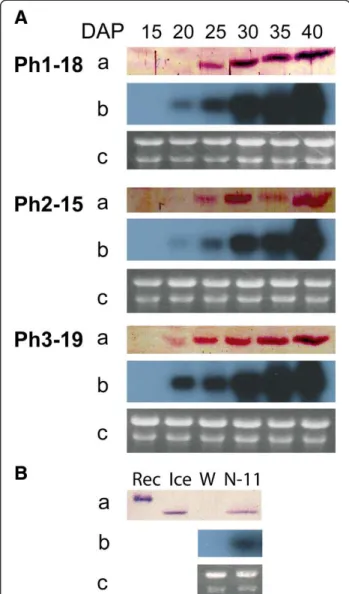
IMT expression occurs progressively in developing seeds of transgenic B. napus
In both lines of transformants (using napin and phaseolin promoters) production of IMT was verified by Western blot analysis, which also revealed absence of any na-tive equivalents of IMT in developing seeds of non-transformed B. napus (Figure 4A and 4B). Although the IMTtranscript started to appear at 20 DAP in developing transgenic seeds as exemplified by the phaseolin lines (Figure 4A), Western-blot analysis showed the corre-sponding protein to be produced in detectable amounts only after 25 DAP. The accumulation pattern of both the IMTtranscript and its corresponding protein were similar in that they increased progressively to 40 DAP. Likewise, the napin-IMT line exhibited a similar manner of protein expression at 25 DAP (Figure 4B).
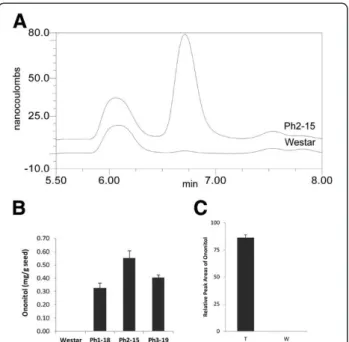
Transgenic seeds produce enzymatically active IMT and D-ononitol
HPLC analysis of mature transgenic seeds revealed the presence and accumulation of a new compound, which co-eluted with authentic D-ononitol standard (Figure 5A and 5B). The newly introduced IMT activity in trans-genic lines was further confirmed by the ability of total soluble protein extracts from 40-DAP transgenic seeds to convert Ins to D-ononitol, in an in vitro IMT enzym-atic assay (Figure 5C). Similar extracts from wild-type seeds as well as from transgenic leaves failed to produce this product. In addition, an unidentified compound eluted immediately prior to the Ins peak in the trans-genic mature seed samples (not shown), which was absent in the wild-type samples. This compound did not co-elute with an authentic sample of pinitol.
Phytic acid content is reduced and inorganic phosphate content is enhanced in the seeds of transgenic plants
HPLC analysis for phytate content in mature napin-IMT transgenic seeds showed that a 35% reduction in PhA level was achieved. HPLC analysis also showed a reduction of 19-29% in PhA in mature phaseolin-IMT seeds despite the translational context modification (Figure 6). Additionally, Pi levels increased from 10
to 31% which is consistent with earlier observations (Figure 7).
Figure 4 Gene expression analysis of napin-IMT and phaseolin-IMT transgenic lines. (A) Gene expression analysis of developing seeds of phaseolin-IMT transgenic lines Ph1-18, Ph2-15 and Ph3-19 at 15, 20, 25, 30, 35 and 40 days after pollination (DAP). (B) Gene expression analysis of midrange seed development (25 DAP) of the napin-IMT transgenic B. napus line, N-11. Panels a-c, Western analysis, Northern analysis and RNA gel. Rec, Histidine tagged recombinant IMT produced in E. coli; Ice, ice plant protein extract; W, Protein extract from Westar.
Table 1 Modified translational contexts for IMT gene driven by the phaseolin promoter
Name of construct Line Sequence
pPhIMT1 (parent-transgenic IMT) Ph1-18 A-3A-2A-1ATG A
pPhIMT2 Ph2-15 G-3C-2C-1ATG A
pPhIMT3 Ph3-19 A-3C-2C-1ATG A
Sequence column shows DNA triplets 5' upstream from the translation initiation codon: line Ph1-18 (parent IMT) with dA nucleotides in positions −1 to −3; line Ph2-15 with dC nucleotides in positions −1 and −2 and dG nucleotide in position −3; line Ph3-19 with dC nucleotides in positions −1 and −2 and dA nucleotide in position −3.
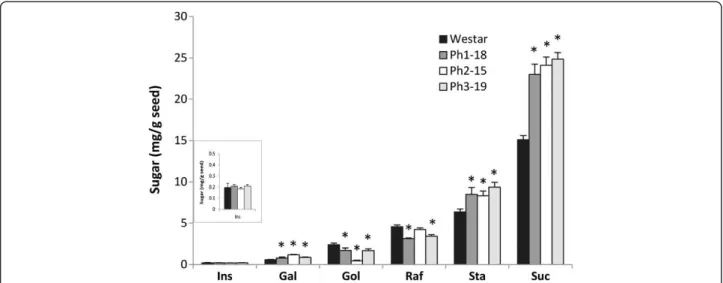
Carbohydrate analysis
Changes in the carbohydrate species associated with Ins metabolism (e.g. galactinol, RFO and sucrose) were observed in mature transgenic seeds. In the three lines examined, the changes were consistent with the
competition for available Ins among three pathways (PhA, galactinol and ononitol production, Scheme 1). Such competition appears to have resulted in the reduc-tion of galactinol biosynthesis with consequential down-stream effects, which are reflected by increases in galactose and sucrose levels with a concomitant decrease in raffinose level. However, the decrease in raffinose level appears to be accompanied by a proportionate rise in stachyose (Figure 8).
Discussion
The relative incorporation of 3H-Ins in the different fractions of developing B. napus seeds, presented in Figure 1, depicts an image of the dynamics of Ins partici-pation in phospholipid and PhA biosynthesis at early to mid stages of development. The data suggests the oc-currence of horizontal interconversions between 3H-Ins and its polar and non-polar phosphorylated variants. Evidence of this is seen at 20 and 30 DAP where sub-stantial shifts seem to occur across the hexane- and acid-soluble fractions.
The observed decrease in the relative contents of the acid-soluble fraction in the period 20–25 DAP reflects the utilization of myo-inositol in the biosynthesis of non-polar compounds (e.g. phospholipids). This is sup-ported by the observation that a parallel increase in the relative amounts of label incorporation appeared in the hexane-soluble fraction during the same period. After 30 DAP, the relative rates of incorporation in the acid-soluble fraction increased again at the expense of the non-polar fraction, reflecting the rapid accumulation of PhA during this period (Figure 2). This is likely, since hydrolysis of Ins-containing phospholipids is known to lead to increased phytate accumulation in seeds of B. napus[11].
Figure 6 Phytate level in mature seeds of napin-IMT and phaseolin-IMT transgenic lines. Phytate (PhA) was extracted from mature seeds of napin-IMT (N-11) and phaseolin-IMT (Ph1-18, Ph2-15 and Ph3-19) transgenic lines and measured by HPLC. Each data point represents mean value of five biological replicates ±SE (standard error). Statistical significance was evaluated with the unpaired Student T-test (*P<0.05 vs Westar).
Figure 7 Changes in phytate and free phosphate in phaseolin-IMT transgenic lines. Columns are expressed as percentage of reduction in phytate (PhA) (grey column) and increase in free phosphate (Pi) (black column), ±SE (standard error) in phaseolin-IMT
transgenic lines, Ph1-18, Ph2-15 and Ph3-19.
Figure 5 HPLC evidence of ononitol production by the IMT transgene in transgenic lines. (A) Partial trace of mature seed sugar analysis from a representative transgenic line. The peak at 6.75 minutes corresponds to ononitol; (B) quantitative levels of ononitol in mature seeds of different phaseolin-IMT transgenic lines (Ph1-18, Ph2-15 and Ph3-19). (C) IMT enzyme assay of IMT transgenic lines (T) vs. wild-type control (W). Relative peak areas represent the average ±SE (standard error) of three biological replicates.
Typically, the newly forming seed coat is made up of four layers of cells, the outermost epidermal and palisade cell layers (which develop from the outer integument of the ovule) and parenchyma and endothelial cell layers (which are derived from the inner ovule integument) [27]. At 5 DAP the majority of seed inner space is filled with differentiating integument and a small amount of endo-sperm. That the majority of Ins at 15–20 DAP is localized in the seed coat of dissected seeds (Figure 3B) and that the bulk of the seed at 5–15 DAP is primarily made up of this tissue may be construed as evidence that the seed coat is the primary site of Ins biosynthesis in the B. napus seed. In support of this is the abundant supply of sucrose, which is transported through the phloem, apoplastic region and the seed coat during this early stage [28,29] and which, through hydrolysis, acts as source of G-6-P, the precursor for Ins.
As the embryo expands through its initial globular, heart, torpedo and bent cotyledon stages, the endosperm proportionally shrinks (Figure 3C), and Ins becomes localized mainly in the embryo and seed coat (Figure 3B). That the seed coat is the tissue where Ins is most abun-dant at the early stages of seed development is of special importance since it plays a major role in the biosynthesis of mucilage, other seed coat polysaccharides and sugar acids through its participation in the oxidative pathway [30]. PhA synthesis started at very early stages (<10DAP) and reached its maximum levels at about 35 DAP (Figure 2). Distribution analysis of PhA accumulation between cotyledons and embryo axes revealed that from 20 to 75 DAP more than 80% of PhA is accumulated in cotyledons (80% at 20–25 DAP, increasing up to 90% after 30 DAP) (data not shown). At 25–30 DAP, as the Brassica embryo
expanded, higher accumulation of the non-polar de-rivatives (needed for membrane biogenesis) occurred (Figure 1). This period (25–30 DAP) appears to be marked by a slower decline in Ins levels, nearly reaching a plateau (Figure 3A), while, in parallel, PhA levels continued to rise at a relatively slower rate. After 25 DAP and through Ins appears to have reached a stable level in embryo, and more so in seed coat which could account for its apparent slower decline between 25 and 30 DAP (Figure 3B). At this stage the decline in Ins levels was accompanied by a concomitant rise in PhA levels (Figure 2) at the expense of the non-polar components (Figure 1) as the seed approached desiccation through the onset of RFO biosyn-thesis (30-35DAP) (unpublished results).
Since the initial phosphorylation steps of free Ins com-mence either with the reconstitution of L-Ins-1-P or through other positional phosphate esters, our strate-gy was to investigate the effect of competitive metabolic shunt of Ins on its phosphorylation and subsequent PhA and RFO accumulation in canola seeds. To accomplish this, we have explored the conversion of Ins into ononitol (1-D-4-O-methyl-myo-inositol), by methylation at the D-4 position, through the action of the IMT enzyme.
The observed variations in PhA reduction levels do not necessarily reflect different IMT expression levels since all selected lines displayed almost uniform levels of the IMT protein at the time of sampling as shown by Western blot analysis (Figure 4A and 4B). That the recorded ranges of PhA reduction appear to be similar with either promoter (Figure 6) suggests one of two pos-sible scenarios: a) A certain threshold may exist at which a steady balance between supply and removal of Ins is reached, which confines PhA reduction levels within the
Figure 8 Sugar levels in mature seeds of phaseolin-IMT transgenic lines. Sugars were extracted from defatted mature seeds from wild-type Westar (black column) and phaseolin-IMT transgenic lines, Ph1-18 (dark grey), Ph2-15 (white) and Ph3-19 (light grey) and measured by HPLC. Each data point represents mean value of five biological replicates ±SE (standard error). Statistical significance was evaluated with the unpaired Student T-test (*P<0.05 vs Westar). Ins, myo-inositol; Gal, galactose; Gol, Galactinol; Raf, Raffinose; Sta, Stachyose; Suc, Sucrose.
observed limits; b) The temporal appearance of IMT activity under these promoters may not be in synchrony with the highest point of Ins accumulation, which is presumably reached in less than 10 DAP (Figure 3A), leading to the early onset of PhA synthesis. The latter scenario is likely, since the IMT protein was not detected until 25 DAP in lines Ph1-18 and Ph2-15 (Figure 4A) in contrast to PhA accumulation which is shown to be in progress at 15–20 DAP (Figure 2). A similar result was obtained when a MIPS antisense tran-script was expressed in transgenic rice driven by the glutelin GluB-1 promoter [17].
The phaseolin promoter was chosen based on its reported early transcriptional activation in transgenic systems such as tobacco (15–16 DAP) [31,32]. The napin promoter which is native to Brassica was chosen with a view to comparing the effect of temporal expres-sion differences of the two promoters on PhA accumula-tion. However, because IMT transcription from the phaseolin promoter did not commence as early as in the case of transgenic tobacco, it was not possible to assess such differences. The complex architecture of the phaseolin promoter has been shown to play a major role in spatial regulation of this promoter in transgenic sys-tems [33]. Further, seed-specific transcriptional regula-tory regions in the same promoter have been identified which affect its activation in a temporally dependent manner [34,35]. Therefore, it is possible that the pha-seolin promoter, when expressed in different systems, could be affected by elements that may impose temporal expression variations. This is suggested by the fact that, in our hands, the transcriptional activation of phaseolin-IMTwas triggered in canola at a later time point (20 DAP, Figure 4A) than in tobacco, indicating that this promoter could be influenced by developmentally regulated pro-grams in a host-specific manner.
Attempts at enhancing the IMT translation efficiency through the modification of its translational context [36,37] resulted in somewhat improved translation levels at 20 DAP under the phaseolin promoter when a dA cleotide was positioned at the −3 position and a dC nu-cleotide at each of positions −2 and −1 of the initiation codon (transgenic line Ph3-19, Table 1 and Figure 4A). Translation levels at subsequent stages in the same line also appear to have been relatively enhanced. However, in spite of the protein level enrichment at 20 DAP in line Ph3-19, this did not substantially improve the over-all PhA reduction, confirming the need for a more tem-porally and (or) spatially synchronized IMT expression and Ins production, as opposed to early enhancement of IMT translation. Nevertheless, while the apparent com-partmentalization of Ins in the seed coat may shield it from IMT action in the embryo, seed-specific promoters are known to drive gene expression in the inner layer of
seed coats and there is active transport of Ins from seed coat to embryo [38].
In mutant lines of other crops (e.g. maize [13,39] and soy bean [15]), the decrease in PhA phosphorous in ma-ture seeds is generally accompanied by a parallel, albeit variable, increase in Pi [15]. However, in some mutant
lines (e.g. maize lpa2-1), the rise in Pi can be
accom-panied by an accumulation of other Ins phosphates (Ins(1,2,4,5,6)P5; Ins(1,4,5,6)P4; and Ins(1,2,6)P3) [39].
This makes the decrease in PhA futile in such mutants since these highly phosphorylated Ins species retain many of the adverse PhA properties. In the present study, although we observed a similar inverse relation-ship between PhA and Pi, there was no detectable
ac-cumulation of any of the partially phosphorylated Ins intermediates such as InsP3, 4 or 5. Furthermore,
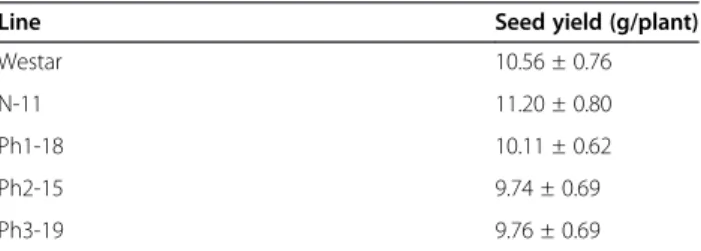
over-expression of IMT did not affect the seed viability or the germination efficiency of transgenic canola seeds. In addition, there were no measurable yield penalties (Table 2).
Absence of ononitol in wild-type HPLC chromato-grams and failure of the wild-type protein extracts to produce ononitol, together with the Western analysis re-sults suggest possible absence of native IMT-like activity in B. napus.
In mature transgenic seeds, the level of Ins was not changed significantly (Figure 8) but presumably during maturation was partitioned among PhA, galactinol and ononitol biosyntheses (Figure 5B). Accordingly, PhA for-mation was decreased in concert with ononitol accumu-lation. This pathway perturbation (Scheme 1) would have lowered the production of galactinol as well, and consequently, RFO accumulation [40] with the notable increase in sucrose levels (Figure 8). Curiously, the de-crease in raffinose levels was accompanied by an almost proportionate rise in stachyose. Since sucrose levels remained high in transgenic seeds, the inverse modu-lation in the levels of raffinose and stachyose could indicate raffinose as a possible galactosyl donor for the subsequent chain elongation in a raffinose:raffinose galactosyltransfer manner, in which a molecule of raffi-nose would release its sucrose moiety after each galactosyl-residue transfer to another raffinose molecule
Table 2 Seed yield of IMT transgenic lines
Line Seed yield (g/plant)
Westar 10.56 ± 0.76
N-11 11.20 ± 0.80
Ph1-18 10.11 ± 0.62
Ph2-15 9.74 ± 0.69
Ph3-19 9.76 ± 0.69
Mature seeds of Westar, napin-IMT (N-11) and phaseolin-IMT (Ph1-18, Ph2-15 and Ph3-19) transgenic lines were harvested and weighed. Each data point represents mean value of five biological replicates ±SE (Standard error).
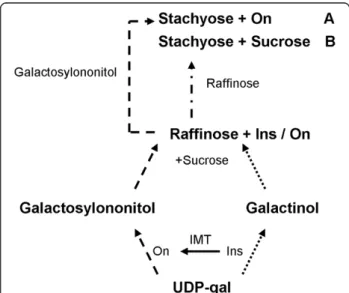
(Figure 9B) [41,42]. This is conceivable in view of the limited availability of galactinol (Figure 8). Alternatively, since methylated derivatives of galactinol are known to take part in RFO synthesis in some plants [43], and although not hitherto proven in B. napus, we propose that ononitol, the methylated product of IMT, may be utilized to form the corresponding galactosylononitol (methylated galactinol), which could still participate, in part, in RFO-chain elongation to the higher oligomer, stachyose (Figure 9A). Since this does not account for the observed increase in sucrose levels, we postulate that both routes may be working concertedly. The differential extent of stachyose and sucrose accumulation (Figure 8) could be indicative of the different kinetics of the two routes (Figure 9A and 9B).
Conclusions
Early stages of Brassica seed development appear to be dominated by reciprocal interconversions of polar Ins phosphates and non-polar species. Although Ins is shown to be produced in significant amounts in the endosperm as well as seed coat during the early stages, no PhA accumulation occurs in those tissues. Instead, PhA accumulation appears to be mainly restricted to the embryo throughout seed development and maturation.
In addition to lowering PhA levels in the developing seeds, the competitive methylation of Ins resulted in
changes in the distribution and accumulation patterns of seed carbohydrates, leading to enhancement of the digest-ible and metabolizable energy profile of the meal as dem-onstrated by the higher content of the nutritionally useful sugar, sucrose. While the ratio of raffinose to stachyose was altered, the overall balance of RFO appears to be unaffected. No deleterious effects were encountered as a result of Ins methylation in developing Brassica seed.
It is evident from this study as well as previous ones that one of the answers to reducing phytate in crop seeds to a level which allows an appreciable beneficial effect on phosphorous and microelements bioavailability without adversely affecting yield and phenotype may be found in a model which combines the additive effects of more than one mechanism acting concertedly with separate independent contributions. Such an approach would allow selective inhibition of Ins phosphorylation at different steps for optimum phytate reduction. None-theless, the current strategy, if adopted, could potentially raise the canola market value as well as that of other crops.
Methods
Plant material and chemicals
Ice plant (Mesembryanthemum crystallinum) seeds were germinated, grown, salt treated and sampled as described previously [20,44]. Seeds of B. napus (Westar) plants, grown under growth chamber conditions (16 hour day at 20°C/8 hour night at 15°C photoperiod) were harvested at maturation. Seeds at different developing stages were also collected. Developing seeds were separated into seed coats and embryos on ice under a binocular dissecting micro-scope. Fresh seeds were cut half open with a scalpel. Endosperm of 15 and 20 DAP was collected by pipette. The seed coat and embryos were washed with ultra pure water three times. The excess water was absorbed with fil-ter paper. The developing seeds and dissected tissue were frozen immediately in liquid N2. These were freeze dried
for 24 hours and then extracted for PhA and Ins analysis. Ononitol standards were purchased from GlycoSyn Technologies, Lower Hutt, New Zealand.
In Vivo labeling of developing seeds with3H-myo-inositol
Siliques at different developmental stages (15–40 DAP) were cut from plants and the cut end immediately put into 10 ml sterile culture medium in 50 ml tubes supplemented with 5μCi 3H-myo-inositol and incubated in a growth chamber for two days. Seeds were harvested and crushed in liquid nitrogen then extracted consecutively with hex-anes (lipid fraction), 0.5N HCl (phytate-containing acid-soluble fraction) and trifluoroacetic acid (TFA-acid-soluble cell debris fraction). The radioactivity in each fraction was assessed in a scintillation counter.
Figure 9 Hypothetical model for the possible involvement of ononitol in the accumulation of stachyose and sucrose in IMT transgenic canola. (A) Hypothetical production of stachyose and ononitol via galactosylononitol in B. napus; (B) Hypothetical production of stachyose and sucrose via raffinose:raffinose galactosyltransferase in B. napus. Dotted arrows indicate reduced biosynthesis. Dashed arrows indicate possible alternate routes. Dash-dotted arrows indicate probable direct galactosyl-residue transfer from raffinose. On, ononitol; Ins, myo-inositol; IMT, myo-inositol methyltransferase; UDP-gal, uridine diphosphate galactose.
Phytic acid extraction
Mature canola seeds (350 mg) were homogenized in 4 ml of ammonia in methanol (10% w/w) [45], then vortexed. After a 10-minute incubation, 3 ml of hexanes was ad-ded and the samples were vortexed and centrifuged (RCF 2500). The liquid phases were discarded and the seed pellets re-extracted with 3 ml of hexanes, centrifuged and the supernatants discarded. Pellets were washed three times with 5 ml of absolute methanol, resuspended in 6 ml of 0.5 N HCl and kept at room temperature for 15 minutes. The slurry was centrifuged and the supernatant was filtered through a 0.45 μm GHP Acrodisk filter (Gelman Science) prior to HPLC analysis. At this stage samples were stored at −20°C. PhA was extracted from 50-100 mg of seeds at different developmental stages. For dissected material, seed coat (20 mg), endosperm (20 mg), embryo: 15 DAP (10 mg), 20 DAP (50 mg) and older (100 mg) was used. The extraction volume of HCl was adjusted proportionately.
HPLC conditions for phytic acid analysis
Phytic acid analysis was performed on a Waters 660E multi-solvent delivery system equipped with in-line degasser AF, 717plus Autosampler and a Sedex 55 (S.E. D.E.R.E.) evaporative light scattering detector at 50°C, 2 bar, gain 7. The HPLC system was controlled and data processed by the Waters Millennium™ 2010 Chro-matography Manager, version 2.15.01. Samples were chromatographed on an IC-Pak Anion HC, 150 mm × 4.6 mm column (WAT026770, Waters), at 22°C, with 100 mM nitric acid at a flow rate of 1.0 ml/min. A Wa-ters IC-Pak Anion Guard-Pak (WAT010551) was used as the pre-column. A fritted filter guard (A-103X Rep Frit (BLK) 0.94 × 0.25 from Upchurch Scientific) was placed in front of the pre-column. Injections, typically 75 μl of undiluted sample, were in duplicate with a separ-ate result genersepar-ated for each injection. A calibration curve was prepared for each run with the levels of standards at 25, 50, 75 and 100 μg. Standards were prepared with phytic acid dodecasodium salt C6H6O24P6Na12·9H2O
(Sigma), which was dissolved in the same concentration HCl as that used to extract the samples (0.5 N) to a con-centration of 10 μg/μl. The concentrated solution was di-luted to 1.0 μg/μl in 0.5 N HCl. Volumes of 25, 50, 75 and 100 μl of the diluted standard were injected in duplicate and phytic acid was detected at an average retention time of 3.9 minutes.
HPLC conditions for carbohydrate analysis
Sugars were extracted from seeds, and analyzed by HPLC as described [40]. Briefly, duplicates of defatted tissue of ten seeds, unless otherwise indicated, were extracted with 80:20 v/v ethanol-water at 70°C for 30 min, followed by centrifugation and evaporation of the
supernatant to dryness. Samples were reconstituted in 18-MΩwater, and filtered through 0.45 μm nylon filters prior to HPLC analysis. To accommodate analysis of early seed stages, extraction and reconstitution volumes were proportional to sample weight.
Galactinol, myo-inositol and D-ononitol were separated on a CarboPac™ MA1 column (4 mm × 250 mm) preceded by a CarboPac™ MA1 guard column (4 mm × 50 mm) with 500 mmol L-1isocratic NaOH at 0.40 mL min-1 as eluent and detected by high performance anion exchange-pulsed amperometric detection (HPAE-PAD) using a Dionex ICS-3000 system (Dionex Corp., Sunnyvale, Calif.). Standards were galactinol, myo-inositol (Sigma-Aldrich, St. Louis, MO) and D-ononitol (GlycoSyn Tech-nologies, Lower Hutt, New Zealand).
Glucose, galactose, fructose, sucrose, stachyose and raf-finose were separated on a CarboPac™ PA1 column (2 mm × 250 mm) preceded by a CarboPac™ PA1 guard column (2 mm × 50 mm) and then an Amino-Trap™ guard column (2 mm × 50 mm) with 25 mmol L-1 isocratic NaOH at 0.25 mL min-1 as eluent and detected by HPAE-PAD. Standards were galactose, fructose, suc-rose, raffinose, stachyose (Sigma-Aldrich, St. Louis, MO), and glucose (Fisher Scientific, Hampton, NH).
Inorganic phosphate analysis
Inorganic phosphate (Pi) in mature transgenic seeds was
assayed using published protocols [46].
Cloning of IMT and plant transformation
Fresh salt-stressed ice plant leaf tissue was frozen in liquid nitrogen and crushed to fine powder. Total RNA was extracted with TRIzol® Reagent (Invitrogen). Poly (A)+ RNA was isolated using published methods [47]. The first strand cDNA was generated using the Roche reverse tran-scription kit, and amplified with the sequence specific primers (forward, 5’-TTTTTGGATCCAAGAGAA AAA AAAATGACTACTTACACC-3' and reverse, 5’-TTTTTG CGGCCGCATAAAGGCAAATCATACACTG-3’) by PCR based on the published sequence (Accession No. M87340). The reaction was initiated by heating at 94°C for 2 min followed by 35 cycles of heating at 94°C for 1 min, annealing at 52°C for 1 min and extension for 3 min at 72°C. The PCR product (1418bp) was purified using a PCR purification kit (Promega) followed by digestion with BamHI and NotI, whose sites were incorporated into the forward and reverse primers, respectively. The digested DNA fragment was subcloned into pSPORT1 (Invitrogen) and sequenced. The IMT gene was subcloned into pRD400 [48], which contains a napin promoter to produce plasmid pNIMT. Additional versions of the IMT gene, with modified translational context were produced
[36,37] (Table 1). These as well as the parent-transgene were cloned into pRD 400 under the phaseolin promoter to generate pPhIMT1-3. All constructs were transferred into Agrobacterium tumefaciens strain GV3101 containing the helper plasmid pMP90 by triparental mating, followed by Agrobacterium-mediated transformation of Brassica napus(cv. Westar) [49].
Over-expression of IMT in E coli and production of antibodies
The IMT cDNA fragment was cloned into the bacterial expression plasmid, pPROEXHTb (Invitrogen). Protein expression was induced by adding IPTG to the culture medium to a final concentration of 1 mM. The E. coli culture was harvested after a 3-hour incubation at 37°C. The His-tagged protein was purified with Ni-NTA Agar-ose (Qiagen) under denaturing conditions. The purified protein (43 Kda) was used to raise polyclonal antibodies against the IMT enzyme [50], which were subsequently used in Western analyses of transgenic lines.
Southern and Northern blot analyses
Genomic DNA was extracted from leaf tissue using Wizard® Genomic DNA Purification Kit (Promega). RNA extraction from developing seeds of both transgenic and wild-type plants was conducted by using RNeasy plant total RNA kit (Qiagen). Southern and Northern analyses using Hybond-N+membrane (Amersham) were performed essentially as described [51].
IMT Enzyme assay and Western analysis in transgenic plants
Total protein extracts from developing seeds (approxi-mately 40 DAP) as well as leaves of transgenic lines, and wild-type plants were assayed for IMT-enzyme activity exactly as described previously [20].
For Western analysis, total soluble proteins were extracted from developing seeds as described [44]. TND buffer, 90 mM Tris–HCl (pH 8.3 at 4°C), 9mM DTT and 2 mM Leupeptin (100 μl) was added to 50 mg of frozen seeds crushed in liquid nitrogen. Soluble protein samples were prepared by collecting the supernatants. Protein concentration in each sample was determined using the Bradford assay with BSA as the standard. Protein sam-ples (15 μg each) were used in Western blot analysis. The samples were separated by PAGE and blotted on a Nitrocellulose membrane (Bio-Rad) [51]. The immune-reactions were conducted using Bio-Rad Immun-BlotW
Assay Kit.
Abbreviations
DAP:Days after pollination; Ptd-CMP: Phosphatidylcytosine monophosphate; PtdIns: Phosphatidylinositol; PI-K: Phosphatidylinositol kinase;
PtdInsP: Phosphatidylinositol monophosphate; GolS: Galactinol synthase; RFO: Raffinose oligosaccharides.
Competing interests
The authors declare that they have no competing interests. Authors’ contribution
FG, project PI, designed the concept, supervised all the experiments, contributed to and edited the manuscript. JD, WY, CB, KN performed the experiments and participated in the interpretation of results. WK supervised Brassica transformation experiments. All authors read and approved the final manuscript.
Acknowledgements
This study was supported through an NRCC-DASCI Strategic Alliance Agreement. Ice plant seeds were a gift from Professor Hans Bohnert. The phaseolin promoter was provided by Dow AgroSciences as pAGM219 plasmid. The contributions of Atta Hussain, supported by grants from the Canola Council of Canada and Dow AgroSciences, are hereby acknowledged. We also thank Sandra Polvi for technical support. This is NRCC publication number 54672.
Author details
1Wilmar International, 56 Neil Rd, Singapore 088830, Singapore.2National Research Council Canada, Plant Biotechnology Institute, 110 Gymnasium Place, Saskatoon, SK S7N 0W9, Canada.3Ag-West Bio Inc, 101 – 111 Research Drive, Saskatoon, SK S7N 3R2, Canada.
Received: 14 December 2012 Accepted: 9 May 2013 Published: 21 May 2013
References
1. Luley-Goedl C, Nidetzky B: Glycosides as compatible solutes: biosynthesis and applications. Nat Prod Rep 2011, 28:875–896.
2. Vucenik I, Shamsuddin AM: Protection against cancer by dietary IP6 and inositol. Nutr Canc 2006, 55:109–125.
3. Shamsuddin AM, Vucenik I, Cole KE: IP6: a novel anti-cancer agent. Life Sci 1997, 61:343–354.
4. Murphy AM, Brearley OB CA, Carr JP, Hanke DE: A role for inositol hexakisphosphate in the maintenance of basal resistance to plant pathogens. Plant J 2008, 56:638–652.
5. Schröterová L, Hasková P, Rudolf E, Cervinka M: Effect of phytic acid and inositol on the proliferation and apoptosis of cells derived from colorectal carcinoma. Oncol Rep 2010, 23:787–793.
6. Verghese M, Rao DR, Chawan CB, Walker LT, Shackelford L: Anticarcinogenic effect of phytic acid (IP6): Apoptosis as a possible mechanism of action. LWT 2006, 39:1093–1098.
7. Xu Q, Kanthasamy AG, Reddy MB: Neuroprotective effect of the natural iron chelator, phytic acid in a cell culture model of Parkinson's disease. Toxicology 2008, 245:101–108.
8. Macbeth MR, Schubert HL, VanDemark AP, Lingam AT, Hill CP, Bass BL: Inositol hexakisphosphate is bound in the ADAR2 core and required for RNA editing. Science 2005, 309:1534–1539.
9. Graf E, Eaton JW: Antioxidant functions of phytic acid. Free Radic Biol Med 1990, 8:61–69.
10. Doria E, Galleschi L, Galucci L, Pinzino C, Pilu R, Cassani E, Nielsen E: Phytic acid prevents oxidative stress in seeds: evidence from a maize (Zea mays L.) low phytic acid mutant. J Exp Bot 2009, 60:967–978.
11. Georges F, Das S, Ray H, Bock C, Nokhrina K, Kolla VA, Keller K: Over-Expression of Brassica napus Phosphatidylinositol-Phospholipase C2 (BnPtdIns-PLC2) in Canola Induces Significant Changes in Gene Expression and Phytohormone Distribution Patterns, Enhances Drought Tolerance and Promotes Early Flowering and maturation. Plant Cell Environ 2009, 32:1664–1681.
12. Suzuki M, Tanaka K, Kuwano M, Yoshida KT: Expression pattern of inositol phosphate-related enzymes in rice (Oryza sativa L.): implications for the phytic acid biosynthetic pathway. Gene 2007, 405:55–64.
13. Pilu R, Panzeri D, Gavazzi G, Rasmussen SK, Consonni G, Nielsen E: Phenotypic, genetic and molecular characterization of a maize low phytic acid mutant (lpa241). Theor Appl Genet 2003, 107:980–987. 14. Panzeri D, Cassani E, Doria E, Tagliabue G, Forti L, Campion B, Bollini R,
Brearley CA, Pilu R, Nielsen E, Sparvoli F: A defective ABC transporter of the MRP family, responsible for the bean lpa1 mutation, affects the
regulation of the phytic acid pathway, reduces seed myo-inositol and alters ABA sensitivity. New Phytol 2011, 191:70–83.
15. Wilcox J, Premachandra G, Yound K, Raboy V: Isolation of high seed inorganic P, low-phytate soybean mutants. Crop Sci 2000, 40:1601–1605. 16. Kuwano M, Ohyama A, Tanaka Y, Mimura T, Takaiwa F, Yoshida KT:
Molecular breeding for transgenic rice with low-phytic-acid phenotype through manipulating myo-inositol 3-phosphate synthase gene. Mol Breed 2006, 18:263–272.
17. Kuwano M, Takaiwa F, Yoshida KT: Differential effects of a transgene to confer low phytic acid in caryopses located at different positions in rice panicles. Plant Cell Physiol 2009, 50:1387–1392.
18. Nunes ACS, Vianna GR, Cuneo F, Guy de Capdeville JA-F, Rech EL, Aragão FJL: RNAi-mediated silencing of the L-myo-inositol-1-phosphate synthase gene (GmMIPS1) in transgenic soybean inhibited seed development and reduced phytate content. Planta 2006, 224:125–132.
19. Georges F, Hussain AAK, Keller WA: Method for reducing phytate in canola meal using genetic manipulation involving myo-inositol 1-phosphate synthase gene. Patent 2006. WO 00/73473 A1.
20. Vernon DM, Bohnert HJ: A novel methyl transferase induced by osmotic stress in the facultative halophyte Mesembryanthemum crystallinum. EMBO J 1992, 11:2077–2085.
21. Keller WA, Datla R, Dong J-Z, Georges F, Hussain AAK, Selvaraj G: Methods and compositions for modifying levels of secondary metabolic compounds in plants. Patent 2007. US7279619.
22. Vernon DM, Tarczynski MC, Jensen RG, Bohnert HJ: Cyclitol production in transgenic tobacco. Plant J 1993, 4:199–205.
23. Sheveleva E, Chmara W, Bohnert HJ, Jensen RC: lncreased Salt and Drought Tolerance by D-Ononitol Production in Transgenic Nicotiana tabacum L. Plant Physiol 1997, 115:1211–1219.
24. Chiera JM, Streeter JG, Finer JJ: Ononitol and pinitol production in transgenic soybean containing the inositol methyl transferase gene from Mesembryanthemum crystallinum. Plant Sci 2006, 171:647–654. 25. Patra B, Ray S, Richter A, Majumder AL: Enhanced salt tolerance of
transgenic tobacco plants by co-expression of PcINO1 and McIMT1 is accompanied by increased level of myo-inositol and methylated inositol. Protoplasma 2010, 245:143–152.
26. Paulick MG, Bertozzi CR: The glycosylphosphatidylinositol anchor: A complex membrane-anchoring structure for proteins. Biochemistry 2008, 47:6991–7000.
27. Moise JA, Han S, Gudynait-Savitch L, Johnson DA, Miki BLA: Seed coats: Structure, development, composition and biotechnology. In Vitro Cell Dev Biol Plant 2005, 41:620–644.
28. Coelho CMM, Benedito VA: Seed development and reserve compound accumulation in common bean (Phaseolus vulgaris L.). Seed Sci Biotechnol 2008, 2:42–52.
29. Morley-Smith ER, Pike MJ, Findlay K, Köckenberger W, Hill LM, Smith AM, Rawsthorne S: The transport of sugars to developing embryos is not via the bulk endosperm in oilseed rape seeds. Plant Physiol 2008, 147:2121–2130. 30. Loewus FA, Kelly S, Neufeld EF: Metabolism of myo-inositol in plants:
Conversion to pectin, hemicellulose, D-xylose, and sugar acids. Biochemistry 1962, 48:421–425.
31. Altenbach SB, Pearson KW, Meeker G, Staraci LC, Sun SM: Enhancement of the methionine content of seed proteins by the expression of a chimeric gene encoding a methionine-rich protein in transgenic plants. Plant Mol Biol 1989, 13:513–522.
32. Sengupta-Gopalan C, Reichert NA, Barker RF, Hall TC, Kemp JD:
Developmentally regulated expression of the bean β-phaseolin gene in tobacco seed. Proc Natl Acad Sci USA 1985, 82:3320–3324.
33. Chandrasekharan MB, Bishop KJ, Hall TC: Module-specific regulation of the b-phaseolin promoter during embryogenesis. Plant J 2003, 33:853–866. 34. Burow MD, Sen P, Chlant CA, Murai N: Developmental control of the
β-phaseolin gene requires positive, negative, and temporal seed-specific transcriptional regulatory elements and a negative element for stem and root expression. Plant J 1992, 2:537–548.
35. Kawagoe Y, Murai N: Four distinct nuclear proteins recognize in vitro the proximal promoter of the bean seed storage protein beta-phaseolin gene conferring spatial and temporal control. Plant J 1992, 2:927–936. 36. Kozak M: At least six nucleotides preceding the AUG initiator codon
enhance translation in mammalian cells. Mol Biol 1987, 196:947–950.
37. Rangan L, Vogel C, Srivastava A: Analysis of Context Sequence
Surrounding Translation Initiation Site from Complete Genome of Model Plants. Mol Biotechnol 2008, 39:207–213.
38. Stalberg K, Ellerstrom M, Josefsson LG, Rask L: Deletion analysis of a 2S seed storage protein promoter of Brassica napus in transgenic tobacco. Plant Mol Biol 1993, 23:671–683.
39. Raboy V, Gerbasi PF, Young KA, Stoneberg SD, Pickett SG, Bauman AT, Murthy PP, Sheridan WF, Ertl DS: Origin and seed phenotype of maize low phytic acid 1–1 and low phytic acid 2–1. Plant Physiol 2000, 124:355–368. 40. Bock C, Ray H, Georges F: Down-regulation of galactinol synthesis in
oilseed Brassica napus leads to significant reduction of antinutritional oligosaccharides. Botany 2009, 87:597–603.
41. Hopf H, Gruber G, Zinn A, Kandler O: Physiology and biosynthesis of lychnose in Cerastium arvense. Planta 1984, 162:283–288.
42. Vanhaecke M, Dyubankova N, Lescrinier E, Van den Ende W: Metabolism of galactosyl-oligosaccharides in Stellaria media – Discovery of stellariose synthase, a novel type of galactosyltransferase. Phytochemistry 2010, 71:1095–1103.
43. Peterbauer T, Richter A: Galactosylononitol and Stachyose Synthesis in Seeds of Adzuki Bean. Plant Physiol 1998, 117:165–172.
44. Ostrem JA, Olsen SW, Scmitt JM, Bohnert HJ: Salt stress increases the level of translatable mRNA for phosphoenolpyruvate carboxylase in Mesembryanthemum crystallinum. Plant Physiol 1987, 84:1270–1275. 45. Naczk M, Wanasundara PKJP, Shahidi F: Facile spectrotophotometric
quantification method of sinapic acid in hexane-extracted and methanolammonia-water treated mustard and rapeseed meals. J Agric Food Chem 1992, 40:444–448.
46. Shi J, Wang H, Wu Y, Hazebroek J, Meeley RB, Ertl DS: The maize low-phytic acid mutant lpa2 is caused by mutation in an inositol phosphate kinase gene. Plant Physiol 2003, 131(2):507–515. Feb.
47. Aviv H, Leder P: Purification of biologically active globin messenger RNA by chromatography on oligothymidylic acid-cellulose. Proc Natl Acad Sci USA 1972, 69:1408–1412.
48. Datla RSS, Hammerlindl JK, Panchuk B, Pelcher LE, Keller W: Modified binary plant transformation vectors with the wild-type gene encoding NPTII Gene. Gene 1992, 211:383–384.
49. Moloney MM, Walker JM, Sharma KK: High efficiency transformation of Brassica napus using Agrobacterium vectors. Plant Cell Rep 1989, 8:238–242. 50. Nelson DE, Rammesmayer G, Bohnert HJ: Regulation of Cell-Specific
Inositol Metabolism and Transport in Plant Salinity Tolerance. Plant Cell 1998, 10:753–764.
51. Sambrook J, Fritsch EF, Maniatis T: Molecular cloning, a laboratory manual, 3rd ED. Cold Spring Harbor Laboratory Press 1989, 1:6.39–7.50.
doi:10.1186/1471-2229-13-84
Cite this article as: Dong et al.: Perturbing the metabolic dynamics of myo-inositol in developing Brassica napus seeds through in vivo methylation impacts its utilization as phytate precursor and affects downstream metabolic pathways. BMC Plant Biology 2013 13:84.
Submit your next manuscript to BioMed Central and take full advantage of:
• Convenient online submission
• Thorough peer review
• No space constraints or color figure charges
• Immediate publication on acceptance
• Inclusion in PubMed, CAS, Scopus and Google Scholar
• Research which is freely available for redistribution
Submit your manuscript at www.biomedcentral.com/submit