HAL Id: hal-02352365
https://hal.archives-ouvertes.fr/hal-02352365
Submitted on 6 Nov 2019HAL is a multi-disciplinary open access archive for the deposit and dissemination of sci-entific research documents, whether they are pub-lished or not. The documents may come from teaching and research institutions in France or abroad, or from public or private research centers.
L’archive ouverte pluridisciplinaire HAL, est destinée au dépôt et à la diffusion de documents scientifiques de niveau recherche, publiés ou non, émanant des établissements d’enseignement et de recherche français ou étrangers, des laboratoires publics ou privés.
Extremely straightforward room temperature
co-precipitation method to synthesize cubic
KYF4:Yb/Er up-conversion nanoparticles in deionized
water-ethanol solution
Zhenyu Yang, Patrick Gredin, Michel Mortier
To cite this version:
Zhenyu Yang, Patrick Gredin, Michel Mortier. Extremely straightforward room temperature co-precipitation method to synthesize cubic KYF4:Yb/Er up-conversion nanoparticles in deionized water-ethanol solution. Optical Materials, Elsevier, 2019, pp.109458. �10.1016/j.optmat.2019.109458�. �hal-02352365�
Extremely straightforward room temperature co-precipitation method to synthesize cubic KYF4:Yb/Er up-conversion nanoparticles in deionized water-ethanol solution
Zhenyu Yang, Patrick Gredin and Michel Mortier*
Institut de Recherche de Chimie Paris, Chimie ParisTech - CNRS, PSL research University, Paris 75005, France
E-mail: michel.mortier@chimie-paristech.fr
Keywords: up-conversion nanoparticles, Yb/Er doping KYF4, co-precipitation method
Abstract:
Through extremely facile RT(room temperature) co-precipitation method in mixed deionized water and ethanol solution, cubic KYF4:10%Yb/5%Er up-conversion nanoparticles with
excellent emission intensity and desirable fluorescence lifetime after annealing under 974 nm pulsed laser excitation have been successfully synthesized. The X-ray powder diffraction pattern has been refined by profile fit in order to obtain accurate lattice parameters. The mean crystallite size and microstrain have been calculated by Williamson-Hall method. Joint effect of crystallite size and microstrain on photoluminescence properties have been studied based on the obtained samples. Green-to-red ratios of the emission spectra and slopes of the emission intensity versus excitation laser power have been investigated. The fluorescence lifetimes of the present samples have also been reported. The extraordinarily facile synthesis route, in environment-friendly solvents, provides a novel proposal to remove some of the obstacles that hinder the up-conversion nanoparticles development.
1. Introduction
Anti-Stokes or up-conversion (UC) emissions process, which was knownsince 1960s,1 simply states as emission photons are at higher energy than the excited ones.It started from an idea that infrared (IR) photons could be detected and counted through sequential absorption within the given ion energy levels by Bloembergen in 1959.1 The initial idea was a short proposal for
an infrared quantum counter (IRQC) detector. Unfortunately, it was difficult to realize sequential photons absorption within the same single doping ion during the limited lifetime of first excited state.2 In 1966, Auzel found that the luminescence intensity of Er3+, Ho3+ and Tm3+ ions was almost enhanced by two orders of magnitude when doping Yb3+ into the host material under near-infrared light excitation.1,3 Then, Auzel proposed that the energy transfer could realize between two ions and made the role of energy transfer recognized. And in 1973,4 he presented the principles and application of up-conversion independently. To be specific, up-conversion stands for the procedure that the doping Ln3+ ions absorb two or more sequential lower-energy photons and transfer the energy from sensitizer (e.g. Yb3+) to activators (e. g. Er3+, Ho3+, and Tm3+) to reach higher excited state and then radiate to ground state, generating higher-energy light.
With further research, many advantages of UC nanomaterials have been presented, such as low autofluorescence background, the absence of blinking and photobleaching, superior photostability, tunable and sharp-band emission, long lifetimes, large anti-Stokes shifts and so on. 5-10 As a result, it was studied by many researchers. Among the multitude of reported host materials, especially the fluoride nanoparticles get much attention mainly for their low lattice phonon energy which can reduce thermal lensing effects under strong pumping conditions to reduce non-radiative losses and therefore enhance luminescence efficiency.11 Combining with its high chemical and thermal stability and narrow emission lines makes it particularly suitable for IR conversion. Rare earth doped fluoride up-conversion nanoparticles have a potential application in a wide range of fields:8,12 solid-state lasing, optical data storage, display, photovoltaics and biological imaging.
Up to now, the NaREF4 type fluoride nanoparticle has been investigated by many researchers
and hexagonal NaYF4 is found to be the most efficient UC nanoparticles among them.12,13 The
proved to be a good host material.14-17 It has long fluorescence lifetime due to the relative weak oscillatory strength and KYF4 structure is very accommodative to all sizes of rare earth
ions.11,14,16,18,19 But the researches about KYF4 up-conversion nanoparticles are scarce.11,20-23
Apart from concerning the kinds of different host materials, we cannot ignore the current cumbersome synthesis methods including hydrothermal/solvothermal method and thermal decomposition that need high reaction temperature and long reaction time. Although they were widely used, they have many disadvantages such as hazardous coordinating solvents, toxic organometallic reagents and stringent reaction condition which come with high costs, low yield, low repeatability and a risk of security.9 Almost all of the reports about up-conversion nanoparticles applied complicated organic reagent and reacted at high temperature.
6,7,10,12,20-24
Moreover, the cumbersome and stringent synthesis approaches may limit their industrial batch production and further application. Meanwhile, the synthesis methods under high temperatures bring the evaporation of components which may avoid controlling the exact chemical composition of the materials.11
In contrast to these routinely routes at high temperature to prepare up-conversion nanoparticles with long reaction time, co-precipitation approach at room temperature has advantages of low energy costs, short preparing time, more safety, and high yield and repeatability. Compared with frequently used complicated organic solvents, the deionized water and ethanol are cheap, accessible, and environment-friendly without poison or potential pitfall. Meanwhile, high-frequency modes of ligands onto the nanocrystal surface (e.g. OH– and CH– groups) could activate many non-radiative channels to decrease the UC efficiency.25 The employ of deionized water-ethanol solvent will decrease the probability of introducing numerous ligands from the commonly used complicated organic solvent. The OH-groups from reagents could be removed by annealing treatment. In this work, an ultra-facile and fast co-precipitation method was adopted to synthesize KYF4:10%Yb/5%Er UC nanoparticles at
RT. The successfully as-prepared nanoparticles have an excellent luminescent intensity and desirable fluorescence lifetime under 974 nm laser excitation. Especially, the present work enriches the researches of lifetime that are scarce in KYF4:Yb/Er UCNs. The as-prepared
nanoparticles with small size are particularly suitable for biological imaging,11,21,26 in addition with the security from preparing in deionized water-ethanol solvents. Rather long lifetime of excited states, high chemical, and thermal stability make it possible to be used into solar cells.
2. Results and discussion
2.1 Structure and morphologies
Table 1 shows the details of the prepared samples marked with A1, A2, A3, B1, B2, and B3
under different initial K/Y/F ratios and reacting solvents. Figure 1 shows X-ray powder diffraction patterns of the prepared nanoparticles and literature cubic KErF4 (space group
Fm-3m, PDF 00-065-0575) for comparison. Indeed, XRD patterns of KYF4:10%Yb/5%Er
showed in Figure 1 does not fit with the XRD patterns of hexagonal and tetragonal KYF4
compounds recorded in the databases while they are in good accordance with this of cubic KErF4. This result is in agreement with previous works. For example, Schafer et al.20 firstly
reported in 2008, cubic KYF4:Yb/Er nanoparticles with a mean size of 13 nm that were
synthesized in the high boiling organic solvent N-(2-hydroxyethyl) ethylenediamine (HEEDA) at 200°C. They used cubic α-NaYF4 as a structural model and explained that the two patterns
had similar diffraction intensity and all peaks of the α-NaYF4 shifted towards high angle
compared with their samples.20 Later, several articles reported cubic KYF4 UC nanocrystal
including KYF4:Nd3+ by microwave-hydrothermal crystallization,21 KYF4:Eu3+ by
hydrothermal method 22 and KYF4:Eu3+ by modified thermal decomposition method.23
Thus, it was demonstrated that pure cubic KYF4 nanoparticles were synthesized from
which is an extremely facile and fast method compared with other ones.20-23 To our knowledge, it is the first time at RT to prepare Yb/Er doping KYF4 UCNs in water-ethanol
medium.
However, some very weak diffraction peaks are found and marked with asterisk in the XRD patterns of KYF4:10%Yb/5%Er prepared only in deionized water (A1, A2, and A3). In
previous works,20,21 similar weak diffraction peaks are observed in the XRD patterns of KYF4
compounds but the phases due to these peaks are not discussed and identified. After a careful analysis of the positions and intensities of these diffraction lines, it appears that these ones may belong to another potassium yttrium fluoride compounds cubic KY3F10
(PDF-01-084-5197).
In conclusion, the use of the mixed ethanol-water medium for syntheses of KYF4 compounds
at RT is strongly determined by the systematic presence of impurities in the samples synthesized in deionized water only, while they are absent in the ones synthesized in a mixed water-ethanol medium.
However, in the following experiments we found that the impure peaks disappear if we increase the quantity of potassium in the K/Y ratio (from 2/1 to 3/1) in the samples those were prepared only in deionized water. The result is shown in Figure 2. So, this result indicates clearly that it is necessary to work in a large excess of potassium when only deionized water is used. Otherwise, the large F/K ratio is also necessary. Especially in K/Y/F = 3/1/3 XRD pattern, the situation is worse compared with K/Y/F =3/1/7. So, the peaks are owing to low amounts of initial adding K and F that are not sufficient to form pure cubic KYF4. Apart from
increasing the amounts of K+ and especial F-, the previous statements about employ of mixed water-ethanol medium instead of using only water medium change the reaction equilibrium constants and can promote the expected reaction to also obtain pure cubic KYF4 phase.
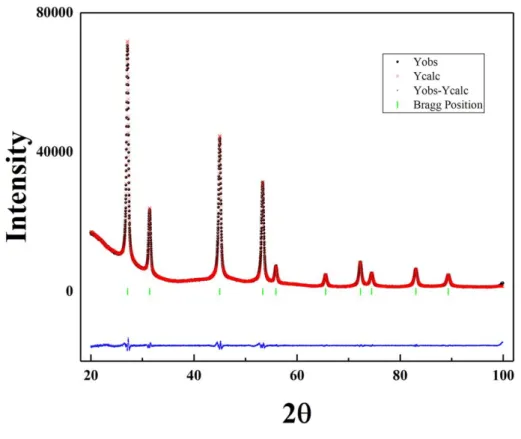
Figure 3 exhibits the XRD Rietveld refinement of the sample B3 recorded with a slow
scanning speed. The calculated profile fits well with the observed XRD pattern. Cubic KYF4
crystallizes in a fluorite-like crystal structure in which cations sites are statically occupied by Y3+, Yb3+, and Er3+ cations. The refined lattice parameter of the cubic unit cell is a = 5.6926 Å. It has a larger lattice parameter than KErF4 whose is 5.6862 Å.27 This fact is also an evidence
that Y ions have been actually introduced into the crystal lattice successfully. The Shannon ionic radius of Y3+, Yb3+, and Er3+ with Ⅷ coordination number is 1.159 Å, 1.125 Å, and 1.144 Å, respectively.28,29 The Y3+ has a bigger Shannon ionic radius than Er3+ that is a reason why KYF4:10% Yb/5% Er nanoparticles has a larger lattice parameter than KErF4.
Williamson-Hall method was adopted to calculate the average crystallite size.30 Based on the XRD data, crystallite size were obtained from full-widths at half-maximum (FWHM) of the peaks (111), (200), (220), (311), (222), (400), (331), (420), and (422) for the samples. The Bragg peak breadth Bmeasurement is the squares sum of sample Bsample and instrumental
contributions Binstrument:
(1)
Standard LaB6 was used to determine the instrumental broadening Binstrument allowing
calculating Bsample using Equation (1).
Actually, microstrains are very common in nanoparticle materials and therefore the peak broadening Bsample is due to both microstrains, Bmicrostrains = 4sin()/cos(), and crystallite size,
Bsize = Kλ/Dcos() (Scherrer Formula). The Equation (2) is given as follow:
Where is the diffraction angle and is Scherrer constant, is the microstrain coefficient, λ is X-ray wavelength (λ = 0.15046 nm) and D is crystallite size. The Scherrer constant K depends on the crystal shape, size distribution and particularly of the method used to estimate the broadening of the peaks. For spherical particles, a cubic symmetry and a full width at half maximum method to estimate the broadening, is taken as 0.94.31 Where, is the microstrain coefficient, which is mainly caused by no-uniform lattice distortions, dislocations, antiphase domain boundaries, grain surface relaxation and so on.
Rearranging Equation (2) gives:
(3)
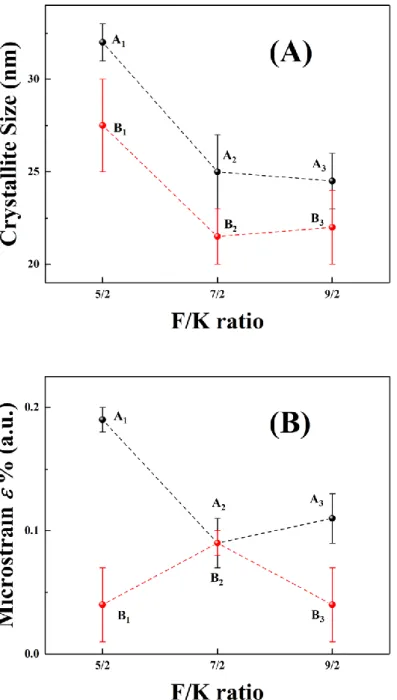
Then Bsamplecos() was plotted as function of 4sin(). The slope and y-intercept of the linear regression lines stand for strain effect and size effect, respectively. Figure 4 shows the linear regression line of sample A1 according to Equation (3) while Figure 5 (A) and (B) gives a
schematic representation of the calculated crystallite size D and microstrain coefficient of A1, A2, A3, B1, B2,and B3, respectively. Table 2 gathered the values of the caclulated mean
crystalite sizes D and microstrain of all the samples..
The calculated values of all the samples in present work are less than 0.19 %, which seemingly means that the crystal imperfections and distortions inside the nanocrystals are very low. Actually, when the crystallite size is small, the maximum quantifiable microstrain will be limited. So, for the small size samples in this work, the calculated values of are not accurate but the comparison of between different samples in this work can be proceed in some degree. The comparison of values between A and B series samples suggests that B samples have lower values. The calculated crystalline sizes of all the samples are given in
Table 2. The sample A1 has the biggest calculated crystallite size ranged 31-33 nm while the
sample B2 has the smallest size 20-23 nm.
Figure 6 shows the transmission electron microscope (TEM) images of the prepared nanoparticles. The particle size of A1 varying from 60 nm to 100 nm is much larger than the
calculated 31-33 nm crystalline size indicating that A1 particles are, in fact, aggregates of
nanocrystals. The picture of (A1) and (B2) in Figure 6 show several sets of parallel lattice
fringes and the observed 0.33 nm d-spacing is in good agreement with cubic (111) lattice plane of KYF4.23 Except for the nanoparticles of A1 sample, the particle sizes of rest samples
are in good accordance with the calculated crystallite size (Figure 5) and each particle corresponds to only one single nanocrystal. Though morphology is difficult to control under co-precipitation method, B series samples show well dispersed nanoparticles with a homogeneous morphology. The uniformity and sphere morphology are favourable for the photoluminescence properties. The as-prepared nanoparticles, with small size between 20-33 nm diameter, is in favour of energy transfer (ET) process.1126 The small nanoparticles, less than 50 nm diameter, are suitable for biological imaging owing to the reason that they have high cellular uptake and desirable clearance rate.21 In addition, the deionized water-ethanol reaction solvent avoids the complicated organic solvent residual that make the nanoparticles safe to be used in vivo biological cells. Meanwhile, the KYF4:Yb/Er UCNs are safe and
nontoxic.
2.2 Photoluminescence properties
As we know, apart from the phonon energy of the host lattices and the concentration of doped Ln3+, the photoluminescence properties of up-conversion nanoparticles are sensitive to the nature of the crystalline phase, crystallinity, particles size, morphology of the particles and
defects. The analyses and discussion in 3.1 about the above factors all serve the fluorescence properties.
Figure 7 shows photographs of B1 sample (annealing treatment at 400 ℃ for 4 h with Argon
flow) under excitation of a 974 nm pulsed laser. Figure 7 (A) and Figure 7 (B) illustrates visible and strong green emission in a darkroom from powder of nanoparticles and 0.05 g/L colloidal solution in ethylene glycol, respectively. In comparison, Figure 7 (C) and Figure 7 (D) shows emission light under fluorescent lamps and also exhibit an easily observable green emission. It indicates that the prepared samples indeed possess good photoluminescence properties. In present work, the doping concentration of Yb/Er is kept constant and all samples emit green light seen by eyes. In other reports, the emitted light colours are diverse by changing the doped concentration of Yb3+ and Er3+.20,32,33 The colours of the emitted visible light are dominated by the relative percentage of the emitted purple, green and red light and can change through changing the doping Yb3+/Er3+ concentration. Though the emission light keeps green in this work, the green to red ratios (GRR) distributes from 1.18 to 2.02 in present work (the purple light is weak). It indicates that the percentage constitution is not only affected by the different lanthanide doping concentration but also by the different initial K/Y/F ratios. A good way was provided here to tune the relative percentage constitution of each emitted light.
Figure 8 (A) shows the emission spectra of the as-prepared nanocrystal under 974 nm pulsed laser excitation and Figure 8 (B) shows the emission spectra of A3 sample before and after
annealing. Cubic KYF4 nanoparticles exhibit emission peaks with high intensity at 543 nm
and 656/666 nm, weak peaks at 378 nm, 410 nm and 523 nm. The peaks at 378 nm, 410 nm, 523 nm, 543 nm and 656/666 nm are ascribed to the 4G11/2→4I15/2, 2H9/2→4I15/2, 2H11/2→4I15/2, 4
samples have a high luminescent intensity than counterpart samples A which are related to the pure phase, high crystallinity and uniform nanoparticles morphology that we discussed in part 2.1. The increasing of crystallinity and phase purity, uniform and sphere-nanoparticles morphology provide a homogeneous and stable chemical constitution environment that is in favour of the Er3+ transition and further reinforce the photoluminescence intensity. From Figure 8 (B), the emission intensity of A3 gets an obvious improvement after annealing.
Figure 9 shows A2 and B2 log-log plots of emission intensity versus of exciting laser power.
About the difference between A and B samples, the comparison between the results of A2 and
B2 sample for different laser powers in Figure 9 provides more convincing evidence. As
displayed in Figure 9, the given intensity of B2 is much higher than that of A2 at 543 nm and
666 nm, respectively. The shown slope 1.82, 1.83, 1.85 and 1.91 are near to the theoretical value of 2,20 which means the excited state absorb two photons. The gap is resulted from the competing decay processes depleted the Er3+-state number after the first photon absorption in the Yb3+/Er3+ couple situation.36
Figure 10 displays the logarithmic decay curve of sample A1 at 543 nm (4S3/2→4I15/2) and 666
nm (4F9/2→4I15/2) under 974 nm excitation laser. Figure 11 shows the logarithmic decay curve
of sample B1. Figure 12 shows the logarithmic decay curve of annealing sample B1. Figure 13
shows the logarithmic decay curve of annealing sample B3. In addition, only the decay curves
of annealed B3 are fitted well with single exponential function and the others are with double
exponential function. The decay times of A1 and B1 at 543 nm are 3.0 s and 5.6 s,
respectively. The decay times of A1 and B1 at 666 nm are 5.7 s and 7.5 s, respectively. For
sample B1, the annealing treatment procedure shows an obvious effect to increase the lifetime
from 5.6 s to 64s at 543 nm and 7.5s to 87 s at 666 nm. This is because the annealing procedure remove the residual ligands onto the particles (such as NO3- and OH- groups
sourced from reagents) which are known to quench the radiative procedure of Yb3+/Er3+ to decrease the up-conversion efficiency.37,38 Especially, the decay curve of annealing B3 shows
a long lifetime and fit well with single exponential function. A few literatures reported the lifetime of KYF4-based up-conversion nanocrystal, such as KYF4:Nd,21 and
KYF4:Eu22,23.Here we example hexagonal NaYF4:Yb3+/Er3+ 7,12,39 which has been thought to
own the highest efficiency known today to compare. The lifetime of core-shell CdS/
NaYF4:Yb3+/Er3+ is s for the green wavelengths and s for the red
wavelengths.12
It is necessary to discuss the factors that affect the given host upconversion nanocrystal doped with given concentration of Ln3+. Here we emphasize the “given” host materials and “given” concentration of doped Ln3+. As our previous discussion, the host material is important because of their phonon energy.11 The concentration of the doped Ln3+ is significant for too lower concentration cannot provide enough ions for activating and too higher concentration will cause non-radiative relaxation from the adjacent doping Ln3+ to quench the UC. So, apart from a well-adapted low phonon energy host material and suitable doping concentration, the shape and size of the particles are the mainly further considerable factors.25 Small size nanoparticles have high surface-to-volume ratio, suggesting more quenching ligands exist onto the particle surface. Nanoparticles with spherical shape allow to reduce the ratio of surface/volume than the one with random shape. Because a great surface brings more surface ligands and high surface defect density that result in increasing the probability of non-radiative losses. Currently, publishing works focus on controlling the size and shape to improve UCNs photoluminescence properties. So, the decay time and efficiency has a relationship with the nanoparticle size and shape.2539 However, the nanoparticles with a small size are in favour of efficient body clearance, efficient cell membrane transport and designing high-contrast agents for magnetic resonance imaging (MRI). These principles are the basic
requirements of biomedical applications.25 So, for biological imaging application field one of the challenges is to obtain small size nanoparticles with high efficiency. Namely, a balance between the size and optical properties for a given nanoparticles should be concerned. But for applying in solar cell, large nanoparticles are preferred because the long decay time accompany with it.
In summary, the facile and ultrafast RT co-precipitation method, the environment-friendly solvents, the excellent emission spectra and desirable lifetime make KYF4 possibly as a novel
popular host material in UCNs field. With further treatment, it has potential in the application for vivo bioimaging, solar cell and so on. Moreover, this simple and ultrafast way may provide a novel thought to solve the obstacle faced by UCNs.
3. Conclusion
In present work, cubic KYF4:10%Yb/5%Er up-conversion nanoparticles with excellent
emission intensity (under 974 nm laser excitation) and desirable fluoresce lifetime (annealing sample B3: 40 μs in 4S3/2→4I15/2 and 117 μs in 4F9/2→4I15/2 transition of Er3+, respectively)
were successfully synthesized by a extremely facile RT co-precipitation method in the mixed deionized water and ethanol solution. To our knowledge, it is the first time to successfully prepare KYF4:Yb/Er UCNs at RT and report it’s lifetime. Mean crystallite sizes in 20-33 nm
calculated by Williamson-Hall methods were in good agreement with the nanoparticle sizes observed from HRTEM images. Meanwhile, the samples synthesized with deionized water-ethanol solution have lower microstrain than the samples prepared in the deionized water solvent. The slopes of the emission intensity versus excitation laser power curves at red and green were all near to 2, which means the excited state absorb two photons. Though the readily as-prepared cubic KYF4:10%Yb/%Er up-conversion nanoparticles have a good
shape factors we discussed previously. The extremely readily method that we successfully used to prepare this UCNs may provide a new way to reconsider the disadvantages of the widely used routes. Meanwhile, the present work enriches the researches about KYF4-based
UCNs.
4. Experimental Section
4.1 Reagents and materials
All reagents including KNO3.6H2O, Y(NO3)3.6H2O, Er(NO3)3.6H2O, Yb(NO3)3.6H2O and
NH4F were purchased from Aldrich and used as received without further purification or
modification.
4.2 Synthesis procedure
For comparison, three different initial K/Y/F ratios (Table 1) were designed including K/Y/F=2/1/5 (A1 and B1), K/Y/F=2/1/7 (A2 and B2) and K/Y/F=2/1/9 (A3 and B3). Moreover,
two different reaction conditions A and B at each ratio were provided. The letter A stands for the samples prepared only in deionized water while letter B stands for samples prepared in mixed medium of deionized water and ethanol. Using mixed deionized water and ethanol could reduce the introduced surface ligand that quench the UC process compared with other widely used complicated organic solvent such as octadecane and oleylamine. They are also safer, more economical and accessible than the complicated organic solvents. .
In a typical procedure, 2 mmol KNO3.6H2O, 0.85 mmol Y(NO3)3.6H2O, 0.05 mmol
Er(NO3)3.6H2O and 0.1 mmol Yb(NO3)3.6H2O were added into 15 ml deionized water and
stirring for 5-10 minutes. Then, m (5/7/9) mmol NH4F was added into 20 ml deionized
water(A1, A2 and A3) or the mixture of 10 ml ethanol and 10ml deionized water (B1, B2 and
solution to form white precipitation in the final solution. After stirring the above mixture solution for only 2 minutes, the final solution was washed and dispersed with deionized water and ethanol several times, respectively. The final obtained white samples were dried for 12 h in drying oven at 90 ℃. The samples were annealed at 400 ℃ for 4 h in a furnace under an argon stream. Not any surfactant, chelator or capping reagents were used.
For analyzing the XRD patterns, other samples (Figure 2) with different initial K/Y/F ratios were also prepared in a similar way except for different adding amount of the reagents.
4.3 Characterization
X-ray powder diffraction (XRD) data were measured on an X’Pert Pro Diffractometer (Panalytical) with Cu K ( = 1.5406 Å) radiation (40 kV, 45 mA ). The program Fullprof was used to refine the profile of XRD patterns. High-resolution transmission electron microscope (HRTEM) images were captured on a JEOL JEM 2100Plus (equipped with a LaB6 filament) microscope operating at 200 kV. The images were collected with a 4008 ×
2672 pixel CCD camera (Gatan Orius SC1000). The emission spectra and fluorescence decay time were all excited under a tunable Ekspla NT342B OPO laser with 7 ns pulse duration. A CCD camera (Princeton Instruments) equipped with a monochromator (Acton Research, 300 lines/mm) was used to measure the fluorescence spectra. An RCA 8850 photomultiplier was used to detect the decay curves. All measurements were performed at room temperature.
Acknowledgements
Here we gratefully acknowledge financial support from CSC (China Scholarship Council; Scholarship Code: 201606870047).
1. F. Auzel, Upconversion and anti-stokes processes with f and d ions in solids. Chem.
Rev., 104, 139–173 (2004).
2. G. Liu and B, Jacquier, Spectroscopic properties of rare earths in optical materials.
Springer, USA (2005).
3. F. Auzel, Upconversion processes in coupled ion systems. J. Lumin., 45, 341–345 (1990).
4. F. E. Auzel, Materials and devices using double-pumped phosphors with energy transfer. Proc. IEEE, 61, 758–786 (1973).
5. P. P. Nampi, H. Varma, P. R. Biju, T. Kakkar, G. Jose, S. Saha, and P. Millner, Sodium yttrium fluoride based upconversion nano phosphors for biosensing. J. Phys. Conf. Ser.,
619, 012043 (2015).
6. J. Zhao, J. A. Piper, J. M. Dawes, D. Jin, and E. M. Goldys, Mechanisms of size-dependent lifetime quenching in luminescent upconverting colloidal NaYF4:Yb, Er
nanocrystals. 2011 Int. Quantum Electron. Conf., 384–386 (2011).
7. W. Deng, L. Sudheendra, J. Zhao, J. Fu, D. Jin, I. M. Kennedy, and E. M. Goldys, Upconversion in NaYF4:Yb, Er nanoparticles amplified by metal nanostructures.
Nanotechnology, 22,325604 (2011).
8. Y. Zhu, S. Zhao, B. Zhou, H. Zhu, and Y. Wang, Enhancing upconversion luminescence of LiYF4:Yb,Er nanocrystals by Cd2+ doping and core-shell Structure. J.
9. P. Lei, R. An, S. Yao, Q. Wang, L. Dong, X. Xu, K. Du, J. Feng, and H. Zhang, Ultrafast synthesis of novel hexagonal phase NaBiF4 upconversion nanoparticles at
room temperature. Adv. Mater., 29, 1700505 (2017).
10. F. Wang and X. Liu,. Upconversion multicolor fine-tuning: visible to near-infrared emission from lanthanide-doped NaYF4 nanoparticles. J. Am. Chem. Soc., 30, 5642–
5643 (2008).
11. A. C. Yanes, A. Santana-Alonso, J. Mendez-Ramos, and J. del-Castillo, Structure and intense UV up-conversion emissions in RE3+-doped sol-gel glass-ceramics containing KYF4 nanocrystals. Appl. Phys. B Lasers Opt., 113, 589–596 (2013).
12. X. Su, X. Sun, S. Wu, and S. Zhang, Manipulating the emission intensity and lifetime of NaYF4:Yb3+,Er3+ simultaneously by embedding it into CdS photonic crystals.
Nanoscale, 9, 7666–7673 (2017).
13. L. Liang, Y. Liu, C. Bu, K. Guo, W. Sun, N. Huang, T. Peng, B. Sebo, M. Pan, W. Liu, S. Guo, and X.-Z. Zhao, Highly uniform, bifunctional core/double-shell-structured β-NaYF4 :Er3+,Yb3+@SiO2@TiO2 hexagonal sub-microprisms for high-performance dye
sensitized solar cells. Adv. Mater., 25, 2174–2180 (2013).
14. B. Chai, J. Lefaucheur, A. Pham, G. Lutts, and J. Nicholls, Growth of high quality single crystals of KYF4 by TSSG method. SPIE, 1863, 131-135,USA (1993)
15. Z. Xia, A. Arcangeli, R. Faoro, and M. Tonelli, Luminescence study of the f-f transition of Pr3+ 1D2 and 3P0 states in KYF4 crystals and powders. Optoelectron. Adv.
Mater. – Rapid Commun., 5, 336–340 (2011).
16. L. Bonelli, A. Toncelli, A. Di Lieto, and M. Tonelli, Spectroscopic analysis of 10% Yb3+:KYF4 crystal. J. Phys. Chem. Solids, 68, 2381–2386 (2007).
17. M. Bouffard, T. Duvaut, J. P. Jouart, N. M. Khaidukov, and M. F. Joubert, Site-selective upconversion excitation of Er3+:KYF4. J. Phys. Condens. Matter, 11, 4775–
4782 (1999).
18. E. Sani, A. Toncelli, M. Tonelli, and F. Traverso, Growth and spectroscopic analysis of Tm, Ho:KYF4. J. Phys. Condens. Matter, 16, 241–252 (2004).
19. J. G. Bartholomew, Z. Zhang, A. D. Lieto, M. Tonelli, and P. Goldner, High resolution spectroscopy of the 7F0-5D0 transition in Eu3+:KYF4. J. Lumin., 171, 221–225 (2016).
20. H. Schäfer, P. Ptacek, O. Zerzouf, and M. Haase, Synthesis and optical properties of KYF4/Yb,Er nanocrystals, and their surface modification with undoped KYF4. Adv.
Funct. Mater., 18, 2913–2918 (2008).
21. E. V. Samsonova, A. V. Popov, A. S. Vanetsev, K. Keevend, K. Kaldvee, L. Puust, A. E. Baranchikov, A. V. Ryabova, S. G. Fedorenko, V. Kiisk, I. Sildos, J. Kikas, R. Steiner, V. B. Loschenov, and Y. V. Orlovskii, Fluorescence quenching mechanism for water-dispersible Nd3+:KYF4 nanoparticles synthesized by microwave-hydrothermal
technique. J. Lumin., 169, 722–727 (2016).
22. S. Guo, C. Cao, and R. Cao, Synthesis and optical properties of Eu3+ doped NaYF4 and
KYF4 micro/nanocrystals. J. Nanosci. Nanotechnol., 16, 3857–3860 (2016).
23. Y. Wang, Y. Liu, Q. Xiao, H. Zhu, R. Li, and X. Chen, Eu3+ doped KYF4 nanocrystals:
synthesis, electronic structure, and optical properties. Nanoscale, 3, 3164–3169 (2011).
24. Y. Wang, S. Gai, N. Niu, F. He, and P. Yang, Synthesis of NaYF4 microcrystals with
different morphologies and enhanced up-conversion luminescence properties. Phys.
25. A. Noculak and A. Podhorodecki, Size and shape effects in β-NaGdF4: Yb3+,Er3+
nanocrystals. Nanotechnology, 28, 175706 (2017).
26. L. Huang, T. Yamashita, R. Jose, Y. Arai, T. Suzuki, and Y. Ohishi, Intense ultraviolet emission from Tb3+ and Yb3+ codoped glass ceramic containing CaF2 nanocrystals.
Appl. Phys. Lett., 90, 131116 (2007).
27. J. Maixner and V. Bartuneek, X-ray powder diffraction data for potassium erbium fluoride. Powder Diffr., 28, 305–306 (2013).
28. Y. Q. Jia, Crystal radii and effective ionic radii of the rare earth ions. J. Solid State
Chem., 95, 184–187 (1991).
29. R. D. Shannon, Revised effective ionic radii and systematic studies of interatomie distances in halides and chaleogenides. Acta Cryst., 32, 751–767 (1976).
30. Y. T. Prabhu, K. V. Rao, V. S. S. Kumar, and B. S. Kumari, X-Ray analysis by Williamson-hall and size-strain plot methods of ZnO nanoparticles with fuel variation.
World J. Nano Sci. Eng., 04, 21–28 (2014).
31. D. N. Ungureanu, N. Angelescu, R. M. Ion, E. V. Stoian, and C. Z. Rizescu, Synthesis and characterization of hydroxyapatite nanopowders by chemical precipitation. 10th
WSEAS Int. Conf., 296–301 (2011).
32. B. Zhou, Y. Wang, and D. Xia, Colloidal β-KYF4:Yb3+,Er3+/Tm3+ nanocrystals: tunable
multicolor up-conversion luminescence from UV to NIR regions. RSC Adv., 5, 66807– 66814 (2015).
33. J.-H. Zeng, J. Su, Z.-H. Li, R.-X. Yan, and Y.-D. Li, Synthesis and upconversion luminescence of hexagonal-phase NaYF4:Yb, Er3+ phosphors of controlled size and
morphology. Adv. Mater., 17, 2119–2123 (2005).
34. G.-S. Yi, and G.-M. Chow, Water-soluble NaYF4:Yb,Er(Tm)/NaYF4/polymer core
shell/shell nanoparticles with significant enhancement of upconversion fluorescence.
Chem. Mater., 19, 341–343 (2007).
35. G. Yi, H. Lu, S. Zhao, Y. Ge, W. Yang, D. Chen, and L.-H. Guo, Synthesis, characterization, and biological application of size-controlled nanocrystalline NaYF4 :
Yb, Er infrared-to-visible up-conversion phosphors. Nano Lett., 4, 2191–2196 (2004).
36. M. Pollnau, D. R. Gamelin, S. R. Luthi, and H. U. Gudel, Power dependence of upconversion luminescence in lanthanide and transition-metal-ion systems. Phys. Rev.
B, 61, 3337–3346 (2000).
37. C. Homann, L. Krukewitt, F. Frenzel, B. Grauel, C. Wurth, U. Resch-Genger, and M. Haase, NaYF4:Yb,Er/NaYF4 core/shell nanocrystals with high upconversion
luminescence quantum yield. Angew. Chemie, 57, 8765–8769 (2018).
38. R. Arppe, I. Hyppanen, N. Perala, R. Peltomaa, M. Kaiser, C. Wurth, S. Christ, U. Resch-Genger, M. Schaferling, and T. Soukka, Quenching of the upconversion luminescence of NaYF4:Yb3+,Er3+ and NaYF4:Yb3+,Tm3+ nanophosphors by water: the
role of the sensitizer Yb3+ in non-radiative relaxation. Nanoscale, 7, 11746–11757 (2015).
39. J. Zhao, Z. Lu, Y.Yin, C. McRae, J. A. Piper, J. M. Dawes, D. Jin, and E. M. Goldys, Upconversion luminescence with tunable lifetime in NaYF4:Yb,Er nanocrystals: role of
Figure 2. XRD powder patterns of the samples and cubic KY3F10 from literature.
Figure 4. Linear fit Bsample cos() versus 4sin() of the sample A1
Figure 6. Transmission electron microscope (TEM) images of the prepared
A1, A2, A3, B1, B2 and B3 nanoparticles corresponding to (A1), (A2), (A3), (B1), (B2) and (B3),
Figure 7. Emission light photographs of annealing B1 sample under 974 nm pulse laser
excitation: A) powders in a darkroom; B) 0.05 g/L colloidal solution in (ethylene glycol) EG in a darkroom; C) powders and under the fluorescent lamp; and D) 0.05 g/L colloidal solution under the fluorescent lamp.
Figure 8. A) The emission spectra of the prepared nanocrystal under 974 nm pulse laser excitation; B) emission spectra of A3 before and after annealing treatment under 974 nm pulse
Figure 10. The logarithmic decay curve of A1 at 543 nm (4S3/2→4I15/2) and 666 nm
Figure 11. The logarithmic decay curve of B1 at 543 nm (4S3/2→4I15/2) and 666 nm
Figure 12. The logarithmic decay curve of annealed B1 at 543 nm (4S3/2→4I15/2) and 666 nm
Figure 13. The logarithmic decay curve of annealed B3 at 543 nm (4S3/2→4I15/2) and 666 nm
(4F9/2→4I15/2) under 974 nm laser excitation.
Table 1. Specification of the samples with different initial K/Y/F ratios and different reacting solvents.
Deionized water
Mixed deionized water-ethanol solution
K/Y/F=2/1/5 A1 B1
K/Y/F=2/1/7 A2 B2
Table 2. The caclulated mean crystallite size D and microstrain by Williamson-Hall method.
Samples Yintercept(×10-3) Mean crystalite
size(nm) (%) A1 4.45±0.15 31-33 0.19±0.01 A2 5.68±0.36 23-27 0.09±0.02 A3 5.75±0.29 23-26 0.11±0.02 B1 5.22±0.50 25-30 0.04±0.03 B2 6.61±0.48 20-23 0.09±0.02 B3 6.52±0.61 20-24 0.04±0.03