Original scientific paper 10.7251/AGRENG1901032M UDC 633.15(675.98)
PRODUCTIVITY AND COMPETITIVENESS OF RWANDAN
AGRICULTURE: A CASE STUDY OF THE MAIZE SECTOR
Edouard MUSABANGANJI
1*, Charles RURANGA
2, Joseph
NZABANITA
2, Ferdinand NKIKABAHIZI
1, Idrissa NDIZEYE
1, Philippe
LEBAILLY
31College of Business and Economics, University of Rwanda, Rwanda 2African Center of Excellence in Data Science, University of Rwanda (ACE-DS/UR),
Rwanda
3Economy and Rural Development Unit, Gembloux Agro-Bio Tech, University of Liège, Belgium
*Corresponding author: musabanganji@gmail.com ABSTRACT
This study investigated the level of productivity and competitiveness of Rwandan agriculture by focusing on the case study of the maize sector. The data were collected through close monitoring of maize production activities on a sample of 50 producers from five maize producers’ cooperatives selected in the districts of Huye, Rusizi, Gasabo, Burera and Bugesera (Rwanda) during two agricultural seasons of 2013/2014 and 2014/2015. They were supplemented by direct observation, interviews with targeted resource persons and secondary data on maize imports and exports retrieved from FAOSTAT website. The analysis was conducted using the comparative analysis, the farm-level economic performance indicators, the Net Export Index (NEI) and the Grubel-Lloyd (GL) measure. The results revealed that the yield was very low compared to theoretical expected yields for about 80% of producers. The analysis showed that the rational use of improved seeds, chemical and organic fertilizers improved the yield. The analysis of the NEI and the GL measures for maize flour and maize grain revealed that Rwanda was a net importer. For these staple foods, the results revealed that if Rwanda managed, through policy and institutional actions, to remove or alleviate the bottlenecks that prevent farmers from producing enough for export, it could have had a competitive advantage on regional markets.
Keywords: Agriculture, competitiveness, maize sub-sector, productivity, Rwanda. INTRODUCTION
Rwanda is a landlocked country with an area of 26,338 km2 with an estimated average population density of 434 inhabitants per km² in 2015 (NISR, 2016). It is ranked among the most densely populated countries in the world. The poverty and extreme poverty levels are estimated at 39.1 and 16.3% of the population
respectively (NISR, 2015). Agriculture continues to be the leading employer with more than 80% of the economically active population (Musabanganji, 2017) and remains the engine of economic growth in Rwanda. It provides more than 70% of exports in value and accounts for 30% of the Gross Domestic Product (GDP) (NISR, 2017). This economic context, in which agriculture contributes significantly to the country's economic growth, is a peculiarity of many developing economies characterized by a low level of industrialization. For many years, Rwanda has been aware of the role of the agricultural sector in combating poverty and improving the livelihood of its population. Along with the agricultural global and regional commitments, Rwanda developed a policy and strategic framework fostering agricultural and economic development. These include the socio-economic development program known as 'Vision 2020' aiming at transforming Rwanda into a middle-income country by 2020 and the national agricultural policy adopted in 2000 and 2004 respectively. Thereafter, all sectoral programs that have been implemented are a direct consequence of this vision by defining its operationalization frame in various sectors in order to achieve the expected socio-economic development. In this context, besides the growth and agricultural marketing pointed out by Huggins (2013) as key elements of economic expansion, regional trade is also perceived by Rwanda as one of crucial elements enabling agricultural development and boosting its economy. The later allows increasing the share of agricultural production on regional markets and easing goods and services transfer between regional integration agreements partner countries. This has been evidenced by the results that followed its accession to the East African Community (EAC) in July 2007. Since then, the country revised its trade policy and initiated several agriculture related programs and strategies to improve the production capacity, and then guarantee a satisfactory supply, and integrate in both domestic and regional markets for both cash and food crops. Thus, as the ability of the Rwandan primary sector to deal with increasing competition from trade liberalization and its membership to EAC has a significant effect on the macro and micro levels of the national economy, it should be noted that the country needs an agriculture sector which is not only competitive in domestic and regional markets but also able to ensure the food security of the population and generate income for producers. For more than a decade, Rwanda has adopted a series of policies and strategies aimed at economic development and the improvement of the living conditions of its predominantly agricultural population. In agriculture, implementation of these strategies and related programs has been accompanied by a series of advances in the adoption of farming technologies and increasing agricultural production. These initiatives have mainly targeted six priority food crops, namely, the maize, potato, bean, soybean, rice and wheat sectors to make them more productive and competitive. For the maize sector, which is the subject under study, available data reveal that the cultivated area has doubled (about 2.2 times) from 102 000 ha in 2007 to 223,414 ha from 102 000 ha to 223,414 ha in 2011. In season A of 2017, in terms of cultivated area, maize was the fourth largest crop after banana, beans and cassava with 16% which is 23% increase from 2016
while in season B, it was the fifth largest crop with 7.1% corresponding to 27% increase in cultivated area from 2016 (NISR, 2018). The yield has gradually increased from an average of 0.96 tons per hectare in 2006 to 2.35 tons per hectare in 2013 (MINICOM, 2014). However, notwithstanding the increase in cultivated area, yield and produced quantity of maize observed in recent years reflecting the combined effect of the agricultural intensification program and land consolidation policy, the country is continuously depending on imports to meet domestic demand, and maize processing plants always operate below their productive capacity (RDB, 2014). This research aims at examining the level of productivity and competitiveness of this sector in the current production and marketing conditions in order to identify existing constraints and formulate the strategies that can help improve the level of economic performance of maize production and maize marketing system.
MATERIALS AND METHODS
The data used to study the economic performance of maize production come from close monitoring of maize production activities of a sample of 50 farmers selected from five maize producers’ cooperatives namely KOAGIMPA, KOTEMIBU, COODAKI, ABAKUNDAKURIMA and INDAKUKI operating respectively in the districts of Huye, Rusizi, Gasabo, Burera and Bugesera during two growing seasons of 2013/2014 and 2014/2015. They were supplemented with direct observation, interviews with targeted resource persons and secondary data on the value of maize (flour and grain) imports and exports retrieved from FAOSTAT website and National Bank of Rwanda (NBR). The analysis was conducted using the yield as the farm-level economic performance indicator. The Net Export Index (NEI) and the Grubel-Lloyd (GL) measure were used to analyse the level of trade performance for maize sector from 2000 to 2017. Note that these indices are calculated for maize grain and flour in trade between Rwanda and trade partner countries of the world. The choice of these two trade indices was based on the fact that they take into account all marketing and transport related costs, and consider simultaneously responses from both demand and supply sides (Frohberg and Hartmann, 1997). Based on Latruffe (2010), these indicators are given by the following equations in the case of a single country and multiple sectors trade analysis: i i i i i
M
X
M
X
NEI
(Banterle and Carraresi, 2007), where X are exports; M are imports; i denotes the sector or product considered. The NEI values lie between -1 (when a country imports only) and 1 (when a country exports only), with a value of 0 in the case of the equality of imports and exports.i i i i i
M
X
M
X
GL
1
(Banterle and Carraresi, 2007), where X are exports; M are imports; i denotes the sector or product considered. GL measure has a rangebetween 0 and 1, with the value 0 indicating inter-industry trade, while the value 1 indicates an intra-industry trade only.
RESULTS AND DISCUSSIONS
Analysis of maize productivity and inputs use in Rwanda
Studies have shown that the types of seeds and fertilizers used in the
required proportions, favorable climatic conditions and the control of
harmful organisms combined with the application of improved farming
methods play an important role in agricultural productivity (e.g. Kpedzroku
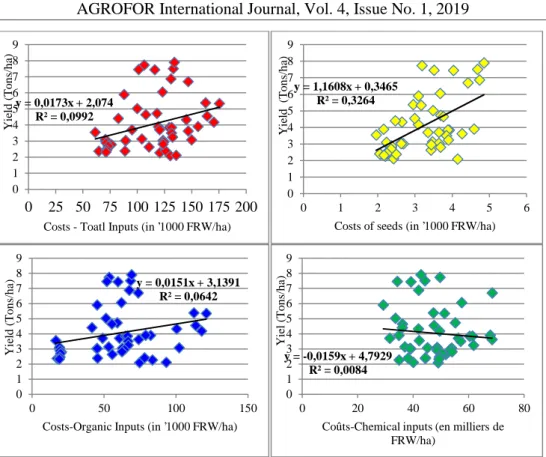
and Didjeira, 2008, 2011). The results shown in Figure 1 reveal three
scenarios: (i) there are maize producers who performed well with a high
yield while they have relatively invested less means in the acquisition of
inputs, and (ii) other farmers who invested much money in inputs but have
registered lower maize yield per hectare (ha). Compared to the theoretical
mean yield of 5 tons/ha, the results showed that around 80% of farmers
registered lower yield. The reasons behind this are multiple. In Rwanda
where land is generally considered as deteriorated, and therefore, lacking
enough mineral salts necessary for plant growth, this situation revealed by
the study is on one hand grounded in the fact that maize growers would
have invested all available resources in the acquisition of a single input such
as improved seeds or chemical fertilizers for instance, whereas the use of a
single input cannot ensure the best land productivity. On the other hand, the
other reason that would be behind such a fact would be the possible failure
of producers to respect the dosages prescribed for such or such other input
whereas the use of a given input must be done optimally in accordance with
prescribed rules and dosages requiring to use only sufficient quantities to
meet needed nutrients in a manner that ensures the productivity, the quality
and the desired growth rate in maize growing. In this regard, FAO (2005)
underlines that an adapted fertilization level is a must to achieve the
production level required by the genetic potential of a given species. Hence,
the fertilization requires to be properly evaluated so as to achieve economic
optimum. In case of over dosage, the productivity reduces due to toxicity
effect (FAO, 2005). In addition, the study by Musabanganji et al. (2016b)
has documented that most of smallholder farmers in cooperatives in Rwanda
are experiencing the lack of financial means and technical assistance. Then,
it seems evident that maize growers have difficulties acquiring all necessary
inputs, and even those who are capable fail to use them in convenient and
rational manner due to lack of required knowledge.
Figure 1: Relationship between cost inputs and the productivity (Tons/ha) Source: Authors based on 2014 and 2015 research findings
It is worth noting that in addition to ‘input’ factor proven as playing a crucial role in increasing productivity, there are other factors to which the variation of productivity observed among different operating sub-groups is attributable. They include (i) soil conditions or geographic potential related to maize growing, varying from one region to another ; (ii) the level of adoption of agricultural technologies and innovations varying from one producer to another and from one production zone to another (the varying level of fertilizers utilization for the improvement of soil quality and plant protection products for fighting against parasites and diseases attacking maize in the fields) ; (iii) the variability of various seeds used by the producers ; and (vi) technical support serves received by the producers differing from one zone to another, playing a crucial role in the growing process pattern. y = 0,0173x + 2,074 R² = 0,0992 0 1 2 3 4 5 6 7 8 9 0 25 50 75 100 125 150 175 200 Y ie ld ( T o n s/ h a)
Costs - Toatl Inputs (in '1000 FRW/ha)
y = 1,1608x + 0,3465 R² = 0,3264 0 1 2 3 4 5 6 7 8 9 0 1 2 3 4 5 6 Y ie ld (T o n s/ h a)
Costs of seeds (in '1000 FRW/ha)
y = 0,0151x + 3,1391 R² = 0,0642 0 1 2 3 4 5 6 7 8 9 0 50 100 150 Y ie ld ( T o n s/ h a)
Costs-Organic Inputs (in '1000 FRW/ha)
y = -0,0159x + 4,7929 R² = 0,0084 0 1 2 3 4 5 6 7 8 9 0 20 40 60 80 Y ie l (T o n s/ h a)
Coûts-Chemical inputs (en milliers de FRW/ha)
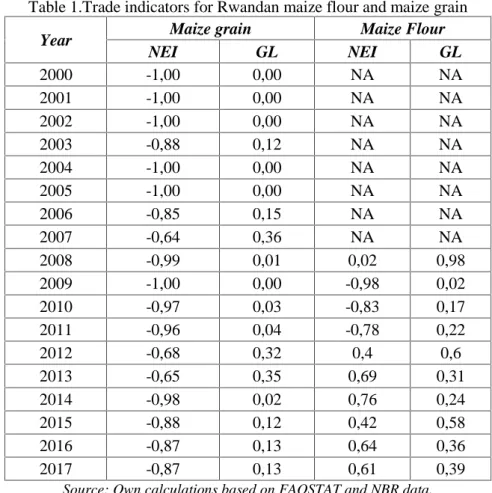
Analysis of Rwandan agricultural trade performance: A case of maize sector The analysis of agricultural trade performance of a given sector can be carried out by assessing trade indices of competitiveness (Latruffe, 2010). There is a list of neoclassical economics based indicators focusing on trade success and measuring competitiveness with the real exchange rate, comparative advantage indices, and export or import indices (Latruffe, 2010). Comparing with indices based on accounting data, trade indices offer two main advantages: (i) the costs of marketing and transport to and from the port of entry are also taken into account, and (ii) demand and supply responses are considered simultaneously (Frohberg and Hartmann, 1997). The results reported in Table 1 reveal that NEI index is mostly negative for maize grain and maize flour indicating that Rwanda is a net importer of maize grain and maize flour while the GL index is positive and close to zero for the study period, and using a threshold of a GL measure of 0.5 (Banterle and Carraresi, 2007), the results attest that Rwanda is exhibiting a strong inter-industry trade for many years out of 14 considered for the study period. This is explained by the fact that, even though Rwanda has improved its agricultural production following the implementation of various strategic plans for agricultural transformation, it has not yet managed to produce enough for its population hence the increase of imports. In addition, as mentioned by Musabanganji (2017), the rise in imports is also due to the fact that Rwanda has relatively high production costs for many agricultural products in the East African community region. The study results also attest that, in addition to being an importer of maize grain and maize flour, Rwanda is an exporter of some of its agricultural products. Indeed, as USAID/EAT (2013) points out, Rwanda is the main source of agro-food products including corn flour, grain corn, beans, dairy products and livestock formally or informally imported by the eastern region of the Democratic Republic of Congo inhabited by more than 2 million inhabitants (including 1.8 million for Bukavu and Goma) who cannot be fed only by local production. The Akagera region in Tanzania, Burundi and Uganda are also the importing regions of Rwanda's agricultural products and are the main markets for its agricultural production (Musabanganji et al., 2016a). These trade flows result from its integration into the EAC since 2007 which has facilitated access to these markets. Moreover, it should be noted that following its accession to the EAC, Rwanda can develop its export potential, but success will depend more on the increased accompanying measures to develop a dynamic commercial network that can provide specific products in the identified markets. It is worth noting that during the period from 2000 to 2007, data on imports and exports of maize flour are not available.
Table 1.Trade indicators for Rwandan maize flour and maize grain Year Maize grain Maize Flour
NEI GL NEI GL 2000 -1,00 0,00 NA NA 2001 -1,00 0,00 NA NA 2002 -1,00 0,00 NA NA 2003 -0,88 0,12 NA NA 2004 -1,00 0,00 NA NA 2005 -1,00 0,00 NA NA 2006 -0,85 0,15 NA NA 2007 -0,64 0,36 NA NA 2008 -0,99 0,01 0,02 0,98 2009 -1,00 0,00 -0,98 0,02 2010 -0,97 0,03 -0,83 0,17 2011 -0,96 0,04 -0,78 0,22 2012 -0,68 0,32 0,4 0,6 2013 -0,65 0,35 0,69 0,31 2014 -0,98 0,02 0,76 0,24 2015 -0,88 0,12 0,42 0,58 2016 -0,87 0,13 0,64 0,36 2017 -0,87 0,13 0,61 0,39
Source: Own calculations based on FAOSTAT and NBR data.
CONCLUSION AND RECOMMENDATIONS
The results of this study show that although farmers sometimes do better in farming, it should be noted that, in the absence of adequate technical assistance, their knowledge regarding inputs use is not certain. However, in addition to putting in place actions to improve the economic conditions of maize producers like easing access to credit, it is also necessary to improve technical assistance for maize producers and increase sensitization sessions on the use of inputs. The monitoring of farmers’ activities on regular basis, the training on farming techniques and basics of accounting analysis of agricultural production (for at least those with a primary level or team leaders), the adoption of technological package at the level of each cooperative seem to be necessary measures that would contribute to the increase of productivity at the level of maize producers' cooperatives. The analysis of NEI and GL trade performance indicators for maize flour and maize grain reveals that Rwanda is a net importer of maize flour and maize grain. For these two foodstuffs, it is clear that if Rwanda manages, through policy and institutional actions, to remove or alleviate the bottlenecks ─ among which the financial difficulties and lack of access enough technical knowledge ─ that prevent farmers
from producing enough for export, it can have a competitive advantage in the neighboring countries' markets whose access is facilitated by its accession to the EAC. Low productivity implies low trade performance. Thus, increasing the competitiveness of agriculture throughout modernization of farms, precisely more investment in new technology of maize production can lead to increasing of productivity and improving trade performance. In this regard, it should be noted that non government organizations, institutions of higher education and scientific research and government agencies as the Rwanda Agriculture Board should work in synergy to improve their support to agricultural cooperatives especially in the transfer of knowledge and modern technology through demand-tailored training and demonstration sessions to help increase the agricultural output and that of the maize sector in particular.
ACKNOWLEDGEMENT
The dissemination of the results of this research would not have been possible without the financial support of the African Center of Excellence in Data Science of the University of Rwanda (ACE-DS/UR).
REFERENCES
Banterle, A. and Carraresi, L. (2007). Competitive performance analysis and European Union trade: The case of the prepared swine meat sector. Food
Economics – Acta Agricult Scand C, Vol. 4, pp. 159-172.
FAO (2005). Notions de nutrition des plantes et de fertilisation des sols. Manuel de formation, Projet Intrants. Rome : Organisation des Nations Unies pour l’alimentation et l’agriculture.
Frohberg, K. and Hartmann, M. (1997). Comparing Measures of Competitiveness. Discussion Paper No. 2, Institute of Agricultural Development in Central and Eastern Europe (IAMO). Halle Germany.
Huggins, C. (2013). «
L’investissement agricole » facilité par l'État au Rwanda: regroupement des terres, renforcement du contrôle. LDPI Working Paper 16. Bellville, South Africa: The Land Deal Politics Initiative.Kpedzroku, A. and Didjeira, A. (2008). Guide de production de semences certifiées
maïs- sorgho-riz-niébé. Lomé : ITRA/ICAT/CTA. (Collection brochures et
fiches techniques ; n° 1).
Latruffe, L. (2010). Competitiveness, Productivity and Efficiency in the Agricultural and Agri-Food Sectors. OECD Food, Agriculture and Fisheries
Working Papers, No: 30, OECD Publishing.
http://dx.doi.org/10.1787/5km91nkdt6d6-en
.MINICOM (2014). Maize Value Chain Assessment. Final Report. Kigali: Ministry of Trade and Industry.
Musabanganji E., Karangwa, A., and Lebailly, P. (2016a). Intensification of smallholder agriculture in Rwanda: scenarios and challenges towards a sustainable transformation. A Paper presented in 5th African Association of
Agricultural Economists (AAAE) conference, 23-26 September 2016, Addis-Ababa, Ethiopia.
Musabanganji, E. (2017). Constraints and strategies for improving the maize sector in Rwanda. (PhD Thesis in French). University of Liège, Gembloux Agro-Bio Tech, Belgium, 205 pages, 35 tables, 26 figures.
Musabanganji, E., Karangwa, A., Azadi, H. and Lebailly, P. (2016b). Regional Integration and Agricultural Trade Development in Rwanda: The case of Staple Foods Sector. Agriculture & Forestry, 62 (2): 1 53-1 62. DOI:
10.17707/AgricultForest.62.2.14.
NISR (2015). Rwanda Poverty Profile Report. Integrated Household Living Conditions Survey 2013/2014. Kigali: National Institute of Statistics of Rwanda.
NISR (2016). Statistical Year Book 2016. Kigali: National Institute of Statistics of Rwanda.
NISR (2017). Statistical Year Book 2017. Kigali: National Institute of Statistics of Rwanda.
NISR (2018). The 2017 Seasonal Agricultural Survey. Kigali: National Institute of Statistics of Rwanda.
RDB (2014). Opportunities for seed industry in Rwanda. Kigali: Rwanda Development Board.
USAID/EAT (2013). Rwanda Cross-Border Agricultural Trade Analysis. A report produced by the USAID/Enabling Agricultural Trade (EAT) project, implemented by Fintrac Inc., Washington.