Early back-calculated size-at-age of Atlantic yellow eels sampled along ecological
1
gradients in the Gironde and St. Lawrence hydrographical systems
2
Géraldine Patey1,2, Catherine M. Couillard2, Hilaire Drouineau3, Guy Verreault4, Fabien
3
Pierron5,6, Patrick Lambert3,Magalie Baudrimont5,6 and Patrice Couture1
4
1
Institut National de la Recherche Scientifique (INRS), Centre Eau Terre Environnement, 490 De 5
La Couronne, Québec, QC G1K 9A9, Canada. Tel: +1 418 654 3825; e-mail: 6
2
Fisheries and Oceans Canada, Maurice Lamontagne Institute, 850 Route de la Mer, Mont-Joli, 8
G5H 3Z4, Québec, Canada, Tel: +1 418 775 0681; Fax: 418 775 0718; e-mail: 9
3
Institut national de Recherche en Sciences et Technologies pour l’Environnement et 11
l’Agriculture (IRSTEA), équipe Poissons Migrateurs Amphihalins (PMA), 50 avenue de Verdun 12
Gazinet, 33612 CESTAS, France. Tel: +33 5 57 89 08 09; e-mail: [email protected] 13
4
Ministère des Forêts, de la Faune et des Parcs, 186 rue Fraser, Rivière-du-Loup, G5R1C8, 14
Québec, Canada. Tel: +1 418 862 8213 poste 306; email: [email protected]
15
5
Univ. Bordeaux, UMR EPOC CNRS 5805, F-33400 Talence, France 16
6CNRS, EPOC, UMR 5805, F-33400 Talence, France. Tel: +33 5 56 22 39 27; Fax: +33 5 40 70 17
85 04; e-mails: [email protected]; [email protected]
18 19
* Corresponding author: Tel: +1 418 261 8906; email: [email protected] 20
Abstract
21
An international sampling program investigating the causes of the decline of American 22
eels (Anguilla rostrata) and European eels (Anguilla anguilla) in the St. Lawrence (Canada) and 23
Gironde (France) rivers systems provided the opportunity to compare early growth of eels of each 24
species among habitats using back-calculated size–at-age from 1 to 5 years old. Our study
25
supports previous studies showing that the early back-calculated lengths of A. anguilla were 26
higher in downstream and more saline Gironde system habitats than in the upstream fluvial 27
section, and provides a new indication that length at 1-year-old is twice higher than that reported 28
10 years earlier. However, our data contradict the current paradigm for A. rostrata by providing 29
evidence that early size-at-age of eels from the upstream St. Lawrence system, most distant from 30
the spawning area, exceeds those of eels sampled downstream, at less distant sites in the estuarine 31
section. Overall these observations are consistent with the hypothesis that the observed spatial 32
variations in early growth rate of yellow eels sampled in the St. Lawrence and Gironde systems 33
are the consequence of processes occurring in the first year of age such as genetic selection 34
and/or genetically-dependent habitat choice. 35
36
Keywords: Anguilla rostrata; Anguilla anguilla; back-calculated length; growth; habitat; St.
37
Lawrence River system; Gironde River system 38
List of abbreviations 39
Abbreviation Signification
CER Certes
DOR Dordogne river
GAR Garonne river
GIR Gironde river
SFL Saint François Lake
SJR Saint Jean River
SOR Sud-Ouest River
SPL Saint Pierre Lake
Y Year
40 41
Introduction
42A decline of North European and American eel populations (here called “Atlantic” eels)
43
has been observed over the last 30 years (Castonguay et al. 1994; Cosewic 2012; Dekker 2003;
44
FAO/ICES 2009). Multiple factors have been evoked, including barriers to migration,
45
overfishing, parasites, pollutants and oceanographic and climate changes (Castonguay et al. 1994;
46
Couillard et al. 2014; Geeraerts and Belpaire 2010), but it remains difficult to disentangle their
47
relative contributions and they have probably acted in synergy (Jacoby et al. 2015; Miller et al.
48
2016).
49
Atlantic eels are two panmictic and catadromous species with very similar life cycles
50
(Avise 2003). After a long trans-oceanic larval drift from their spawning grounds in the Sargasso
51
Sea to the continental shelf, glass eels penetrate into coastal areas, then they grow into elvers and
52
later into yellow eels (Tesch and Rohlf 2003). Yellow eels complete their somatic growth phase
53
in a large range of habitats (estuaries, rivers and lakes)(Daverat and Tomás 2006; Jessop 2010).
54
At the end of the yellow phase, they undergo a last metamorphosis, turn into silver eels and begin
55
their long migration to the Sargasso Sea where they reproduce and die (Tesch and Rohlf 2003).
56
The growth phase associated with lipid accumulation is a key determinant of trans-oceanic
57
migration, fecundity, and consequently of reproductive success (Belpaire et al. 2009; Svedäng
58
and Wickström 1997). Since the metamorphosis into silver eels and the success of their
59
reproductive migration are heavily dependent on body length and fat content at migration, growth
60
rate of the yellow phase directly affects reproductive success (Belpaire et al. 2009; Couillard et
61
al. 2014; Van Ginneken and Van den Thillart 2000).
62
Female American and European eels exhibit a latitudinal cline in growth rate, partly
63
explained by temperature, with lower growth rate (at the silver stage) and higher
size-at-64
metamorphosis at higher latitudes and/or longer distances from the spawning site (Jessop 2010;
65
Vélez-Espino and Koops 2009). Our current understanding is that within the St. Lawrence system
66
(Canada), the growth rate of female eels decreases and size-at-metamorphosis increases from the
67
Gulf of St. Lawrence (downstream section) to Lake Ontario (upstream section)(Jessop 2010). 68
While eel’s growth rate is known to be largely plastic (Côté et al. 2014; Drouineau et al. 2008),
69
genetic/epigenetic differences linked to differential migratory patterns or to selection are
70
increasingly supported as contributing factors for the early differential growth rates observed in
71
elvers at different latitudes (Côté et al. 2009; Côté et al. 2014).
72
At the river basin scale, eels can use a wide range of habitats as demonstrated by studies
73
using otolith microchemistry (Daverat and Tomás 2006; Thibault et al. 2007). This also results in
74
variability in growth rates at this basin scale. Yellow eels with different migratory tactics have
75
different growth rates, as shown in the Gironde System (France) for A. anguilla (Daverat et al.
76
2012; Daverat and Tomás 2006; Edeline et al. 2007; Edeline et al. 2005a) and in various sites in
77
the St. Lawrence system for A. rostrata (Boivin et al. 2015; Cairns et al. 2009; Jessop et al. 2007;
78
Thibault et al. 2007). Resident freshwater eels display lower growth rates than resident brackish 79
water eels, and the growth rates of nomadic migrants vary according to habitat salinity (Daverat 80
and Tomás 2006; Thibault et al. 2007). As observed for the latitudinal variations of growth rate,
81
differential growth patterns between salinity ecotypes are detected at an early age (glass eels and 82
elvers) and appear to be related to genetic/epigenetic differences (Côté et al. 2009; Edeline et al. 83
2007; Pavey et al. 2015). 84
The present study is part of an international project examining the influence of
85
anthropogenic and environmental factors on the decline of Atlantic eels. This large-scale
86
sampling program provided a unique opportunity to investigate early size-at-age of yellow
87
Atlantic eels captured at the same time with similar protocols in different habitats of the Gironde
88
and St. Lawrence systems. Previous studies demonstrated that both species exhibited, at an early 89
age, extreme inter-individual phenotypic variance in terms of size-at-age related to 90
genetic/epigenetic differences and to the use of highly heterogeneous environments (Côté et al. 91
2009; Côté et al. 2014; Daverat and Tomás 2006; Gagnaire et al. 2012). The objective of our
92
study was to test if the current spatial patterns of early size-at-age of yellow Anguilla sp. in these
93
two systems are consistent with the current paradigm of higher early growth rates of eels growing
94
in habitats more saline and/or less distant from the Sargasso Sea spawning area. Early growth 95
rates of yellow eels were compared within species among habitats more or less saline and/or 96
distant from the Sargasso Sea, using back-calculated length from 1 to 5 years old. Then, we
97
carried out linear mixed effect models for each site including random effects to account for
98
possible inter-cohort’s variation in lengths and individual random effects. Finally, the early
size-99
at-age of American and European eels were compared with historical data to examine the
100
temporal evolution of eel early growth in recent years.
101 102
Materials and methods
103
The St. Lawrence Estuary is one of the largest and most productive ecosystems in Canada
104
(Dufour and Ouellet 2007). It is 5 times longer and 9.5 times wider than the Gironde Estuary
105
(GE) (Fig. 1 and Table S1). The GE is one of the largest estuaries in Western Europe and it
106
originates from the confluence of two freshwater rivers, the Garonne and the Dordogne rivers, at
107
the Bec d’Ambès. Both systems are composed of marine, brackish and freshwater sections (Fig.
108
1).
109
For each hydrographical system during early summer in 2011 and 2012, a total of 120
110
yellow eels were collected at 4 sites along brackish and freshwater sections (Table 1). Our
111
scientific collector permits restricted the number of fish to 30 eels per site because of their
112
threatened status, a major constraint of this study. As further constraint, fish were captured in two
113
different years (15 eels per site per year) due to the low abundance of eels in several sites and the
114
requirement of our sampling design for selecting specific size ranges (see below). In Quebec, eels
115
were captured in two fluvial lakes, St. François Lake (SFL) and St. Pierre Lake (SPL) located in
116
the freshwater section and in the mouth of two freshwater tributaries of the Estuary and the Gulf
117
of St. Lawrence respectively, the Sud-Ouest River (SOR) and St. Jean River (SJR), (Fig. 1a and
118
Table 1). SFL and SPL are shallow freshwater fluvial lakes near Montréal in an urbanized and
119
industrialized region (Béguer-Pon et al. 2015; Hodson et al. 2014). Previous studies have shown
120
that the estimated average transit times of the upstream migration of early life stages of eels
121
between the Gulf and these lakes are 3 years and 5-6 years for SPL and SFL respectively (G.
122
Verreault, unpublished data; Benchetrit et al. 2017). Yellow eels from SOR and SJR typically
123
arrive at about 1 to 2 Years old (Y) and grow in running freshwater habitats, which are tributaries
124
opening into a brackish estuary (G. Verreault, unpublished data).
125
In France, eels were captured in two freshwater rivers, the Dordogne (DOR) and Garonne
126
(GAR) Rivers, one brackish site, the Gironde estuary (GIR) with a salinity gradient moving up
127
and downstream as a function of both tide and freshwater discharge (Larrose et al. 2010) and one
128
salt marsh site, Certes (CER). This site is located in the Certes marsh connected to the Arcachon
129
basin, a nearby coastal environment not influenced by water from the Gironde watershed (Fig. 1b
130
and Table 1). The GIR site is known to be contaminated by anthropic and agricultural activities
131
(Delpech et al. 2010; Tableau et al. 2013). The DOR site is considered as the least contaminated
132
site in the watershed and the GAR site is located near the city of Bordeaux in a contaminated
133
region (Tapie et al. 2011). The DOR and GAR sites are located in the tidally influenced part of
134
the rivers. In contrast to A. rostrata from the St. Lawrence system, the estimated transit time of A. 135
anguilla elvers from the coast to their growth habitat is very short, an average of 2-3 weeks to 136
reach the GAR and DOR sites (Beaulaton and Castelnaud 2005). 137
European and American yellow eels were captured using trap nets (mesh size of 6.4 mm),
138
trawl (mesh size of 31 mm) and electro-fishing by professional fishers or technical staff (Table
139
1). In 2011 and 2012, all eels were from a single capture in one day, except for SOR and SJR
140
sites in Quebec where eels were captured in two days due to a small sample the first day. Based
141
on existing information according to Nilo and Fortin (2001), yellow eels from a pre-defined size
142
were targeted, in order to have the same range of ages (5-10 years old) for all sites. In Quebec,
143
the selected fish ranged between 495 to 655 mm in length and in France, the selected fish ranged
144
between 433 to 578 mm. After each capture, eels were kept in tanks with aerated water from the
145
site for few hours until processing.
146 147
Morphometric measurements and tissue sampling
148
American and European eels were processed using the same standardized protocols in 149
France and in Quebec. Total body length (± 1 mm) and total body mass (± 0.1 g) were measured 150
and then eels were killed by decapitation. Eel manipulations were made in agreement with 151
approved protocols from animal ethics committees in both countries. Sex (undifferentiated: U;
152
Male: M; Female: F) was determined by macroscopic observation of the gonads using previously
153
described criteria (Jones and Sinha 1966). Based on calculated gonadal and pectoral fin indices
154
(Durif et al. 2000; Durif et al. 2009), all eels retained were immature yellow eels.
155 156
Otolith processing
157
Sagittal otoliths were extracted, cleaned with distilled water, dried and stored in plastic 158
Eppendorf tubes at ambient room temperature until processing. Otoliths were processed for age 159
determination according to Verreault et al. (2009) using a five-stage procedure: 1) cleaning with 160
sodium hypochlorite (2.5%) and rinsing with demineralized water and drying with ethanol 161
(70%); 2) embedding in epoxy resin (24h); 3) sanding on 800-grit paper and polishing with 162
aluminium oxide powder (1µm); 4) etching with EDTA solution, and finally; 5) staining with 163
0.01% toluidine blue. Otoliths were observed with a binocular microscope (60X) under 164
transmitted light for aging. 165
166
Back-calculation of length
167
Back calculation was undertaken using a relationship between body size and otolith radius 168
(Francis 1990). The biological intercept procedure proposed by Campana (1990) uses a 169
biologically-determined intercept in the back-calculation equation using the mean size of the 170
body and the otolith at the elver stage. This method is robust to any variations in the fish-otolith 171
relationship and provided from Tremblay (2009). Back-calculated body length (Lt) at age t are
172
calculated as follows: 173
Lt = Lc + (Lc - Lbi) x (Ot - Oc) / (Oc - Obi) 174
where Ot is the measured otolith radius at age t, Lc and Oc are the body length and otolith radius
175
at capture, respectively, and Lbi and Obi are the body length and otolith radius at the biological
176
intercept, respectively. Measurements of the radius (mm) of the tth annuli (Rt), which is the
177
distance from the elver mark (the first growth check outside the nucleus from where continental 178
age determination commences) of the otolith to the tth annuli (meaning: Ot - Obi) and of the radius
179
(mm) of the otolith at capture (R), which is the distance from the elver mark of the otolith to the 180
edge (Oc - Obi). These measurements were always made along the longest axis on the ventral side
181
of the sagittae of the otolith. In this study, the mean total body length of elvers when they recruit 182
to coasts (Lbi) was set to 67 mm (SD=4.5), for A. anguilla and 62 mm (SD=3.2) for A. rostrata,
183
which corresponds to the age 0 year old or continental age (ICES 2009; Lambert et al. 2003). 184
185
Statistical analyses
186
Statistical analyses were conducted using Prism v. 5.0 (GraphPad Software Inc., San 187
Diego, CA, USA) and R (R. 2011). Mixed models were fitted using the package lme4 (Horton et 188
al. 2011) and Tukey tests were carried out using package multcomp (Bates et al. 2014). For all 189
statistical tests, a probability of p≤0.05 was considered significant. It was not possible to collect 190
same-sized eels at each sampling site. To increase the comparability of eels among sampling 191
sites, only eels between 2 and 20 years old were considered in this analysis. The total number of
192
eels retained for statistical analyses were 102 in 2011 and 112 in 2012 (Tables 2 and 3).
193
Most analyses were conducted for each country/species separately. Firstly, biological
194
characteristics of eels at capture were statistically compared among sites within a species and
195
year. For each year, data normally distributed (using the Shapiro-Wilk test) were compared with
196
one-way ANOVA followed by a Tukey’s multiple comparison test. Data not normally distributed
197
was compared among sites using non-parametric Kruskal-Wallis test (KW) followed by the
198
Dunn's multiple comparison test. The relative proportions of female and undifferentiated eels
199
were compared among sites or between sampling years in each country using a Chi-square test. 200
To compare size among sites within systems for eels of the same age, back-calculated
201
lengths from 1 to 5 Years old (Y) were compared among sites within a species using the KW test
202
as described above. Then, we carried out linear mixed effect models for each site including
203
random effects to account for possible inter-cohort variations in length and individual random
204
effects. First, we fitted a linear mixed effect model for each site to assess whether length at 1Y
205
significantly differed among sites:
206
(1) L1~Site + (1|cohort)
207
with L1, the length-at-age at 1Y, Site, the site of capture and (1|cohort), a random effect to
208
account for possible inter-cohort variations in length. Tukey multiple comparison tests were then
209
carried out to detect significant differences among sites.
210
A second analysis was performed to check whether growth rates were different among
211
sites. We first computed yearly growth increments for each fish, i.e. the difference in
back-212
calculated lengths between two successive ages. Growth increments are a linear function of initial
213
length when fish follow a Von Bertalanffy growth curve (i.e. It=Lt-Lt-1=(L∞-Lt-1)•(1-exp(-K))
214
with It, the growth increment between year t-1 and year t, Lt the size-at-age at age t, K the Brody
215
coefficient and L∞ the asymptotic length). In view of this, we fitted a generalized linear mixed
216
model on growth increments for each species separately:
217
(2) It~Site+Lt-1+(1|eel) +(1|cohort)
218
with It, the vector of yearly growth increments (we used the 4 increments for each from 1Y to
219
5Y) and Lt-1, the vector containing the corresponding initial length. We added a cohort random
220
effect to account for inter-cohort differences and an individual random effect since each eel was
221
considered 4 times in the analysis. We used a gamma family distribution to account for
222
dissymmetry in growth increment distributions (DeLong et al. 2001; Drouineau et al. 2008), with
223
an identity link to preserve the linear relationship. Similarly, to the first model, we carried out
224
Tukey multiple tests to compare yearly growth increments among sites.
225 226
Results
227
Eel biological characteristics in the St. Lawrence and Gironde systems
228
For A. anguilla sampling, male eels were removed due to small sample size (n=3 in the 229
Gironde system) and for A. rostrata sampling, no males have been detected (n=0 in the St.
230
Lawrence system). In 2011 and 2012, body length and age of A. anguilla from the Gironde
231
system ranged from 278 to 825 mm and from 3 to 18 years old respectively, and differed among
232
sites (H=38.5, p<0.0001 in 2011 and H=12.8, p=0.005 in 2012 for body length; H=33.8,
233
p<0.0001 in 2011 and H=25.3, p<0.0001 in 2012 for age, Tables 2 and 3). Eels from DOR were
234
smaller and lighter than eels captured in GAR, GIR and CER with median body length and body
235
mass 1.3 and 2.8 times lower, respectively (H=37.7, p<0.0001 in 2011 and H=21.8, p<0.0001 in
236
2012 for body mass, Tables 2 and 3). In both sampling years, the proportions of undifferentiated
237
eels increased from the salt marsh habitat (CER) to freshwater habitats and the highest 238
proportions of undifferentiated eels were observed in DOR and GAR (Tables 2 and 3). No
239
significant difference was observed in biological characteristics between female and 240
undifferentiated European eels in GAR and DOR (Student t-test, Tables S2). 241
In the St. Lawrence system, the body length and age of A. rostrata captured in 2011 and 242
2012 ranged from 265 to 963 mm and from 5 to 19 years old respectively and both parameters 243
differed among sites (F=174.0, p<0.0001 in 2011 and H=41.5 p<0.0001 in 2012, for body length
244
and F=13.1, p<0.0001 in 2011 and H=6.1, p<0.0001 in 2012 for age, Tables 2 and 3). Eels from
245
SOR were consistently smaller and lighter than eels from SPL and SFL (H=44.4, p<0.0001 in
246
2011 and H=40.7, p<0.0001 in 2012, for body mass, Tables 2 and 3). In 2011, body length and
247
age were higher in eels from SPL and SFL compared to SJR (Table 2). In 2011 and 2012, body
248
mass was higher in SPL and SFL than in SJR (Tables 2 and 3). 249
In 2011, yellow eels captured in the Quebec sites were older than those sampled in France 250
(U=357.5, p<0.0001, Mann Whitney test).
251 252
Comparison of back-calculated length at age 1Y to 5Y of eels from different habitats in
253
each species
254
In the Gironde system, at 1Y, back-calculated lengths of eels sampled in the salt marsh 255
CER site (median of 219 mm) were higher than those of eels sampled in the estuarine GIR site 256
and in the fluvial GAR and DOR sites (medians were respectively 152, 136 and 134 mm, 257
H=51.4, p<0.0001, Fig. 2a and Table S3). At 2Y, back-calculated lengths of eels from the 258
estuarine GIR site became higher than those of eels from fluvial GAR and DOR sites and the 259
difference was maintained until 5Y (F=51.2, p<0.0001 for 2Y; F=48.7, p<0.0001 for 3Y; F=30.6,
260
p<0.0001 for 4Y and F=16.7, p<0.0001 for 5Y, Fig. 2a). From 2Y to 5Y, eels from the marine 261
CER site had the higher median of back-calculated length compared to the other sites and eels 262
from GAR and DOR sites remained with the lowest median of back-calculated length (Fig. 2a). 263
In the St. Lawrence system, at 1Y, back-calculated lengths of eels captured in fluvial SPL 264
and SFL sites (with a median length of 184 and 171 mm respectively) were higher than those of 265
eels from the estuarine SOR and SJR sites (with a median length of 134 and 142 mm 266
respectively, (F=31, p<0.0001, Fig. 2b and Table S3). The significant difference between higher 267
back-calculated length of eels from SPL and SFL and lower back-calculated length of eels from 268
SOR and SJR was maintained until 5Y (H=46.4, p<0.0001 for 2Y; H=50.2, p<0.0001 for 3Y;
269
F=31.2, p<0.0001 for 4Y and F=40.6, p<0.0001 for 5Y, Fig. 2b and Table S3). 270
271
Linear mixed effect models 272
In both years, for A. anguilla, this analysis confirmed that the length at age 1Y was higher 273
in CER than in any other site. Length at age 1Y in GIR was slightly higher than in DOR, and no 274
difference was observed between GAR and DOR. This confirmed the decreasing gradient in 275
length at age 1Y from downstream to upstream habitats (Table 4). For A. rostrata, length at age 276
1Y was higher in the two upstream lakes than in downstream rivers but no differences were 277
detected between the two lakes or between the two rivers (Table 4). 278
Results were rather similar regarding subsequent growth-increments (Table 5): increments 279
were higher in downstream sites than in upstream sites for A. anguilla, although CER and GIR 280
did not differ. Yearly growth increments from 1Y to 5Y were consistently higher in the two 281
upstream lakes than in downstream rivers for A. rostrata. 282
283
Discussion
284285
This study confirms that the current spatial pattern of early growth rates of yellow A.
286
anguilla in the Gironde system is consistent with the paradigm of higher early growth rates of 287
eels growing in habitats more saline and/or less distant from the Sargasso Sea spawning area.
288
Moreover, comparisons with historical data in the Gironde system indicate that this spatial
289
pattern remains stable despite temporal variation in the overall growth rates. In contrast, our
290
study reveals that early growth rates of yellow A. rostrata in the St. Lawrence system are highest
291
in eels captured in the less saline habitats, more distant from the Sargasso Sea, in contradiction
292
with the current paradigm. This new information is useful to guide further studies on the
293
mechanisms leading to the different ecotypes of Atlantic eels in different rearing habitats.
294 295
Spatial variations in early back-calculated length in Anguilla anguilla
296
At 1Y, eels from the salt marsh site CER had higher back-calculated length than eels from
297
the estuarine site GIR and from the fluvial sites GAR and DOR. From 2Y to 5Y, while eels from
298
CER maintained their higher back-calculated length, eels from the estuarine site GIR displayed
299
an increasingly faster growth rate with higher back-calculated length than those of eels from
300
freshwater sites. These results are consistent with previous studies, which demonstrated that eels
301
sampled in brackish habitats grew faster than those from riverine freshwater habitats.
302
Specifically, Daverat and Tomás (2006) have reached similar conclusions on the spatial
303
variations of early growth rates of eels sampled in 2001-2004 in the Gironde system. Since the
304
transit time of A. anguilla glass eels from the coast to their growth habitat was estimated to last 2-305
3 weeks according to Beaulaton and Castelnaud (2005), it is likely that their growth was already
306
influenced by the characteristics (biological, chemical and/or physical) of the selected habitat at
307
the age of 1Y. However, laboratory (Edeline et al. 2007) and genetic studies (Pujolar et al. 2005) 308
in A. anguilla suggest that the ecotypic differences among eels occupying different habitats are 309
not only the effect of phenotypic plasticity. They may also be caused by functional genetic 310
differences resulting from intra-generational spatially varying selection and/or genotype-311
dependent habitat choice (or both) of ecologically divergent habitats (Pavey et al. 2015). 312
At 1Y, no significant difference in length was detected between eels from the estuarine 313
site GIR and eels from the freshwater sites GAR and DOR. This observation could be related to a 314
high within-site inter-individual variability in back-calculated length. One factor of variability is 315
the older age of some of the eels sampled in GIR and GAR. However, results of analyses using a 316
linear mixed model integrating individual variability and cohort effect were consistent with the 317
results of the KW test indicating these sources of variability had no significant impact on the 318
results. Overall these data and the similarity with the pattern described a decade earlier by 319
Daverat and Tomás (2006) indicate a very consistent spatial pattern of higher growth at an early 320
age (from 1Y to 5Y) in yellow eels sampled in the more saline site (CER) compared to eels 321
sampled in the upstream fluvial section of the Gironde system. 322
323
Spatial variations in early back-calculated length in Anguilla rostrata
324
Anguilla rostrata sampled in the fluvial freshwater sites (SPL and SFL) in the Upper St. 325
Lawrence River had a higher back-calculated length from 1Y to 5Y compared to same-aged A.
326
rostrata sampled downstream in tributaries opening into a brackish estuary (SJR and SOR). In 327
our study, the difference in back-calculated length in A. rostrata sampled in the upstream St.
328
Lawrence system and those sampled in downstream tributaries was present as early as 1Y. At this 329
early age, A. rostrata of the fast-growing group (LSP, LSF) have not yet reached their growing 330
habitat. It is likely that they were still migrating in the St. Lawrence system and therefore their
331
growth rate could not yet be influenced by the local conditions in the fluvial lakes (Benchetrit et
332
al. 2017). 333
The higher back-calculated length at 1Y of eels from the upstream portion of the St.
334
Lawrence system compared to more downstream populations that we report here contrasts with 335
recent literature. Based on previous studies on A. rostrata captured in the Gulf of St. Lawrence 336
and in tributaries of the marine portion of the St. Lawrence system, a slower growth at 1Y was
337
expected with increasing distance of the capture sites from the Sargasso Sea (Boivin et al. 2015). 338
A common garden experiment by Côté et al. (2009) suggested a genetic basis for growth 339
differences among A. rostrata early life stages from different geographical locations. They found 340
that A. rostrata elvers from the Mira River (Nova Scotia; shortest distance to the Sargasso Sea) 341
grew faster than those from Grande-Rivière-Blanche (Québec, longest distance to the Sargasso 342
Sea), a result confirmed by the study of Boivin et al. (2015). Molecular tools were used to 343
support the hypothesis that life-history traits of A. rostrata were influenced by spatially variable 344
genetic selection along latitudinal gradients of temperature and/or increasing distance from the 345
Sargasso Sea and by genotype-dependent habitat choice (Boivin et al. 2015; Côté et al. 2009; 346
Gagnaire et al. 2012; Pavey et al. 2015). Moreover, glass eels of A. rostrata from New 347
Brunswick and Nova Scotia sites (which are closer to the Sargasso Sea) translocated to Lake 348
Ontario exhibited faster annual growth and matured at smaller sizes and ages at reproductive 349
migration than wild migrating silver eels from Lake Ontario (Couillard et al. 2014; Stacey et al. 350
2014; Verreault et al. 2010). Despite some limitations in fish samplings, our study clearly 351
demonstrates an inverse pattern of early growth rate from 1Y to 5Y for A. rostrata with fast 352
growing eels reaching the upstream St. Lawrence system and slow growing eels remaining in the
353
downstream section. These observations question our current understanding of eels adaptation to 354
environmental heterogeneity (Mateo et al. 2016). 355
356
Similarities between A. anguilla and A. rostrata and comparisons with previous studies
357
This study is the first to use a common methodology to compare the back-calculated 358
length of the yellow stage of the two species of Atlantic eels. Given the wide range of habitats 359
covered in this study (a larger hydro-geographical scale associated with longer upstream 360
migration of early life stages, longer distance to the Sargasso Sea for Gironde system eels and 361
different temperature regimes for the two river systems), we found that from 1Y to 5Y, the back-362
calculated length of A. rostrata collected in the St. Lawrence system in the northern part of their
363
distribution range presented some similarities with values from A. anguilla collected in the 364
Gironde system. The back-calculated length of A. rostrata from the upper St. Lawrence system
365
(SPL and SFL) was similar to that of eels from the downstream sites GIR (at 2Y and 3Y) and 366
CER (at 4Y and 5Y). From 1Y to 5Y, the back-calculated length of eels from the downstream St.
367
Lawrence system sites, SJR and SOR, were comparable to those of slow-growing eels from the 368
upstream sites GAR and DOR. Our study highlighted an inverse pattern of early growth rate 369
according to the upstream-downstream gradient of the location of habitats between A. rostrata 370
with faster growers from the upstream section of the St. Lawrence system and A. anguilla with
371
faster growers from the downstream section of the Gironde system. 372
In our study, median of back-calculated length at 1Y and 5Y of A. anguilla collected in 373
the Gironde in 2011-2012 (Table S3) were approximately twice those observed in eels captured 374
10 years earlier in the same sites in the Gironde system by Daverat and Tomás (2006). This 375
suggests an improvement in growth performance possibly related to abiotic factors (salinity, 376
temperature, productivity and habitat quality) and/or biotic factors (low density of eels, weak 377
coastal recruitment of glass eels) (Bonhommeau et al. 2008; Daverat et al. 2012; Knights 2003). 378
Despite the observed changes in growth performance in A. anguilla, the spatial pattern of early 379
growth rate did not change with time. However, the back-calculated length at 5Y of slow growing 380
A. rostrata collected in SJR in 2011-2012 are similar to those calculated for yellow eels captured 381
at the same site in 2004 by Thibault et al. (2007). These data suggest that, at least for the SJR site, 382
no significant change in growth rate up to 5Y has occurred in the last 7-8 years. Unfortunately, to 383
our knowledge, no historic data for early GR of yellow eels collected in the upper part of the St.
384
Lawrence system is available for comparison. 385
386
Limitations and future directions
387
The unique biology of eels, and especially their panmictic nature, the variability in their 388
migratory patterns during their growth phase and their large distribution ranges from tropical to 389
subarctic climates, makes their study a challenge in any circumstance. Population declines and 390
severe restrictions on commercial and scientific collection impose further difficulties. Sampling 391
sites in this international study were selected according to salinity, metal and organic 392
contamination gradients found in sediments and biota along the Saint Lawrence and the Gironde 393
systems (Laporte et al. 2016). Nevertheless, these sites cannot be considered to represent fairly 394
the wide range of habitats that the species occupy. Some limitations related to the sampling of 395
eels (30 eels captured in each site and in two years and the use of different fishing gear adapted to 396
each habitat) and the wide range of estimated age (2 to 18 years) may constitute biases. 397
In addition to spatially variable selection and/or genotype-dependant habitat choice, 398
several other processes could contribute to the observed growth variability in 1Y-old eels, 399
including epigenetic changes, early environment influences with carry-over effects on growth and 400
interactions between genotype and environment through phenotypic plasticity. A reduction in the 401
abundance of glass eels arriving in continental habitats associated with the low density of eels in 402
their growth habitats could have contributed to increase their length at early age (Castonguay et 403
al. 1994; Moriarty and Dekker 1997). Temporal variations in hatching times (Kuroki et al. 2017) 404
and in environmental conditions during development (Jonsson and Jonsson 2014) could also 405
affect early growth rates and behaviour. The season in which glass eels arrived on the continental 406
coasts may also affect their size (Desaunay and Guerault 1997). Local environmental factors such 407
as tidal height, water temperature, water discharges and the difference in temperatures between 408
estuarine and river habitats are known to have effects on glass eel’s abundance and upstream 409
migratory behavior of migrants (Jessop 2003; Edeline et al. 2006). In addition, physiological 410
traits of eels such as body condition, endocrine system (thyroid hormones) and health status may 411
affect the locomotor activity, the migratory behavior and growth performance (Edeline et al. 412
2005b; Lefebvre et al. 2013). Further studies are needed on the interactions between genetic 413
variation and phenotypic plasticity in response to environmental variation during early 414
development of Atlantic eels and their impact on migration patterns and later-life history 415
performance. For that purpose, longer term studies focussing on variations of growth and 416
behaviour of 0-1 Y eels in relation to genotypes and/or environmental factors are recommended, 417
with larger sample sizes and greater number of sites. 418
In spite of these limitations, our study provides a new indication that for A. rostrata 419
sampled along the St. Lawrence system, faster growing individuals appear more likely to
420
colonize the head of the system than slower growing individuals. We have also highlighted that
421
the median of back-calculated length of A. anguilla at 1Y and 5Y is twice higher than that 422
reported 10 years earlier. Further studies and monitoring are clearly needed to test the hypothesis 423
of a possible increase of early growth rate in relation to the modifications of abiotic and biotic 424
factors and its consequences for age, length and lipid reserves at migration in A. anguilla and A. 425
rostrata. 426
Finally, whereas several studies have investigated the relationships between genetic 427
selection and growth rate characteristics of glass eels in A. rostrata, these studies are limited to 428
eels from tributaries of the lower St. Lawrence Estuary and Gulf and there is a need to confirm 429
these relationships in A. anguilla. Comparative studies of these two related Atlantic eel species 430
would help to better understand the relationship between differential growth rate, size-at-431
metamorphosis, lipid accumulation, sexual differentiation and their genetic and environmental 432
bases in these two species. This information would facilitate prediction of the effects of global 433
environmental changes on the recruitment of these two declining species. 434
435
Acknowledgments
436
The authors wish to acknowledge all the personnel of the INRS-ETE, UMR EPOC (university of 437
Bordeaux) and IRSTEA (Bordeaux-Cestas) who participated in the field sampling. We would 438
like to thank the technical staff from the Ministère des Forêts, de la Faune et des Parcs for otolith 439
expertise and for providing us with back-calculated length data. This work was supported by the 440
joint ANR Blanc (ANR-10-INTB-1704)-NSERC SGP grant IMMORTEEL and by the Aquitaine 441
region (GAGILAU and MICANG projects). The laboratory work of Géraldine Patey was in part 442
supported by Fisheries and Oceans Canada. 443
444
References
445 446
Avise, J.C. 2003. Catadromous eels of the North Atlantic: a review of molecular genetic findings 447
relevant to natural history, population structure, speciation, and phylogeny. In Eel biology. 448
Springer. pp. 31-48. 449
Bates, D., Mächler, M., Bolker, B., and Walker, S. 2014. Fitting linear mixed-effects models 450
using lme4. Journal of Statistical Software 67(1): 1-48. doi:10.18637/jss.v067.i01. 451
Beaulaton, L., and Castelnaud, G. 2005. The efficiency of selective tidal stream transport in glass 452
eel entering the Gironde (France). Bulletin Français de la Pêche et de la Pisciculture(378-379): 453
5-21. 454
Béguer-Pon, M., Castonguay, M., Benchetrit, J., Hatin, D., Legault, M., Verreault, G., Mailhot, 455
Y., Tremblay, V., and Dodson, J.J. 2015. Large-scale, seasonal habitat use and movements of 456
yellow American eels in the St. Lawrence River revealed by acoustic telemetry. Ecology of 457
Freshwater Fish 24(1): 99-111. 458
Belpaire, C., Goemans, G., Geeraerts, C., Quataert, P., Parmentier, K., Hagel, P., and De Boer, J. 459
2009. Decreasing eel stocks: survival of the fattest? Ecology of freshwater fish 18(2): 197-460
214. 461
Benchetrit, J., Béguer-Pon, M., Sirois, P., Castonguay, M., Fitzsimons, J., Dodson, J.J. 2017. 462
Using otolith microchemistry to reconstruct habitat use of American eels Anguilla rostrata in 463
the St. Lawrence River-Lake Ontario system. Ecology of Freshwater Fish. 26: 19-33. 464
Boivin, B., Castonguay, M., Audet, C., Pavey, S., Dionne, M., and Bernatchez, L. 2015. How 465
does salinity influence habitat selection and growth in juvenile American eels Anguilla 466
rostrata? Journal of fish biology 86(2): 765-784. 467
Bonhommeau, S., Chassot, E., Planque, B., Rivot, E., Knap, A.H., and Le Pape, O. 2008. Impact 468
of climate on eel populations of the Northern Hemisphere. Marine Ecology Progress Series 469
373: 71-80.
470
Cairns, D.K., Secor, D.A., Morrison, W.E., and Hallett, J.A. 2009. Salinity-linked growth in 471
anguillid eels and the paradox of temperate-zone catadromy. J Fish Biol 74(9): 2094-2114. 472
Campana, S.E. 1990. How reliable are growth back-calculations based on otoliths? Canadian 473
Journal of Fisheries and Aquatic Sciences 47(11): 2219-2227. 474
Castonguay, M., Hodson, P., Couillard, C., Eckersley, M., Dutil, J.-D., and Verreault, G. 1994. 475
Why is recruitment of the American eel, Anguilla rostrata, declining in the St. Lawrence 476
River and Gulf? Canadian journal of fisheries and aquatic sciences 51(2): 479-488. 477
Cosewic. 2012. Assessment and status report on the American eel Anguilla rostrata in Canada. 478
Committee on the Status of Endangered Wildlife in Canada. Ottawa. p. xii + 109. 479
Côté, C., Castonguay, M., Verreault, G., and Bernatchez, L. 2009. Differential effects of origin 480
and salinity rearing conditions on growth of glass eels of the American eel Anguilla rostrata: 481
implications for stocking programmes. Journal of Fish Biology 74(9): 1934-1948. 482
Côté, C.L., Castonguay, M., Kalujnaia, M.S., Cramb, G., and Bernatchez, L. 2014. In absence of 483
local adaptation, plasticity and spatially varying selection rule: a view from genomic reaction 484
norms in a panmictic species (Anguilla rostrata). BMC Genomics 15: 403. 485
Couillard, C.M., Verreault, G., Dumont, P., Stanley, D., and Threader, R.W. 2014. Assessment of 486
Fat Reserves Adequacy in the First Migrant Silver American Eels of a Large-Scale Stocking 487
Experiment. North American Journal of Fisheries Management 34(4): 802-813. 488
Daverat, F., Beaulaton, L., Poole, R., Lambert, P., Wickström, H., Andersson, J., Aprahamian, 489
M., Hizem, B., Elie, P., and Yalçın‐Özdilek, S. 2012. One century of eel growth: changes 490
and implications. Ecology of Freshwater Fish 21(3): 325-336. 491
Daverat, F., and Tomás, J. 2006. Tactics and demographic attributes in the European eel Anguilla 492
anguilla in the Gironde watershed, SW France. Marine Ecology Progress Series 307: 247- 493
257. 494
Dekker, W. 2003. Status of the European eel stock and fisheries. In Eel Biology. Springer. pp. 495
237-254. 496
DeLong, A.K., Collie, J.S., Meise, C.J., and Powell, J.C. 2001. Estimating growth and mortality 497
of juvenile winter flounder, Pseudopleuronectes americanus, with a length-based model. 498
Canadian Journal of Fisheries and Aquatic Sciences 58(11): 2233-2246. 499
Delpech, C., Courrat, A., Pasquaud, S., Lobry, J., Le Pape, O., Nicolas, D., Boët, P., Girardin, 500
M., and Lepage, M. 2010. Development of a fish-based index to assess the ecological quality 501
of transitional waters: the case of French estuaries. Marine Pollution Bulletin 60(6): 908-918. 502
Desaunay, Y., and Guerault, D. 1997. Seasonal and long‐term changes in biometrics of eel 503
larvae: a possible relationship between recruitment variation and North Atlantic ecosystem 504
productivity. Journal of fish biology 51(sA): 317-339. 505
Drouineau, H., Mahevas, S., Bertignac, M., and Fertin, A. 2008. Assessing the impact of 506
discretisation assumptions in a length-structured population growth model. Fisheries Research 507
91(2): 160-167.
508
Dufour, R., and Ouellet, P. 2007. Estuary and Gulf of St. Lawrence marine ecosystem overview 509
and assessment report. Canadian Technical Report Fishery Aquatic Sciences 2744E vii + 112 510
p.
511
Durif, C., Élie, P., Dufour, S., Marchelidon, J., and Vidal, B. 2000. Analyse des paramètres 512
morphologiques et physiologiques lors de la préparation à la migration de dévalaison chez 513
l’anguille européenne (Anguilla anguilla) du lac de Grand-Lieu (Loire-Atlantique). Cybium 514
24(3): 63-74.
515
Durif, C.M., van Ginneken, V., Dufour, S., Müller, T., and Elie, P. 2009. Seasonal evolution and 516
individual differences in silvering eels from different locations. In Spawning migration of the 517
European eel. Springer. pp. 13-38. 518
Edeline, E., Dufour, S., and Elie, P. 2005a. Role of glass eel salinity preference in the control of 519
habitat selection and growth plasticity in Anguilla anguilla. Marine Ecology Progress Series 520
304: 191-199.
521
Edeline, E., Bardonnet, A., Bolliet, V., Dufour, S., and Elie, P. 2005b. Endocrine control of
522
Anguilla anguilla glass eel dispersal: effect of thyroid hormones on locomotor activity and 523
rheotactic behavior. Hormones and Behavior. 48: 53-63.
524
Edeline E., Lambert P., Rigaud C., and Elie P. 2006. Effects of body condition and water
525
temperature on Anguilla anguilla glass eels migratory behavior. Journal of Experimental
526
Marine Biology and Ecology 331: 217-225.
527
Edeline, E., Beaulaton, L., Le Barh, R., and Elie, P. 2007. Dispersal in metamorphosing juvenile 528
eel Anguilla anguilla. Marine Ecology Progress Series 344: 213-218. 529
FAO/ICES. 2009. FAO European Inland Fisheries Advisory Commission; International Council 530
for the Exploration of the Sea. Report of the 2008 session of the Joint EIFAC/ICES Working 531
Group on Eels. EIFAC Occasional paper(No. 43): 192pp 532
Francis, R.I.C.C. 1990. Back-calculation of fish length: a critical review. Journal of Fish Biology 533
36(6): 883-902.
534
Gagnaire, P.-A., Normandeau, E., Côté, C., Hansen, M.M., and Bernatchez, L. 2012. The genetic 535
consequences of spatially varying selection in the panmictic American eel (Anguilla rostrata). 536
Genetics 190(2): 725-736. 537
Geeraerts, C., and Belpaire, C. 2010. The effects of contaminants in European eel: a review. 538
Ecotoxicology 19(2): 239-266. 539
Hodson, P.V., Norris, K., Berquist, M., Campbell, L.M., and Ridal, J.J. 2014. Mercury 540
concentrations in amphipods and fish of the Saint Lawrence River (Canada) are unrelated to 541
concentrations of legacy mercury in sediments. Science of the Total Environment 494: 218-542
228. 543
Horton, G.E., Letcher, B.H., and Kendall, W.L. 2011. A multistate capture-recapture modeling 544
strategy to separate true survival from permanent emigration for a passive integrated 545
transponder tagged population of stream fish. Transactions of the American Fisheries Society 546
140(2): 320-333.
547
ICES. 2009. Workshop on Age Reading of European and American Eel (WKAREA) 20-24 April 548
2009, Bordeaux, France. ICES CM 2009\ ACOM: 2048. 2066 pp. 549
Jacoby, D.M., Casselman, J.M., Crook, V., DeLucia, M.-B., Ahn, H., Kaifu, K., Kurwie, T., 550
Sasal, P., Silfvergrip, A.M., and Smith, K.G. 2015. Synergistic patterns of threat and the 551
challenges facing global anguillid eel conservation. Global Ecology and Conservation 4: 321-552
333. 553
Jessop B.M. 2003. Annual variability in the effects of water temperature, discharge, and tidal
554
stage on the migration of American eel elvers from estuary to river. In: Dixon DA (ed)
555
Biology, management, and protection of catadromous eels. American Fisheries Society
556
Symposium 33: 3-16
557
Jessop, B., Shiao, J., Iizuka, Y., and Tzeng, W. 2007. Effects of inter-habitat migration on the 558
evaluation of growth rate and habitat residence of American eels Anguilla rostrata. Marine 559
Ecology Progress Series 342: 255-263. 560
Jessop, B.M. 2010. Geographic effects on American eel (Anguilla rostrata) life history 561
characteristics and strategies. Canadian Journal of Fisheries and Aquatic Sciences 67(2): 326-562
346. 563
Jones, V.R.P., and Sinha, J.W. 1966. On the sex and distribution of the freshwater eel (Anguilla 564
anguilla). Journal of Zoology 150(3): 371-385. 565
Jonsson, B., and Jonsson, N. 2014. Early environment influences later performance in fishes.
566
Journal of Fish Biology 85: 151–188.
567
Knights, B. 2003. A review of the possible impacts of long-term oceanic and climate changes and 568
fishing mortality on recruitment of anguillid eels of the Northern Hemisphere. Science of the 569
total Environment 310(1): 237-244. 570
Kuroki, M., Marohn, L., Wysujack, K., Miller M., J., Tsukamoto, K., Hanel, R. 2017. Hatching
571
time and larval growth of Atlantic eels in the Sargasso Sea. Marine Biology 164(5): 1-7.
572
Lambert, P., Sbaihi, M., Rochard, E., Marchelidon, J., Dufour, S. and Elie, P. 2003.Variabilités
573
morphologique et du taux d’hormone de croissance des civelles d’anguilles européennes dans
574
l’estuaire de la Gironde au cours de la saison 1997-1998. Bulletin Français de la Pêche et de la
575
Pisciculture 368: 69–84.
576
Laporte, M., Pavey, S.A., Rougeux, C., Pierron, F., Lauzent, M., Budzinski, H., Labadie, P.,
577
Geneste, E., Couture, P., Baudrimont, M. 2016. RAD sequencing reveals within generation
578
polygenic selection in response to anthropogenic organic and metal contamination in North
579
Atlantic Eels. Molecular Ecology. 25: 219-237.
580
Larrose, A., Coynel, A., Schäfer, J., Blanc, G., Massé, L., and Maneux, E. 2010. Assessing the 581
current state of the Gironde Estuary by mapping priority contaminant distribution and risk 582
potential in surface sediment. Applied Geochemistry 25(12): 1912-1923. 583
Lefebvre F, Fazio G, Mounaix B, Crivelli AJ. 2013 Is the continental life of the European eel 584
Anguilla anguilla affected by the parasitic invader Anguillicoloides crassus? Proceeding of the 585
Royal Society B 280: 2012-2916. 586
Mateo, M., Lambert, P., Tétard, S., Castonguay, M., Ernande, B., and Drouineau, H. 2016. Cause 587
or consequence? Exploring the role of phenotypic plasticity and genetic polymorphism in the 588
emergence of phenotypic spatial patterns of the European eel. Canadian Journal of Fisheries 589
and Aquatic Sciences(in press). 590
Miller, M.J., Feunteun, E., and Tsukamoto, K. 2016. Did a “perfect storm” of oceanic changes 591
and continental anthropogenic impacts cause northern hemisphere anguillid recruitment 592
reductions? ICES Journal of Marine Science: Journal du Conseil 73(1): 43-56. 593
Moriarty, C., and Dekker, W. 1997. Management of the European eel. Fisheries Bulletin, Vol. 15, 594
The Marine Institute. Dublin, Ireland, pp.110 595
Nilo, P., and Fortin, R. 2001. Synthèse des connaissances et établissement d'une programmation 596
de recherche sur l'anguille d'Amérique (Anguilla rostrata). Université du Québec à Montréal, 597
département des sciences biologiques pour la Société de la faune et des parc du Québec, 598
direction de la recherche sur la faune, la Société. Québec. 298 p. 599
Pavey, S.A., Gaudin, J., Normandeau, E., Dionne, M., Castonguay, M., Audet, C., and 600
Bernatchez, L. 2015. RAD Sequencing Highlights Polygenic Discrimination of Habitat 601
Ecotypes in the Panmictic American Eel. Current Biology 25(12): 1666-1671. 602
Pujolar, J., Maes, G., Vancoillie, C., and Volckaert, F. 2005. Growth rate correlates to individual 603
heterozygosity in the European eel, Anguilla anguilla L. Evolution 59(1): 189-199. 604
R Development Core Team. 2011. R: A Language and Environment for Statistical Computing. 605
Available online at: http://www. R-project. org/. 606
Stacey, J.A., Pratt, T.C., Verreault, G., and Fox, M.G. 2014. A caution for conservation stocking 607
as an approach for recovering Atlantic eels. Aquatic Conservation: Marine and Freshwater 608
Ecosystems 25: 569-580. 609
Svedäng, H., and Wickström, H. 1997. Low fat contents in female silver eels: indications of 610
insufficient energetic stores for migration and gonadal development. Journal of Fish Biology 611
50(3): 475-486.
612
Tableau, A., Drouineau, H., Delpech, C., Pierre, M., Lobry, J., Le Pape, O., Breine, J., and 613
Lepage, M. 2013. A fish-based index of estuarine ecological quality incorporating information 614
from both scientific fish survey and experts knowledge. Ecological indicators 32: 147-156. 615
Tapie, N., Le Menach, K., Pasquaud, S., Elie, P., Devier, M.H., and Budzinski, H. 2011. PBDE 616
and PCB contamination of eels from the Gironde estuary: from glass eels to silver eels. 617
Chemosphere 83(2): 175-185. 618
Tesch, F., and Rohlf, N. 2003. Migration from continental waters to the spawning grounds. In Eel 619
Biology. Springer. pp. 223-234. 620
Thibault, I., Dodson, J.J., Caron, F., Tzeng, W., Iizuka, Y., and Shiao, J. 2007. Facultative 621
catadromy in American eels: testing the conditional strategy hypothesis. Marine Ecology 622
Progress Series 344: 219-229. 623
Tremblay, V. 2009. Reproductive strategy of female American Eels among five subpopulations 624
in the St. Lawrence River watershed. In eels at the edge: science, status, and conservation 625
concerns. American Fisheries Society, Symposium, pp. 85-102. 626
Van Ginneken, V.J., and Van den Thillart, G.E. 2000. Physiology: Eel fat stores are enough to 627
reach the Sargasso. Nature 403(6766): 156-157. 628
Vélez-Espino, L.A., and Koops, M.A. 2009. A synthesis of the ecological processes influencing 629
variation in life history and movement patterns of American eel: towards a global assessment. 630
Reviews in Fish Biology and Fisheries 20(2): 163-186. 631
Verreault, G., Dargere, W., and Tardif, R. 2009. American eel movements, growth, and sex ratio 632
following translocation. In eels at the edge: science, status, and conservation concerns. 633
American Fisheries Society, Symposium, pp. 129-136. 634
Verreault, G., Dumont, P., Dussureault, J., and Tardif, R. 2010. First record of migrating silver 635
American eels (Anguilla rostrata) in the St. Lawrence Estuary originating from a stocking 636
program. Journal of Great Lakes Research 36(4): 794-797. 637
638 639
1
Table 1. Characteristics of sampling sites in France and in Quebec.
FRANCE (A. anguilla) QUEBEC (A. rostrata)
Site DOR GAR GIR CER SFL SPL SOR SJR
Latitude (°N) 44°54’30” 44°43’51” 45°12’23” 44°41’18” 48°51’40” 48° 21’ 17” 46°19’50” 45°09’18” Longitude (°W) 0°15’01” 0°28’05” 0°43’13” 1°1’39” 64°28’47” 68°45’28” 72°32’06” 74°23’04” Sampling period (month and years) June 2011 May 2012 June 2011 May 2012 June 2011 May 2012 May 2011 May 2012 June 2011 May 2012 June 2011 June 2012 July 2011 June 2012 June 2011 June 2012
Fishing gear Trap nets Trap nets Trawl Trap nets Trap nets
Electro-fishing Trap nets Trap nets Habitat 1 (Salinity) FW FW BW BW FW FW BW FW Mean length at silvering (mm) 752 a 698 a 660 a 660 a 958 b 958 b 1043 b 520 b Mean age at silvering (years) >10 a >10 a >10 a >10 a 20 b 20 b 21 b 11 b Distance from the Sargasso Sea 2 (km) 5612 5616 5539 5500 5467 5245 4840 4480 1
FW = Freshwater; BW = Brackish water. Salinity values of each sampling site are detailed in Baillon et al. (2015).
2
Distance between the sampling sites and the Sargasso Sea spawning ground were estimated via the Google Earth web tool.
a
Reference: Tapie et al. (2011); b Reference: Jessop (2010).
2
Table 2. Biological characteristics for Anguilla anguilla and Anguilla rostrata for each sampling site in
2011. Values represent the median (Q1, Q3) of each biological variable (BL: Body Length; BM: Body Mass. Sex ratios are presented in % of the total number of eels within a site (Chi-square test). Different superscript lower case letters indicate statistically significant differences among sites within species (ANOVA or Kruskall Wallis).
2011
A. anguilla A. rostrata
Site DOR GAR GIR CER SFL SPL SOR SJR
N total (Females and undifferentiated) 13 14 15 11 15 7 15 15 Sex ratio (%): Female 62 86 100 100 100 100 100 100 Undifferentiated 38 a 14ab 0 b 0b 0 0 0 0 BL (mm) 325 c (302, 354) 434 b (393, 503) 565 a (530, 614) 440 b (395, 478) 832 a (801, 856) 894 a (876, 929) 323 c (290, 382) 535 b (465, 606) BM(g) 51 c (39, 69) 127 b (103, 202) 300 a (249, 424) 128 b (102, 167) 1254 a (1147, 1298) 1565 a (1435, 1642) 50 c (32, 92) 275b (172, 440) Age (year) 5 b (4, 5) 6 b (5, 7) 8 a (8, 12) 5 b (4, 5) 12a (12, 13) 13 a (11, 16) 8 b (7, 10) 10 a (8, 12)
3
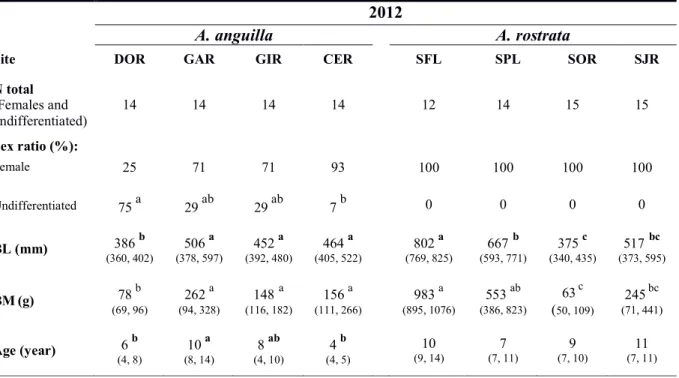
Table 3. Biological characteristics for Anguilla anguilla and Anguilla rostrata for each sampling site in
2012. Values represent the median (Q1, Q3) of each biological variable (BL: Body Length; BM: Body
Mass). Sex ratios are presented in % of the total number of eels within a site (Chi-square test). Different superscript lower case letters indicate statistically significant differences among sites within species (ANOVA or Kruskall Wallis).
2012
A. anguilla A. rostrata
Site DOR GAR GIR CER SFL SPL SOR SJR
N total (Females and undifferentiated) 14 14 14 14 12 14 15 15 Sex ratio (%): Female 25 71 71 93 100 100 100 100 Undifferentiated 75 a 29 ab 29 ab 7 b 0 0 0 0 BL (mm) 386 b (360, 402) 506 a (378, 597) 452 a (392, 480) 464 a (405, 522) 802 a (769, 825) 667b (593, 771) 375 c (340, 435) 517bc (373, 595) BM(g) 78 b (69, 96) 262 a (94, 328) 148a (116, 182) 156 a (111, 266) 983 a (895, 1076) 553 ab (386, 823) 63c (50, 109) 245bc (71, 441) Age (year) 6 b (4, 8) 10 a (8, 14) 8 ab (4, 10) 4 b (4, 5) 10 (9, 14) 7 (7, 11) 9 (7, 10) 11 (7, 11)
4
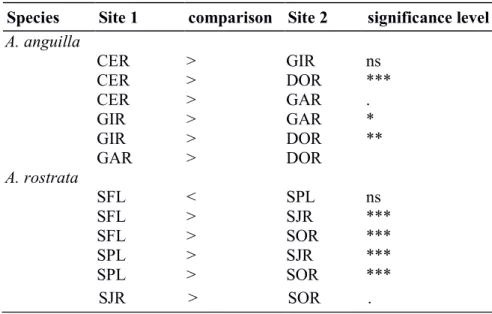
Table 4: Tukey multiple comparisons tests on the site effects in the linear mixed models on length-at-age 1. Statistical significance codes: ≤ 0.00001 ‘***’; ≤ 0.001 ‘**’; ≤ 0.01 ‘*’; ≤ 0.05 ‘.’; ≤ 0.1 ‘ns’
Species Site 1 comparison Site 2 significance level
A. anguilla CER > GIR *** CER > DOR *** CER > GAR *** GIR > GAR . GIR > DOR * GAR > DOR ns A. rostrata SFL > SPL ns SFL > SJR *** SFL > SOR *** SPL > SJR *** SPL > SOR *** SJR > SOR
5
Table 5: Tukey multiple comparisons tests on the site effects in the linear mixed models on growth increments. Statistical significance codes: ≤ 0.00001 ‘***’; ≤ 0.001 ‘**’; ≤ 0.01 ‘*’; ≤ 0.05 ‘.’; ≤ 0.1 ‘ns’
Species Site 1 comparison Site 2 significance level
A. anguilla CER > GIR ns CER > DOR *** CER > GAR . GIR > GAR * GIR > DOR ** GAR > DOR A. rostrata SFL < SPL ns SFL > SJR *** SFL > SOR *** SPL > SJR *** SPL > SOR *** SJR > SOR .
1 (a) 2 (b) 3 4 75°00’W 70°00’W 65°00’W 48°00’N 46°00’N Montreal Quebec Rimouski CANADA UNITED' STATES T St./Lawrence/River/ Fresh/water St.'Lawrence'Estuary' Brackish'
water Marine'water
Gulf'of'St.'Lawrence Marine'Water l i mi t of t i de i nf l uence St François Sud - Ouest River Limit of tidal influence (SJR) (SOR) (SPL) (SFL)
Figure 1. Study areas and sampling sites for (a) yellow eels captured in Quebec (North
5
Eastern Canada) and (b) yellow eels captured in the Gironde region (South West France) 6
showing the separation into 3 salinity sectors (freshwater, brackish and marine sectors). Black 7
squares refer to sampling sites and black circles refer to the closest cities. The symbols (★) 8
indicate the limits of tidal influence. The map was made using QGIS project, a free and open 9
source geographic information system (www.qgis.org). 10
SFL SPL SOR SJR 0 50 100 150 200 250 300 350 400 450 500 550 600 650 700 750 800 1 year old Fluvial Estuarine (30) (30) (21) (26) b b a a B a c k -c a lc u la te d l e n g th ( m m ) SFL SPL SOR SJR 0 50 100 150 200 250 300 350 400 450 500 550 600 650 700 750 800 2 years old (30) (30) (21) (26) b b a B a c k -c a lc u la te d le n g th ( m m ) a SFL SPL SOR SJR 0 50 100 150 200 250 300 350 400 450 500 550 600 650 700 750 800 3 years old (30) (30) (21) (26) b b a a B a ck -c a lc u la te d l e n g th ( m m ) SFL SPL SOR SJR 0 50 100 150 200 250 300 350 400 450 500 550 600 650 700 750 800 4 years old (30) (30) (21) (26) b b a a B a c k -c a lc u la te d l e n g th ( m m ) 0 50 100 150 200 250 300 350 400 450 500 550 600 650 700 750 800 5 years old (30) (30) (21) (26) b b a a B a c k -c a lc u la te d l e n g th ( m m )
DOR GAR GIR CER
0 50 100 150 200 250 300 350 400 450 500 550 600 650 700 750 800 River Estuarine Coastal b b b a (27) (28) (29) (24) 1 year old B a c k c a lc u la te d l e n g th ( m m )
DOR GAR GIR CER
0 50 100 150 200 250 300 350 400 450 500 550 600 650 700 750 800 c c b a (27) (28) (29) (24) 2 years old B a c k c a lc u la te d l e n g th ( m m )
DOR GAR GIR CER 0 50 100 150 200 250 300 350 400 450 500 550 600 650 700 750 800 c c b a (27) (28) (29) (24) 3 years old B a c k c a lc u la te d l e n g th ( m m )
DOR GAR GIR CER
0 50 100 150 200 250 300 350 400 450 500 550 600 650 700 750 800 c c b a (25) (28) (27) (19) 4 years old B a c k c a lc u la te d l e n g th ( m m ) 0 50 100 150 200 250 300 350 400 450 500 550 600 650 700 750 800 c c b a (16) (26) (25) (11) 5 years old B a c k c a lc u la te d l e n g th ( m m )
a)
b)
Anguilla anguillaAnguilla anguilla Anguilla rostrata