Multivariate Monitoring of Individual Anode Current
Signals for Anodic Incident Detection
Mémoire
David Lajambe
Maîtrise en génie chimique - avec mémoire
Maître ès sciences (M. Sc.)
Résumé
L’aluminium est produit industriellement grâce à l’électrolyse. Ce procédé a lieu dans une cuve d’électrolyse et il consiste à injecter un courant électrique pour transformer l’oxyde d’aluminium en aluminium métallique et en dioxyde de carbone. Les anodes permettent le passage du courant à travers la cuve et fournissent également le carbone nécessaire pour la réaction électrolytique. Un in-cident anodique se produit lorsqu’une déformation se développe sur la surface inférieure d’une anode ou lorsque l’anode est placée trop basse dans la cuve, ce qui cause un court-circuit partiel à la position de l’anode affectée. Les incidents anodiques ont un impact négatif sur l’efficacité du courant de la cuve. La détection et la correction hâtives des incidents anodiques sont donc avantageuses d’un point de vue économique. L’objectif de cette étude est de concevoir un système qui est capable de détecter les incidents anodiques en temps réel, et ce plus rapidement que la technique standard actuelle. Pour ce faire, l’Analyse en Composantes Principales a été utilisée pour entraîner des modèles prédictifs dé-veloppés à partir des signaux individuels de courant d’anodes et du signal de voltage de la cuve, dans le but de classifier les anodes selon l’erreur de prédiction au carré et la statistique T2 de Hotelling. Cette stratégie semble permettre de détecter des incidents anodiques grâce aux signaux individuels de courant. Toutefois, ce n’est pas le cas avec le signal de voltage de la cuve. La surveillance de la moyenne ou l’écart-type des signaux de courant à haute fréquence à l’aide d’un modèle de régression logistique semble aussi faciliter la détection des incidents anodiques.
Abstract
Aluminum metal is produced industrially in electrolysis cells, in which an electric current is used to transform aluminum oxide into metallic aluminum and carbon dioxide. Anodes are used to carry the current across the electrolysis cells and provide the carbon source necessary to drive the electrolytic reaction forward. Anodic incidents occur when an anode develops a spike or other deformation on its bottom surface or when the anode is set too low in the cell, causing the electrolysis cell to partially short circuit at the affected anode position. Anodic incidents have a deleterious effect on the cell’s current efficiency, making early detection and correction of anodic incidents economically advanta-geous. The objective of this study is to develop a real-time anodic incident detection system capable of identifying problematic anodes faster than the standard contemporary technique. Principal Compo-nent Analysis models were trained with individual anode current signals and cell voltage signals, and were subsequently used to classify anodes according to the squared prediction error and Hotelling’s T2statistic. This strategy appears to enable anodic incident detection with individual anode current signals, but not with the cell voltage signal. Monitoring the signal mean and standard deviation of high-frequency anode current signals with a logistic regression model also appears to facilitate anodic incident detection.
Contents
Résumé ii
Abstract iii
Contents iv
List of Tables vi
List of Figures vii
Introduction 1
0.1 Aluminum Industry . . . 1
0.2 Aluminum Production . . . 2
0.3 Hall-Héroult Process . . . 2
0.4 Cell Control . . . 6
0.5 Prebaked Carbon Anodes . . . 11
0.6 Anode Replacement Cycle . . . 13
0.7 Conclusion . . . 15
1 Deleterious Anode Events 16 1.1 Anode Effects . . . 16 1.2 Anodic Incidents . . . 17 1.3 Detection . . . 22 1.4 Conclusion . . . 26 2 Project Description 27 2.1 Problem Context . . . 27 2.2 Objectives . . . 27 2.3 Methodology . . . 28 2.4 Conclusion . . . 29
3 Data Collection and Preprocessing 30 3.1 Data Description . . . 30
3.2 Trajectory Construction . . . 31
3.3 Data Partitioning . . . 34
3.4 High-Frequency Data . . . 34
3.5 Conclusion . . . 39
4.1 Multivariate Classification . . . 40
4.2 Principal Component Analysis . . . 41
4.3 Batch Principal Component Analysis. . . 47
4.4 Conclusion . . . 49
5 Multivariate Classification 51 5.1 Trajectory Classification . . . 51
5.2 Classical Performance Metrics . . . 52
5.3 Model Profit . . . 55
5.4 Detection System Hyperparameters . . . 58
5.5 Control Limit Optimization . . . 59
5.6 Conclusion . . . 60
6 Results and Discussion 61 6.1 Anodic Incident Analysis . . . 61
6.2 Current Trajectory Analysis. . . 63
6.3 Voltage Trajectory Analysis. . . 80
6.4 High-Frequency Anodic Incident Detection . . . 85
6.5 Plant Trial . . . 102
6.6 Dual-Model Anodic Incident Detection System . . . 107
6.7 Conclusion . . . 108
Conclusions 109
List of Tables
3.1 Total number of anodes available for analysis using a 4-day trajectory duration . . . 33
3.2 Summary of anodes for which high-frequency signals were extracted . . . 39
4.1 Example data for calculation of empirical evolving T2limits . . . 49
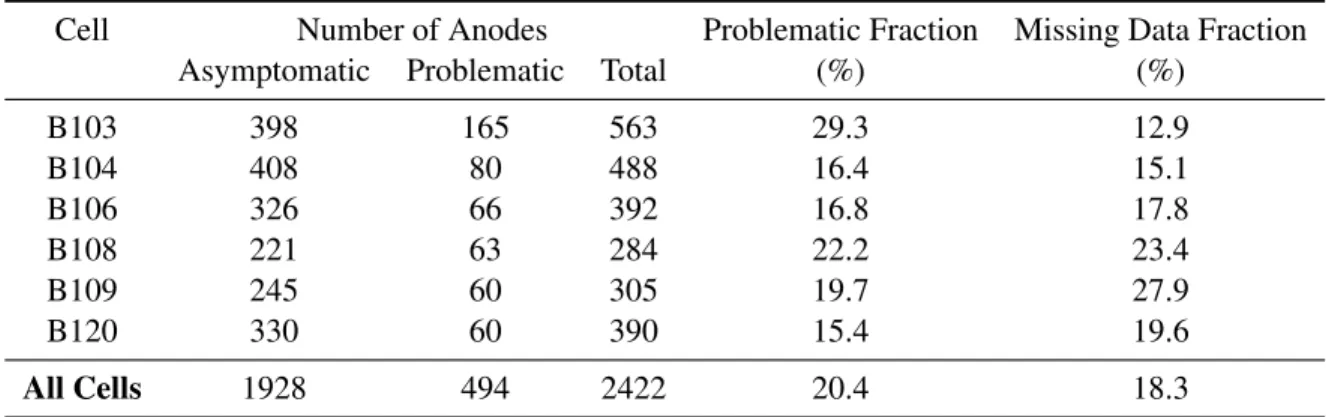
6.1 Anodic incident data by cell . . . 61
6.2 Overall current trajectory model prediction performance by component . . . 64
6.3 Current trajectory model prediction performance by cell for asymptomatic anodes . . 65
6.4 Current trajectory detection criteria performance summary . . . 70
6.5 Current trajectory skill fraction by system configuration . . . 72
6.6 Skill fraction by cell using the GMGL configuration . . . 73
6.7 Optimal model Profit and detection antecedence comparison . . . 77
6.8 Mean jackknifing detection antecedence by cell with the GMGL system . . . 79
6.9 Overall voltage trajectory model prediction performance by component . . . 81
6.10 Voltage trajectory detection criteria performance summary . . . 84
6.11 Univariate statistics for different segment types . . . 92
6.12 High-frequency classical performance metrics by classification criterion . . . 95
6.13 Summary of high-frequency segments used in the Anode 15 case study. . . 100
List of Figures
0.1 Cross-sectional schematic of a modern aluminum electrolysis cell. . . 3 0.2 Examples of resistance curves for a fictitious cell. Cell resistance varies as a function
of the alumina concentration and the anode-cathode distance (ACD). . . 7 0.3 The anode beam can be moved upwards or downwards to increase or decrease the
anode-cathode distance. . . 8 0.4 Control strategy for cell resistance using the anode beam position as the manipulated
variable. . . 8 0.5 Example of the control strategy used to control cell resistance with the anode bridge
position. . . 9 0.6 Hypothetical resistance curve and associated resistance time series plot for a tightly
controlled electrolysis cell. . . 10 0.7 Control band modification following an anode replacement at time = 8 hours. A
sam-ple resistance signal is shown. . . 11 0.8 Layout of a cell (B103) at the Deschambault smelting facility. Anode position labels
are the same for all cells. . . 12 0.9 Examples of individual anode current trajectories taken from pot B120 at the
De-schambault smelter. . . 14 1.1 Examples of spikes on fresh (top), middle-age (middle), and mature (bottom) anodes.
Source: Aluminerie Alcoa. . . 18 1.2 The three phases of spike development. If left unchecked, spikes eventually come into
contact with the aluminum pad, resulting in a short-circuit at the affected anode. . . . 19 1.3 Anode-cathode distance before and after the development of a spike. . . 19 2.1 Flowchart showing the 6-step process used to build and utilize the anodic incident
detection system. . . 29 3.1 Individual current data matrix organized in trajectory format. Each row contains a
single trajectory belonging to a single anode. . . 32 3.2 Visual representation of the random data partitioning process.. . . 35 3.3 Current signal segment data matrix following a Discrete Fourier Transform. Each row
contains the amplitudes of the frequency channels for a single current signal segment. 38 4.1 Visual representation of the matrices used in PCA. . . 41 4.2 Example of using the current deviations approach to fill missing data after time = 2
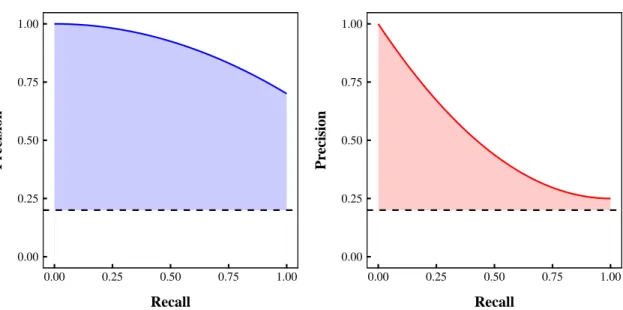
days in the original space (left) and centered and scaled space (right). . . 48 5.1 Example precision-recall curves for two hypothetical classifiers. . . 54 5.2 Area under the precision-recall curve for two hypothetical classifiers.. . . 54
6.1 Histogram of anodic incident detection time by operators. . . 62
6.2 Fraction of anodic incidents detected by operators according to anode service time. . 63
6.3 Mean asymptomatic and problematic anode current trajectories. . . 64
6.4 Loading plots for the current trajectory PCA model. . . 66
6.5 Examples of problematic current trajectories. . . 67
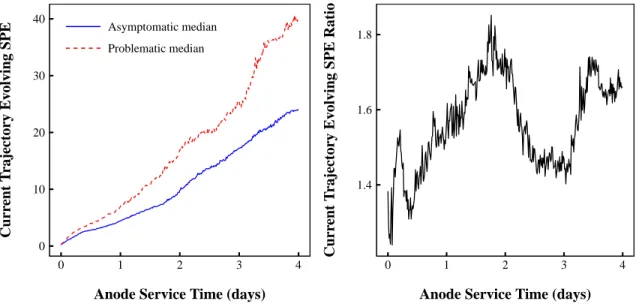
6.6 Median evolving SPE for problematic and asymptomatic current trajectories. . . 68
6.7 Median evolving T2for problematic and asymptomatic current trajectories. . . 69
6.8 Current trajectory-based precision-recall curves for both detection criteria. . . 70
6.9 Example of an anodic incident detected using the evolving SPE criterion. . . 71
6.10 Current trajectory-based precision-recall curves for different detection system config-urations using the evoling SPE criterion. . . 72
6.11 Current trajectory-based precision-recall curves by cell using a global model and global limits. . . 74
6.12 Detection antecedence comparison for different detection system configurations.. . . 75
6.13 Model profit comparison for different detection system configurations. . . 76
6.14 Histograms of model profit obtained with different system configurations. . . 78
6.15 Histogram of model profit by cell obtained with a global model and global limits. . . 78
6.16 Mean asymptomatic and problematic cell voltage trajectories.. . . 80
6.17 Loading plots for the voltage trajectory PCA model. . . 82
6.18 Median evolving SPE for problematic and asymptomatic voltage trajectories. . . 83
6.19 Median evolving T2for problematic and asymptomatic voltage trajectories. . . 84
6.20 Voltage trajectory-based precision-recall curves for different detection criteria. . . 85
6.21 Mean asymptomatic and problematic anode current spectra.. . . 86
6.22 Loading plots obtained with current spectrum PCA models. . . 87
6.23 SPE vs T2plots obtained with anode current spectrum PCA models using 60-minute current segments. . . 87
6.24 SPE vs T2 plots obtained with anode current spectrum PCA models using 1-minute current segments and omitting power spectrum scaling. . . 89
6.25 Example of a 1-minute segment spectrum divided into three bands of equal width . . 89
6.26 Comparison of asymptomatic and problematic AUC at various band counts. . . 90
6.27 Percentage difference between asymptomatic and problematic AUC at various band counts.. . . 91
6.28 Example current segments at anode position 27. . . 93
6.29 Boxplots of segment mean, standard deviation, and logistic regression output by seg-ment class.. . . 95
6.30 High-frequency univariate precision-recall curves for different logistic regression in-put variables. . . 97
6.31 Threshold plot obtained with mean-based logistic regression and all partitions. . . 98
6.32 Anodic incident probability obtained for multiple segments taken from different points in Anode 15’s service life. . . 100
6.33 60-minute signal and anodic incident probabilities for Anode 15 extracted at the 15.1-day mark. . . 101
6.34 End-of-life anodes at position 20 (left) and 19 (right) in cell B108 on day 2 of the plant trial. . . 105
6.35 Estimated anodic incident probability over time for Anode 19 using the mean-based and standard deviation-based classifiers. . . 106
6.36 Estimated anodic incident probability over time for Anode 20 using the mean-based and standard deviation-based classifiers. . . 106
A.1 Histograms of model profit by cell obtained with a global model and separate limits
for each cell.. . . 113 A.2 Histograms of model profit by cell obtained with separate models and limits for each
Introduction
This chapter explains the fundamental notions of aluminum electrolysis and carbon anodes required to understand the objectives and methodology of this study. The chapter begins with a brief overview of the aluminum industry and general aluminum production practices. This overview is followed by a detailed description of the modern aluminum electrolysis process, the control system used to ensure stable operation, and carbon anodes.
0.1
Aluminum Industry
The aluminum industry is the second largest industry in the province of Quebec by revenue and sup-port 30 000 jobs in total, including 10 000 jobs in primary aluminum smelting [1]. These jobs are spread across 7 primary aluminum production plants, including Aluminerie Alcoa in Deschambault, whose electrolysis process and data are the object of this study. The transformation component of the aluminum industry supports the majority of the remaining jobs which are distributed among 1400 businesses across 17 different regions of the province of Quebec.
The global aluminum industry is growing at a rapid pace relative to that of other metals, having maintained an average growth rate of 5% over the past 20 years [1]. Demand growth is expected to be sustained in both developing and developed countries. In the developing world, aluminum will be needed to meet the demands of continued investment in transportation networks and infrastructure. China has recognized this opportunity and has increased its production tremendously in response; between 2004 and 2014 its share of global production rose from 22% to 52% [1]. In the developed world, aluminum is expected to slowly replace steel as the primary metal for car manufacturing due to the environmental benefits associated with its lower density, such as improved fuel efficiency. The combination of the above factors make the sustained competitiveness of Quebec’s aluminum industry of particular economic interest. Process improvements to the aluminum production process resulting in reduced marginal costs or improved environmental performance will have a direct impact on the capacity of Quebec’s aluminum industry to take advantage of these opportunities and remain competitive in light of the threat of aluminum imports from developing countries.
0.2
Aluminum Production
Aluminum is never found in nature in its elemental form due to its strong tendency to bond with oxygen to form aluminum oxide, which is commonly referred to as alumina [2]. The aluminum pro-duction process therefore begins with the mining of bauxite ore which is the main source of aluminum oxide. Australia, China, Guinea, Brazil, and India produce 86% of the world’s bauxite, but significant and largely untapped reserves can be found in Vietnam and Jamaica [3].
To produce aluminum metal from aluminum oxide, the aluminum must be dissociated from the oxy-gen to which it is bound. This is known as primary aluminum production. Secondary aluminum production involves using recycled aluminum products as a raw material and is not considered in this study. The industrialization of primary aluminum production was not possible until 1886 when Charles Martin Hall and Paul Louis Toussaint Héroult independently discovered that aluminum oxide could be dissociated by dissolving it in a bath of sodium and fluoride ions and running an electric current through the resultant solution in a process known as electrolysis [4]. Before this breakthrough aluminum had only ever been isolated in small quantities through chemical processes unsuitable for industrial scale production [4]. When combined with the electrical furnace designed several years earlier by Eugene Cowles, Alfred Cowles, and Charles Bradley, the Hall-Héroult process enabled cost-effective industrial scale aluminum production to commence. This resulted in a 96.7% drop in the price of aluminum over the seven years following its industrialization which unlocked aluminum’s potential to be used in a variety of applications for which it had never before been considered due to its prohibitve production cost [4].
The primary aluminum smelting industry has since undergone a series of technological advances and process improvements which have culminated in the complex, multi-stage process used today. The modern aluminum production process can be grouped into three main steps [5]. In the first step, aluminum oxide is isolated from the bauxite ore in which is it found in nature through the Bayer process. In the second step the aluminum oxide is dissociated through the Hall-Héroult process described in Section0.3. The third step involves casting the molten aluminum into useful forms so that it can be reworked into final products by the downstream transformation industry.
0.3
Hall-Héroult Process
Of the three stages of aluminum production, the Hall-Héroult process entails the greatest energy con-sumption and has the most significant environmental impact due its inherent generation of carbon dioxide. The objective of the Hall-Héroult process is to produce aluminum metal from aluminum oxide. The process can be summarized by the overall chemical reaction shown below:
2 Al2O3+ 3 C
electricity
−−−−−→ 3 CO2+ 4 Al (1)
This reaction is endothermic and therefore requires a continuous supply of energy in order to progress. Because the reaction is electrolytic, the driving force of the reaction is electricity. The theoretical
en-ergy consumption is 6.4 kWh per kilogram of aluminum produced whereas the current industrial average and best-in-class performance are 15 and 13 kWh per kilogram, respectively [6]. The large gap between the theoretical and actual energy consumption figures is a result of heat loss, poor oper-ation, and deleterious process events such as anode effects and anodic incidents, all of which reduce the energy efficiency of the Hall-Héroult process. Efforts to minimize the impact of these contributing factors will bring a smelting plant closer to the theoretical energy consumption value by making it more cost-efficient. The considerable influence of the Hall-Héroult process on the production costs of an aluminum smelter make it an attractive target for process improvement initiatives.
The Hall-Héroult process involves a series of intermediate chemical reactions whose net result is the reaction presented in Equation1. Two raw materials are required: alumina, which is a processed and powdered form of aluminum oxide, and carbon, which is supplied in solid form by carbon anodes. The process occurs in an electrolysis cell, which is a reactor whose purpose is to facilitate the intermediate chemical reactions required to produce metallic aluminum. They are also commonly referred to as pots in industry. A schematic of an electrolysis cell is shown in Figure0.1. The main component of
Cryolite bath
Molten aluminum
Cathode
Collector bar
Bath crust
Alumina
source
Electric current
Al
CO
2Anode stem
Anode
Anode
Figure 0.1: Cross-sectional schematic of a modern aluminum electrolysis cell.
an electrolysis cell is a bath of cryolite, which is a conductive electrolyte whose purpose is to allow electricity to flow across the bath and to enable the alumina powder to dissolve. The bath is held at a temperature of 950 °C to ensure that it remains in a liquid state [6]; if the bath solidifies the current
stops flowing and aluminum production halts. The second major component of an electrolysis cell is a set of carbon anodes which are suspended in the bath. The anodes serve a dual purpose. First, they facilitate the flow of electricity across the bath. Second, they act as the carbon source required in the overall electrolysis reaction.
The Hall-Héroult process is initiated by feeding alumina into the electrolytic bath where it rapidly dissolves due to the presence of cryolite. The dissolution process cannot be explained by a single chemical equation; evidence suggests that multiple dissolution mechanisms exists and occur in parallel with one another [2]:
4 AlF63−+ Al2O3−−→ 3 Al2OF84− (2)
4 AlF63−+ Al2O3−−→ 3 Al2OF62−+ 6 F− (3) 2 AlF63−+ 2 Al2O3−−→ 3 Al2O2F42− (4) 6 F−+ 2 AlF63−+ 2 Al2O3−−→ 3 Al2O2F64− (5) Once dissolved, the aluminum and oxygen ions are free to form new chemical bonds with other species in the bath. The oxygen is highly electronegative and reacts with the carbon constituting the positively charged anodes to form carbon dioxide. Once again, there are several reaction paths possible [2]:
Al2O2F42−+ 4 F−+ C −−→ CO2+ 4 e−+ 2 AlF4− (6) Al2O2F64−+ 2 F−+ C −−→ CO2+ 4 e−+ 2 AlF4− (7) 2 Al2OF84−+ C −−→ CO2+ 4 e−+ 4 AlF4− (8) 4 F−+ 2 Al2OF62−+ C −−→ CO2+ 4 e−+ 4 AlF4− (9) All of the above reactions produce carbon dioxide and result in free electrons being released into the electrolyte bath. The gaseous carbon dioxide naturally rises to the top of the bath and is evacuated by a ventilation system. Fluorine vapours also evacuated from the cell by the ventilation system. The carbon anodes are consumed over time by this process and must be periodically replaced with fresh anodes, typically once every two to four weeks depending on the characteristics of the cell [6]. The final stage of the process is the precipitation of aluminum metal from the bath. There are two possible aluminum compounds which can dissociate to form aluminum metal, both of which exist in chemical equilibrium with one another in the bath [2]. The first is AlF63 –, which is first introduced into the bath as part of the cryolite mixture. The second is AlF4–, which is produced at the anode when carbon dioxide is formed. The two possible reactions are shown below:
AlF63−+ 3 e−−−→ Al + 6 F− (10)
AlF4−+ 3 e−−−→ Al + 4 F− (11)
This regenerates the fluoride ions consumed at the anode while producing molten aluminum metal. As implied by Equation1, cryolite is not consumed in the Hall-Héroult process; it is a catalyst that facilitates the process through its ability to dissolve aluminum oxide. However, a certain amount of
cryolite is lost over time due to evaporation and anode effects, which are discussed in Chapter 1, as well as carry-over during tapping, anode setting, and infiltration into the cell lining. The molten aluminum sinks to the bottom of the bath due to its higher density where it accumulates and forms a layer. This molten aluminum is periodically drawn from the bath through the tapping process. The aspirated aluminum is the final product of the Hall-Héroult process.
Aluminum production through electrolysis can be considered as both a continuous and batch process. It is continuous because aluminum production never ceases; an electrolysis cell constantly produces aluminum throughout its lifespan. However, the many discrete events comprising the Hall-Héroult process give it batch-like characteristics. Anode replacements occur on a regular schedule, resulting in repeated, predictable disturbances to the cell. Alumina is not fed constantly to the cells. Instead, the feed rate is manipulated cyclically based on the cell resistance. Finally, the tapping process results in final product being siphoned from the cell in batches rather than continuously.
The performance of the Hall-Héroult process is measured through a metric known as current effi-ciency, which is defined as follows:
C= p po
(12) In Equation12, C represents the current efficiency, the actual aluminum production rate is expressed by p, and porepresents the theoretical aluminum production rate. The actual production rate can be measured directly in the plant, whereas the theoretical production rate can be calculated in kilograms per second with Faraday’s law, where the molecular mass of aluminum is given by M, z represents the number of electrons transferred in the reduction reaction, and F is used as a proxy for Faraday’s constant [2]:
po= MI
zF (13)
The only variable in Equation13is I, which represents the line amperage. This implies that electrol-ysis cells operating at a higher amperage should theoretically produce more aluminum over a given time period.
In practice, electrolysis cells never operate at a current efficiency of 100%; the actual production rate is always less than the theoretical production rate. Typical current efficiency values range from 85% to 96% for the best smelters [7]. Some of the major factors that make 100% efficiency impossible are listed below [2]:
• Recombination reaction producing aluminum oxide and carbon monoxide - commonly referred to as the back-reaction in industry
• Aluminum losses during transfer • Losses through vaporization • Side reactions involving impurities
• Anode effects
• Short-circuiting due to anodic incidents • Electrical losses across the cell’s circuit
This study aims to minimize losses due to anodic incident, which have been shown to reduce current efficiency by up to 4% [8], and will therefore not explore the other possible causes listed in detail.
0.4
Cell Control
Modern aluminum smelting plants are controlled using on-line process control systems that seek to hold key process variables to a set point in order to ensure stable and efficient operation. In electrolysis cells, the overall line current and cell resistance are both controlled variables.
Line Current
Line current refers to the total current running through a single series of electrolysis cells. This current is essentially constant; aside from extreme events at the power source which could result in a significant drop in line current, the desired line current is always obtained and can be adjusted almost instantaneously; as such, the control system is not discussed here. At the Deschambault site, most cells operate at a line current of 387 kA.
Cell Resistance
Cell resistance is a measure of an electrolysis cell’s natural opposition to current flow. Controlling the cell resistance to a set point is therefore important to ensure efficient smelting operation; operating at an unnecessarily high cell resistance increases operating costs and can cause cell heat balance issues. Cell resistance is not a measured variable and must therefore be inferred through other variables. Typically, this is done by calculating the cell resistance using a modified version of Ohm’s law:
Rp=
V−Vext
I (14)
In Equation14, Rprepresents the calculated cell pseudo resistance, the measured cell voltage and line current are given by V and I, respectively, and Vext represents the intercept of the V versus I curve that is obtained for small changes in the line current near the operating point of the plant. It is set to a fixed value between 1.62 and 1.68 [2]. In the context of this study the distinction between cell resistance and cell pseudo resistance is not important; cell pseudo resistance is therefore referred to as cell resistance throughout the remainder of this dissertation.
Cell resistance is a complex function of many factors, such as the material properties and age of the cell, but only the concentration of alumina and the interpolar distance are used to control it. The alu-mina concentration refers to the amount of alualu-mina dissolved in the bath in mass percentage, whereas
the interpolar distance refers to the physical distance between the bottom of the anodes and the surface of the aluminum layer, which effectively acts as a cathode. This is also known as the anode-cathode distance (ACD). The relationship between these two factors and cell resistance is illustrated in Fig-ure0.2. Low ACD High ACD 6.5 7.0 7.5 8.0 0 2 4 6
Alumina Concentration (mass %)
Cell Resistance (micr
o ohms)
Figure 0.2: Examples of resistance curves for a fictitious cell. Cell resistance varies as a function of the alumina concentration and the anode-cathode distance (ACD).
In Figure0.2, optimal cell resistance is obtained for an alumina concentration of 3%; increasing or decreasing the alumina concentration from this point increases the cell resistance. The entire curve shifts when the ACD is changed; increasing the ACD increases the resistance for a given alumina concentration and the opposite is true when the ACD is decreased. The control strategy employed at modern aluminum smelters involves using both of these variables to ensure that the cell resistance remains in the desired range.
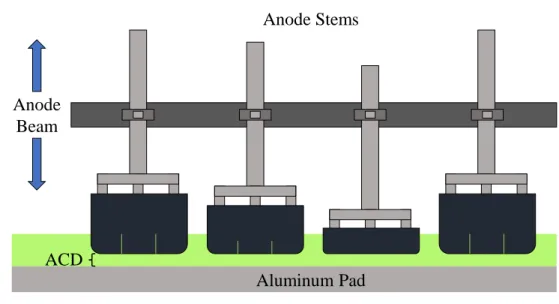
Anode Beam Position
Large variations and drifts in the cell resistance are corrected with a simple control loop in which the ACD is the manipulated variable. In modern smelters, anodes are positioned on an anode beam, as shown in Figure 0.3. Anodes are attached to the beam at the time of setting such that the steady-state ACD is as similar as possible at all anode positions. This minimizes differences in the local resistance from anode to anode, which results in an even distribution of current across all anode positions. Ideally, the ACD would be identical at all anode positions, but this is impossible to achieve in practice. The anode beam is mobile and can be raised and lowered remotely according to the needs of the cell. Doing so changes the ACD at all anode positions in the cell simultaneously. This feature allows the ACD to be used as a manipulated variable for controlling the cell resistance. Unlike typical
Anode Beam
Anode Stems
Aluminum Pad ACD
Figure 0.3: The anode beam can be moved upwards or downwards to increase or decrease the anode-cathode distance.
control systems, in this control loop the ACD is only manipulated if the cell resistance’s deviation from its set point exceeds a certain threshold (∆R), creating a dead zone in which the beam position is unresponsive to changes in cell resistance. The control diagram associated with this strategy is shown in Figure0.4. Dead Zone + – Rsp Anode Beam Cell R Resistance Controller Disturbances D + +
Figure 0.4: Control strategy for cell resistance using the anode beam position as the manipulated variable.
If the magnitude of the deviation of the cell resistance set point (Rsp) from the cell resistance (R) exceeds the permissible threshold (|Rsp− R| > ∆R), the anode beam is either raised or lowered in re-sponse. A positive deviation (Rsp− R > ∆R) causes the beam to be raised whereas a negative deviation (Rsp− R < −∆R) causes the bridge to be lowered. The degree to which the bridge is lowered or raised is proportional to the magnitude of the deviation. This strategy is shown graphically in Figure 0.5. The anode beam is only moved when the cell resistance exits the control band. Resistance fluctua-tions within the band are corrected by manipulating the alumina feed rate, which is explained in the
Anode beam lowered
Anode beam raised ● ● ● ● ● ● ● ● ● ● ● ● ● ● ● ● ● ● ● ● ● ● ● ● ● ● ● ● ● ● ● ● ● ● ● ● ● ● ● ● ● ● ● ● ● ● ● ● ● ● ∆R Rsp 5.0 5.5 6.0 6.5 7.0 0 5 10 15 20 25 Time (hours)
Cell Resistance (micr
o ohms)
Figure 0.5: Example of the control strategy used to control cell resistance with the anode bridge position.
following section.
Alumina Feed Rate
Cell resistance variations within the dead zone are addressed with the alumina feed rate, which is used to directly manipulate the alumina concentration in the bath. In the simplest possible case, there are two settings for the alumina feed rate: overfeed and underfeed. Overfeeding implies that alumina is being fed to the cell faster than it is being consumed by the electrolysis reaction, causing the alumina concentration to increase over time. Conversely, underfeeding implies an alumina feed rate lower than the consumption rate, causing the alumina concentration to fall over time. By switching between overfeeding and underfeeding, the alumina concentration can be manipulated to keep cell resistance near its optimal value.
Consider a hypothetical tightly controlled cell whose resistance curve and resistance signal are shown in Figure0.6. Initially, the cell is operating in underfeed mode at a resistance of approximately 6.2 micro ohms (point 1). The underfeeding causes the alumina concentration to drift lower over time as the operating point moves left on the resistance curve. At first, this causes the cell resistance to decrease over time; the slope of the resistance signal over time is therefore negative in this region (dRdt < 0). However, once the alumina concentration falls below 3% (point 4), the resistance begins to rise exponentially, causing the slope to change signs and increase over time (dRdt > 0). This is demonstrated by the sudden change of direction and rapid increase in the resistance between point 4 and point 5 in Figure0.6. Inferring the alumina concentration from the rate of change of the cell resistance is necessary because it currently not possible to measure the bath’s alumina concentration
● 1 ● 2 ● 3 ● 4 5 6 7 8 9 ● 10 Underfeeding ● Overfeeding 6.0 6.5 7.0 7.5 0 2 4 6
Alumina Concentration (mass %)
Cell Resistance (micr
o ohms) ● 1 ● 2 ● 3 ● 4 5 6 7 8 9 ● 10 Underfeeding Overfeeding 5.9 6.1 6.3 6.5 0.0 2.5 5.0 7.5 10.0 Time (hours)
Cell Resistance (micr
o ohms)
Figure 0.6: Hypothetical resistance curve and associated resistance time series plot for a tightly con-trolled electrolysis cell.
on-line.
The slope is typically used in modern smelters to switch from underfeeding to overfeeding; once the slope exceeds a certain value, the cell is put into overfeed mode to increase the alumina concentration. This causes the cell to switch into overfeed mode at point 5; the alumina feed rate is increased stepwise to increase the alumina concentration in the cell. Unlike the underfeed cycle, the overfeed cycle is generally fixed in duration to minimize the risk of forming sludge due to an excessive alumina concentration. Using a fixed overfeed duration minimizes the risk. Once the overfeed cycle duration has elapsed, the cell is put back into underfeed mode automatically regardless of the slope of the resistance signal. In the case of the cell presented in Figure0.6, the overfeed cycle is 5 hours long. Over this time, the alumina concentration increases, shifting the operating point right on the resistance curve and decreasing cell resistance over time. This trend reverses at point 8 once the minimum resistance point is exceeded. After the 5-hour overfeed duration has elapsed at point 10, the cell is put back into underfeed mode and the cycle begins anew. The alternation between the underfeed and overfeed cycles causes the cell resistance signal to oscillate.
Anode Changes
Anode changes increase the overall cell resistance temporarily; as explained in Section 0.6, this in-crease in resistance occurs naturally due to a freeze layer forming. The cell resistance set point is therefore increased step-wise during anode changes to prevent the control system from reacting to this natural increase in resistance. The set point is then gradually lowered back to its original value in the 9 hours following the replacement. This is shown graphically in Figure0.7.
Rsp R
Upper dead band
Lower dead band 5.6 5.8 6.0 6.2 6.4 6.6 0 5 10 15 20 25 Time (hours)
Cell Resistance (micr
o ohms)
Figure 0.7: Control band modification following an anode replacement at time = 8 hours. A sample resistance signal is shown.
When the anode replacement occurs at time = 8 hours in Figure 0.7, the resistance control band is shifted upwards to accommodate the increase in resistance. The oscillatory behaviour of the cell resistance signal continues after the anode replacement, but does not exceed the upper control limit due to the shift in the dead zone. This prevents an unnecessary beam position adjustment from being executed at time = 9 hours. The control band is then gradually shifted back to its original position as the cell resistance stabilizes around the original set point.
0.5
Prebaked Carbon Anodes
Carbon anodes are rectangular blocks formed by baking calcinated coke held together by a coal tar pitch binder. They provide the carbon source needed to produce aluminum through electrolysis and also serve as a conductor which facilitates the flow of current through the cell. Electrolysis cells normally contain at least 20 anodes operating electrically in parallel; the Deschambault plant has cells containing 40 anodes each. These cells are approximately 15 meters long, 4 meters wide, and have a depth of 0.7 meters. Anodes are approximately 1.6 meters long and have a width and height of 0.7 meters. A bird’s eye view of the anode layout of a cell at the Deschambault facility is shown in Figure0.8. Each cell is composed of two rows of 20 anodes each. The anode position labels shown in Figure0.8are the same for all cells.
Each anode in a cell receives a portion of the overall line current inversely proportional to its local resistance. If all anodes are equally resistive and bath conditions are uniform across the cell, the current will be distributed evenly through the cell and the aluminum production rate will be equal at all anode positions. In reality, anodes are not equally resistive and bath conditions are neither uniform
21 22 23 24 25 26 27 28 29 30 31 32 33 34 35 36 37 38 39 40 20 19 18 17 16 15 14 13 12 11 10 9 8 7 6 5 4 3 2 1 Cell B104 Cell B102 Cell B103 Tap End Duct End
Figure 0.8: Layout of a cell (B103) at the Deschambault smelting facility. Anode position labels are the same for all cells.
nor constant over time. In addition, discrete events such as anode replacements dramatically alter the current distribution temporarily. Anodes are also continuously consumed by the electrolytic reaction, which can change the ACD at different anode positions if the consumption rate is not spatially uniform. The current distribution in any industrial cell is therefore imbalanced and dynamic.
Anode production represents a significant portion of the total cost of aluminum production. In addi-tion, anode quality directly impacts the efficiency of the electrolysis process; electrolysis cells operate more efficiently with high quality anodes. While the direct costs of anode production typically repre-sent 15% of the total operating costs, this figure can rise to 25% if poor quality anodes are produced due to the additional indirect costs thereby incurred [6]. Anode production can be distilled into three main stages: paste formulation, anode forming, and anode baking.
In the first step the raw materials are mixed together in a specified ratio according to the recipe used. A small amount of recycled material from spent anode butts is also added to reduce costs. This step serves to control the ratio of coal tar pitch to coke as well as the overall size distribution of coke particles. Various sizes of coke particles are mixed together to maximize the packing density of the resultant mixture. The ingredients are preheated to ensure that all empty space is filled, to improve mixing, and to wet all coke particle surfaces with the coal tar pitch binder. The ideal temperature is typically 150 °C, or 50 to 90 °C above the softening point of the coal tar pitch [2,6]. At such a temperature the mixture becomes a paste. Mixing can be done either continuously or in batches. The second stage involves forming the heated mixture into the desired shape. This is accomplished through the use of a hydraulic press or, in newer plants such as the Deschambault facility, by a vi-brocompactor. Both methods seek to mold the paste into its final shape through compression. Once formed, the paste must be set by cooling it in either air or water. Air cooling methods are slower than quench cooling methods, but entail a lesser risk of crack development as a result. If quench cooling is chosen, the water bath is typically preheated to 70 °C to reduce the cooling rate to a safe level [6]. The final result is an uncooked, green anode.
In the final stage the raw anodes are cooked to drive off residual volatile matter, coke the coal tar pitch, and desulfurize and strengthen the anode. This is accomplished by heating the anodes near 1150 °C in an oven for approximately two weeks. The anodes must be heated and subsequently cooled over this period gradually; the heating and cooling periods are approximately symmetrical, lasting around six or seven days each, and are separated by a one-day period of heating at the maximum temperature. This is the most expensive stage of the anode manufacturing process due to the large quantity of fossil fuels required to heat the oven despite the technological advances which have reduced the maximum temperature required since the 1970’s [6]. Once cooked, stems are attached to the anodes so that they can be connected to the anode beam during cell use.
Anodes quality depends on the properties of the raw materials used as well as the production process. The production of high quality anodes is essential to efficient aluminum smelting due to its direct impact on the efficiency of the Hall-Héroult process. Unfortunately, obtaining high quality anodes often involves a trade-off between desirable properties. Of particular importance is anode resistivity. Less resistive anodes are better conductors of electricity and therefore reduce heat loss due to the Joule effect. However, these same anodes tend to have high thermal conductivity, which can cause the top surface of an anode to overheat during operation and react with air, wasting valuable resources and accelerating the consumption of the anode.
0.6
Anode Replacement Cycle
Electrolysis cells undergo anode replacements regularly; the frequency varies between once per day and once every three days [9]. This is necessary because the anodes are consumed by the aluminum reduction reaction. The volume of an anode is reduced by 66% to 75% over the course of its two- to four-week life cycle [2].
The replacement process is begun by breaking the crust surrounding the spent anode at the top of the cell. Once a hole large enough to allow the anode to pass through has been made, the old anode is lifted from the cell by its stem using a mobile crane. The spent anode is then transferred away so that it can be cleaned and prepared for recycling. A fresh anode is then lowered into the now vacant anode position. It is critical to ensure that the fresh anode is placed into the bath at the correct height to minimize the disturbance to the cell current distribution. An anode that is placed too high will create a local region of higher resistance in the bath due to the extra distance between the anode and the metal pad through which the current must travel. Conversely, anodes placed too close to the metal pad will create a local region of lower resistance, causing current to be drawn away from other anodes in the cell as a result. Both scenarios reduce the cell’s production rate. Fresh anodes are therefore set such that their steady-state ACD will be the same as the other anodes in the cell to create as even a current distribution as possible.
Even if a fresh anode is set in the bath at the perfect height, the anode replacement process still results in a considerable disturbance to the cell. Because the total line current is constant, the removal of a
spent anode causes its current to be redistributed among the remaining anodes in the cell, resulting in a sudden increase in the overall cell resistance and voltage. This period of higher cell resistance persists even after the fresh anode has been set in the cell. New anodes are always considerably colder than the bath in which they are submerged. The temperature difference causes the bath surrounding the fresh anode to freeze, encasing the fresh anode in a layer of bath crust. The crust acts as an electrical insulator and prevents current from flowing at that anode position. As the crust thaws over time the current flow through the fresh anode rises until it eventually plateaus at a maximum value 24 to 48 hours later [10]. In some processes, fresh anodes are preheated to as much as 500 °C to minimize the temperature difference between the fresh anode and the bath [9]. This reduces the amount of bath freeze formed and the amount of time required for the current distribution to re-stabilize following an anode replacement, thereby minimizing the disturbance to the cell. Following anode setting, the stubs of the fresh anodes also heat up, which causes them to expand. This expansion improves the contact between the various material interfaces of the circuit, resulting in a decrease in resistance over time. An individual current signal measured at a single anode position following an anode replacement is known as a current trajectory. If the overall cell voltage or cell resistance signal is measured over the same period, voltage trajectories and resistance trajectories can be formed. This can be done for any cell operating variable measured continuously. Example anode current trajectories are shown in Figure0.9. These data were taken from pot B120, which is an electrolysis cell at the Deschambault facility that has been instrumented with individual anode current sensors.
−3 −2 −1 0 1 0 1 2 3 4
Anode Service Time (days)
Normalized Anode Curr
ent
Pot B120 average Anode position 2 Anode position 19
Figure 0.9: Examples of individual anode current trajectories taken from pot B120 at the Descham-bault smelter.
As explained previously, an anode position’s current flow falls to zero at the time of replacement and then rises until a plateau is reached. If the ammeter measuring the current flow through the fresh
anode is calibrated properly, the current trajectory will start at zero and rise at a relatively constant rate until a final plateau is reached once the entire bath freeze has melted. This trend is apparent in the current trajectories shown in Figure 0.9; although the final steady-state current values differ, the general shapes of the current trajectories shown are similar.
The period of high resistance following an anode replacement can significantly disrupt other cell conditions by creating magnetohydrodynamic instability and low superheat zones [9]. In addition, the removal of the spent anode can cause the cell to be contaminated with bath crust or carbon. Such disturbances can result in undesirable process events at the anodes such as anode effects and anodic incidents [9].
0.7
Conclusion
Aluminum production is a critical industry in the province of Quebec, which makes maintaining a competitive advantage by implementing process improvement initiatives of great economic impor-tance. Despite considerable advancements in smelting technology since the inception of the electrol-ysis process, significant differences in smelting performance still exist between the best and worst smelters. Many of the issues that can reduce the efficiency of the process occur at the carbon anodes which facilitate the flow of current and provide a carbon source to liberate oxygen ions from the cell. Two such problems are anode effects and anodic incidents, whose nature, development, and detection strategies are described in Chapter1. Chapter2explains the need for anodic incident detection meth-ods and the objectives of the project. A description of the data that were studied and the preprocessing steps taken are presented in Chapter3. Chapter4offers a detailed explanation of the multivariate data analysis tools used to build the anodic incident detection system. Chapter5presents the methodology used to optimize the anodic incident detection systems built. The performance obtained for the various detection systems built is presented and discussed in Chapter6. Finally, the dissertation is concluded with a summary of the results obtained and recommendations for future work.
Chapter 1
Deleterious Anode Events
The aluminum electrolysis process is not perfect; undesirable process events can arise for a number of reasons. Two of the most common disturbances are anode effects and anodic incidents. These two events occur at the anodes in a cell and have significant negative effects on cell operation. This chapter explains the root causes, mechanisms, and effects of these deleterious anode events. The detection methods currently used in industry as well as those proposed in recent research are also highlighted.
1.1
Anode Effects
An anode effect is produced when undesirable side reactions occur as a result of a drop in the bath’s alumina concentration. This is typically the result of a blocked alumina feeder. Over time, a blocked feeder causes the local alumina concentration in the cell to fall. The anode closest to the blocked feeder is the first to experience an anode effect, and if left unchecked, neighbouring anodes become affected as the alumina depletion spreads throughout the cell. A low alumina concentration results in undesirable side reactions occurring at the anode, causing perfluorocarbons to be generated [11]:
4 AlF63−+ 3 C −−→ 4 Al + 3 CF4+ 12 F− (1.1) 2 AlF63−+ 2 C −−→ 2 Al + C2F6+ 6 F− (1.2) This has two consequences. First, the cell’s environmental impact worsens because the compounds produced during anode effects are powerful greenhouse gases. CF4and C2F6 have atmospheric life-times of 50 000 and 10 000 years, respectively, and their global warmings potentials 4880 and 8210 times greater than that of carbon dioxide [12]. Second, anode effects decrease cell current efficiency. The perfluorocarbon bubbles produced have a tendency to accumulate underneath the affected an-ode, forming an insulating layer of gas which increases the local resistance. This causes the overall cell resistance to increase, which increases the cell’s voltage drop and production costs. The control system will attempt to compensate for this increase in resistance by decreasing the ACD, which can destabilize the metal pad, cause short circuiting, and disrupt the cell’s heat balance.
The negative outcomes of an anode effect worsen if the root cause of the alumina shortage is not addressed quickly. The initial local depletion of alumina becomes a global problem as the alumina concentration falls across the entire cell. This causes the anode effect to propagate outwards, spreading to neighbouring anodes as the alumina is consumed. This increases the generation of perfluorocarbons and cell resistance, resulting in an even greater environmental impact and increased operating costs. Anode effects develop quickly, typically in the order of several minutes.
1.2
Anodic Incidents
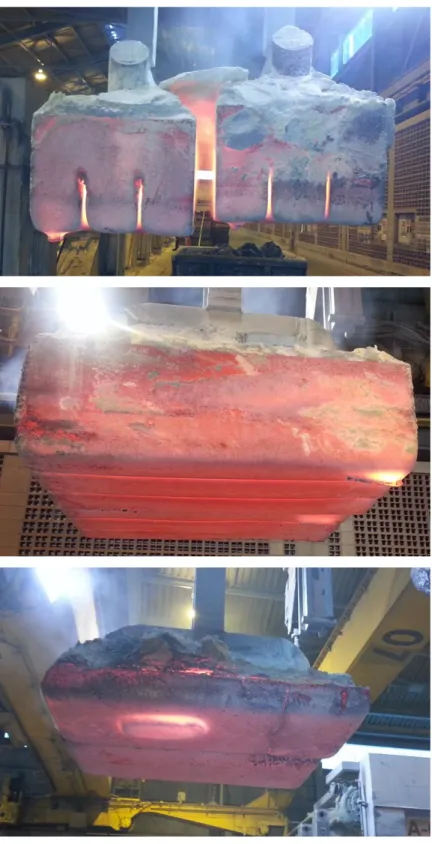
An anodic incident occurs when an aluminum electrolysis cell partially short circuits at an anode position due to a reduced ACD. They are often the result of a physical deformation forming on the bottom surface of an anode following its placement in the cell. These deformations are commonly referred to as spikes due to their tendency to protrude downwards toward the aluminum pad like a stalactite. Three examples of spikes are shown in Figure1.1.
These images show anodes that have been removed from the cell, making their spikes visible. The spikes protrude downward from the affected anodes towards where the aluminum pad would be if the anodes were placed back into the cell. In all three images the spikes appear to be brighter in colour than the anodes. This is a direct result of the Joule effect, which causes the spikes to become significantly hotter than the rest of the anode due to the extra current they draw as a result of the short circuit.
Spike development can be grouped into three phases as shown in Figure 1.2. Spike development begins with an asymptomatic anode; spikes do not form until after an anode has been placed in the cell. In this first phase, current flows from the anode to the aluminum pad at the bottom of the cell through the electrolytic bath normally. In the second phase a small protrusion forms on the bottom surface of the anode as the anode is consumed, creating a second path the current can take to reach the cathode. The spike reduces the effective distance between the anode and the cathode (ACD), as shown in Figure1.3. The decrease in the effective ACD lowers the resistance at the affected anode position relative to the others; the current flow at the affected anode therefore increases. Because the total line current is held constant, the current at the other anode positions falls to compensate for the increase at the affected anode. The degree to which the current is redistributed towards the affected anode is inversely proportional to local resistance at the affected anode position. Maximum current redistribution occurs in phase three when the spike grows to such a length that it contacts the aluminum pad, resulting in a full short-circuit. At this stage current flows directly through the spike to the aluminum pad, bypassing the bath entirely at the affected anode position.
Anodic incidents can also occur if an anode is set too low in the cell during an anode change due to equipment or human error. An anode that has been set too low in the cell will have a lower ACD than its neighbours, which decreases the local resistance at the affected anode position. This causes the poorly set anode to draw more current than it should in the same way as if a physical deformation
Figure 1.1: Examples of spikes on fresh (top), middle-age (middle), and mature (bottom) anodes. Source: Aluminerie Alcoa.
Phase 1 – Asymptomatic
Anode
Aluminum pad
Phase 2 – Spike Development
Anode
Aluminum pad
Phase 3 – Anodic Incident
Anode
Aluminum pad
Figure 1.2: The three phases of spike development. If left unchecked, spikes eventually come into contact with the aluminum pad, resulting in a short-circuit at the affected anode.
Anode Aluminum pad Anode Aluminum pad Spike Develops
Normal ACD Post-Spike ACD
Figure 1.3: Anode-cathode distance before and after the development of a spike.
were present on its bottom surface.
Anodic incidents negatively affect cell operation in several ways [13]. First, they decrease the alu-minum production rate. The alualu-minum-producing chemical reactions can only occur if electricity is flowing through the bath. The presence of an anodic incident shortens the distance the current must travel through the bath to reach the aluminum pad. This increases the proportion of current that passes through the bath without participating in the electrolytic reaction, which effectively decreases the cell’s production rate at the affected anode position. However, the production rate also falls at the healthy anode positions; the redistribution of current away from healthy anodes towards the problem-atic anode results in a slight drop in the reaction rate at all of the healthy anode positions. The overall production rate of the cell falls in consequence.
Anodic incidents also cause the healthy anodes to operate at an unnecessarily high operating volt-age, increasing operating costs. Anodic incidents decrease the local resistance at the affected anode which decreases the overall cell resistance as a result. As explained in Section0.4, the control system compensates for shifts downward in the cell resistance by raising the anode beam. Although raising the beam prevents the affected anode from fully short-circuiting, it also increases the ACD and resis-tance at the healthy anode positions. This increases the local resisresis-tance at the healthy anode positions, resulting in an increase in the energy consumption per unit of aluminum produced.
Anodic incidents also disrupt normal cell operation by increasing the temperature of the affected cell. The overall aluminum reduction reaction is highly endothermic and therefore consumes heat as aluminum is produced. When the production rate falls due to an anodic incident, the reaction rate and the rate of heat consumption fall. However, heat generation due to the Joule effect remains relatively unchanged since the overall current flow is constant. The net effect is a positive heat balance resulting
in a temperature increase which can destabilize the operating conditions of the cell. The repeated subjugation of a cell to anodic incidents can decrease its lifespan, resulting in significant long-term cell maintenance costs being incurred [13].
All of the aforementioned negative effects worsen as the effective ACD decreases at the affected anodic position. Data collected from Rio Tinto smelters have shown that a fully short-circuited anode causes the current efficiency of the cell to fall by 4% and that the current efficiency starts to noticeably drop one week before the short-circuit can be detected using current methods [8]. Therefore, early detection of anodic incidents is highly economically advantageous. If detected early the affected anode can either be manually raised on the beam relative to the other anodes to equalize its resistance, or if the anodic incident is due to a physical deformation the anode can be temporarily removed from the cell so that operators can break off the spike using specialized tools. Both methods rebalance the current distribution in the cell, thereby mitigating the anodic incident and the associated negative consequences. Alternatively, the affected anode can be replaced by a new one.
Several root causes of spike development have been identified in the available literature [8]: 1. Contamination of the cryolite bath with carbon dust
2. Poor anode quality
3. Unstable cell operation following anode replacements
Of these three root causes of spikes, cell contamination is perhaps the most important. Any event resulting in the contamination of the cryolite bath with carbon can result in spike development. The risk of contamination is particularly high during anode replacements. The removal of the spent anode from the cell leaves a hole in the bath crust in which ambient carbon dust accumulates until the fresh anode is set [14]. The mixture of carbon dust and electrolyte forms a foam which sits in the opening left by the removed anode. Exposure to ambient air causes the entire foam surface to cool, but the cooling rate is not uniform. The areas of the foam surface richest in carbon cool the fastest due to carbon’s capacity to emit heat through radiation. The differential cooling rate has been approximated using the radiative heat transfer equation for grey bodies:
Q= Aεσ (Ts4− T4
o) (1.3)
In Equation1.3, A represents the surface area of the bath opening, σ is the Stefan-Boltzman constant, Ts is the temperature of the bath surface, To is the temperature of the surroundings, and ε is the emissivity of the foam mixture. The emissivity increases as a function of the foam’s carbon content, which has been shown to increase the cooling rate by 20% in a dirty bath compared to a clean bath [14]. The fresh anode is set directly on top of the foam, which instantly freezes and forms a solid layer between the bottom surface of the fresh anode and the aluminum pad. The bath then reheats the foam layer, which melts over time. The carbon-free areas of the foam freeze are the first to fully melt
because of their higher starting temperature; aluminum production and anode consumption therefore recommence at these regions first. The foam areas rich in carbon are the last to melt due to their lower starting temperature. If the carbon contamination is significant, these regions may take considerably longer to melt than the carbon-free regions, causing the bottom surface of the anode to be consumed at different rates while the freeze thaws. The carbon-rich areas of the surface are consumed the most slowly and will appear to protrude downward from the anode as the surroundings areas are eaten away faster. In the event of significant carbon contamination the carbon-rich areas are consumed so slowly that a large spike forms, resulting in an anodic incident if the problem is not addressed. Spikes formed through this mechanism typically take several hours to develop.
Carbon contamination can also result in spike formation upon setting the anode. If particularly large chunks of carbon are present in the bath when the fresh anode is set, spikes can form instantly as the chunks fuse to the bottom surface of the fresh anode. It is therefore imperative to remove carbon from the bath prior to anode setting.
Carbon contamination is likely the main contributor to spike development; at Hoogovens Aluminium Voerde 66% of the anodic incidents occur within the first 8 days of the anode’s life [14]. At Aluminerie Alcoa 35% of anodic incidents are detected within the first 48 hours of the anode’s 4-week service life. This 48-hour window constitutes only 7.5% of an anode’s lifespan and therefore contains a disproportionate fraction of the total anodic incidents, making it a critical period to monitor.
There are three main sources of carbon that can result in cell bath contamination. Ambient carbon dust in the air is generated when spent anodes are cleaned; the process of removing the bath layer from a spent anode butt invariably releases carbon dust into the air, which is why it is a good practice to clean anodes away from the electrolysis cells [14]. Carbon dust can also be generated directly in the cells through combustion of the anodes. In addition to increasing production costs, combustion of anodes releases carbon dust into the space above the bath. This dust can contaminate the bath later during anode replacements.
Carbon can also be introduced directly into the bath if secondary alumina is fed rather than primary alumina. Fluorine is inevitably lost during electrolysis operation due to evaporation; a certain amount of fluorine escapes with the carbon dioxide off gas through the cell’s fume system. Pure alumina is often used as a scrubbing agent to recover this lost fluorine to reduce costs and improve the plant’s environmental performance. The alumina output from this process is known as secondary alumina because it is no longer pure. In addition to fluorine, a considerable amount of carbon dust present in the off-gas also adheres to the alumina during the scrubbing process. This carbon is reintroduced directly into the bath as part of the alumina feed where it may later cause anodic incidents. The elimination of the secondary alumina feed at Hoogovens Aluminium Voerde resulted in a 21% decrease in the occurrence of anodic incidents [14].
Poor anode quality has also been hypothesized as a possible cause of spike development, although no research exists statistically linking specific anode properties to an increased likelihood of spike
formation. It is likely the case that poor quality anodes whose properties are non-uniform result in a differential consumption rate across the bottom surface. This results in the formation spikes in a similar way to that of carbon contamination.
Unstable cell operation can also result in spike development. Specifically, if the heat balance of the cell is upset for any reason, this can create non-uniformity in the cell’s thermal profile, potentially causing spikes to develop at relatively cool spots. Due to the tendency of anodic incidents to increase the temperature of the bath, a single anodic incident can destabilize the bath temperature and trigger additional anodic incidents, leading to a positive feedback loop. This makes early detection of anodic incidents critical. Thermal disturbances can also increase the deterioration rate of anodes in the cell, potentially resulting in additional carbon contamination and anodic incidents through the radiative heat transfer mechanism previously described.
1.3
Detection
Anode Effects
The detection of anode effects has been studied extensively; reliable methods capable of detecting anode effects in real-time have been implemented in modern aluminum smelting plants. Anode ef-fects are typically detected by monitoring the cell voltage signal; the sudden increase in resistance at the affected anode position results in a proportional increase in the cell voltage before the control system can compensate, making it easily detectable [15]. The increase in the cell voltage signal oc-curs quickly, allowing anode effects to be detected shortly after they begin. Due to the effectiveness and reliability of this method, recent research relating to the detection of anode effects has focused primarily on developing predictive methods capable of spotting incoming anode effects before the perfluorocarbon accumulation results in a cell voltage spike by increasing the cell’s resistance. The simplest method that has been proposed is to monitor individual anode current signals using stan-dard control charts. Individual anode current signals become unstable during anode effects due to the current redistribution that occurs, resulting in the individual current of the affected anode decreasing while all other anode currents rise to account for the difference. Several studies investigating this method were published between 2008 and 2016 [16,17,18,19,20]. It was determined that the cur-rent redistribution away from the affected anode position that occurs during an anode effect is easily detectable univariately and can be used to predict anode effects 2-3 minutes in advance [21]. Anode effects develop very quickly compared to anodic incidents, making this 2-3 minute advanced warn-ing highly valuable. These methods were then improved upon by monitorwarn-ing the movwarn-ing averages of the individual anodes current signals. It was found that the the ratio of a short-term moving average current and long-term moving average current can be used to detect anode effects [15]. If this ratio becomes elevated for a certain number of anodes, an alarm is triggered indicating the presence of an anode effect. This method was then refined by adding a second detection criterion to reduce false positives; a minimum threshold for the maximum current value at each anode position was added to
confirm the anode effects detected through the ratio of short- and long-term moving averages [11]. Frequency domain current signals have also been used successfully to detect anode effects. The power spectrum of the current signal of an affected anode has been found to differ from that of a healthy anode [10,22]. Specifically, the normal peak found between 0.8 Hz and 1 Hz diminishes significantly during an anode effect, making this range useful in anode effect detection systems [10]. By comparing the power spectra of anodes to a baseline developed from a training set of healthy anodes, anodes subjected to anode effects can be distinguished by examining the magnitude of the frequency channels in the critical range.
Multivariate approaches using global cell variables have also been used to detect anode effects through the use of latent variable Principal Component Analysis (PCA) models. In the first step, a PCA model is fit to time series operating data organized in batches taken from periods of normal operation free of anode effects. Typically, operating variables such as cell voltage error, cell voltage noise, cell re-sistance error, cell rere-sistance noise, and filtered errors are included [23], although other combinations of operating variables are possible. During training, the PCA model extracts the correlation structure of the process variables to create a reduced set of uncorrelated, latent variables. A problematic region of the score space created by the PCA model is identified using the training data; data points residing in this region are flagged as anode effects. In the second step the PCA model is used to monitor the plant in real-time. As soon as an observation enters the problematic region identified during training, the control system raises an anode effect alarm. When tested, this method was found to detect anode effects 15 minutes in advance, providing ample time for corrective action to be taken [23].
An alternative multivariate method for detecting anode effects using Projection to Latent Structures (PLS) has also been proposed [13,24]. In this approach the same cell operating conditions mentioned previously are used to directly predict class labels (anode effect or asymptomatic). Integrated, multi-block models have also been proposed to detect a variety of abnormal plant conditions.
The most recent method developed for anode effect detection is also multivariate, but involves two key changes [25,26]. First, the operating condition trajectories are replaced with individual anode current signals which are organized chronologically in the data matrix rather than batch-wise. Second, Kernel Principal Component Analysis (KPCA) is used instead of normal PCA. In KPCA, a kernel function is used to project observations to a new space where the variables are more likely to be linearly correlated. A normal PCA model is then fit to the projected data. In cases where the original variables are non-linearly correlated, such as individual anode current signals, KPCA can significantly reduce the number of principal components required, thereby reducing the complexity of the model and calculation time. To detect anode effects, the KPCA model is used to predict all anode current signals in the cell in real-time. The prediction error and distance from the model origin are then monitored in univariate control charts; exceptionally high values trigger alarms indicating the presence of an anode effect.
Anodic Incidents
Unlike anode effects, anodic incidents can take several hours or days to develop and negatively affect the process long before they can be detected using current techniques. The typical detection method involves taking manual voltage drop measurements. Periodically, operators perform rounds in the plant during which they measure the voltage drop across individual anode stems to check for anodic incidents; since the resistance of the anode stems is constant, a high voltage drop at the stem indicates that the current flow through the attached anode is high and could be the result of a spike or poorly set anode. Although reliable, this method is labour-intensive and inefficient; there are 10560 anode stems in the Deschambault facility, making it impractical to measure the voltage drop at each one on a daily basis. Infrequent checks at each anode position often result in late detection of anodic incidents using this method.
Several alternative anodic incident detection methods have also been proposed. The first involves monitoring the temperature of the bath [27]. Anodic incidents cause the bath to heat up by reducing the rate of the endothermic reduction reaction that consumes the heat generated in the cell by the Joule effect. A steady increase in the bath temperature over time or a simple temperature control limit can therefore be used as an indicator to detect anodic incidents. This method has several signif-icant drawbacks. First, the cell bath temperature cannot be measured continuously with the available technology; these measurements must be taken by operators using a special device. Second, it is not possible to predict anodic incidents in advance using the bath temperature; by the time the anodic incident increases the temperature of the bath, significant losses in current efficiency have already oc-curred. Finally, the temperature of a cell can rise for a variety of reasons unrelated to anodic incidents, which can result in false alarms.
A slightly better strategy proposed in the same study is to monitor the position of the anode beam [27]. As an anodic incident develops, the overall cell resistance falls due to the reduced resistance at the affected anode position. The control system reacts by raising the beam position to increase the resis-tance of the cell. It is therefore possible to detect anodic incidents by checking for increases in the beam position above a certain threshold. This method is likely faster than waiting for a temperature increase, but is still relatively slow since the effect of the anodic incident on the overall cell resistance is diluted by that of the other healthy anodes. In addition, this method does not take into account that the cell resistance set point is dynamic and changes with the feeding cycle, resulting in false positives when the resistance set point is high.
Multivariate methods have been proposed to address the issues inherent in the univariate methods mentioned above [13,23,24,28]. Multivariate methods seek to detect anodic incidents by monitor-ing multiple global cell variables simultaneously with a latent variable model. These variables often include cell voltage, cell resistance, beam position, and resistance noise. First, the plant data are arranged in batches so that each observation in the data matrix corresponds to data recorded for a specific period of time during which the plant operated normally. Then, a PCA model is fit to the