Modification of coke by different additives to improve anode properties Sena Ozturk, Duygu Kocaefe*, Dipankar Bhattacharyay, Yasar Kocaefe, Brigitte Morais
UQAC Research Chair on Industrial Materials (CHIMI) University of Quebec at Chicoutimi,
555 Boulevard University, Chicoutimi, QC, Canada G7H 2B1 Sena Ozturk <[email protected]>,
Duygu Kocaefe <[email protected]>,
Dipankar Bhattacharyay < [email protected]>
Yasar Kocaefe<[email protected]>, Brigitte Morais<[email protected]>
*Corresponding author: Tel 1 418-545 5011 ext. 5215 E-mail: [email protected]
Abstract
Aluminum is produced in electrolytic cells using carbon anodes, which consist of a mixture of coke, pitch, and recycled carbon material. Anodes play an important role in aluminum production. The quality of raw materials can vary based on the source and the process parameters. In spite of the variations in the raw material properties, the industry has to maintain the quality of anodes. In order to manufacture good quality anodes, coke and pitch must interact well with each other. The affinity between these two components depends on good wetting properties, which will lead to good binding of the particles. The main objective of this work is to modify the coke in order to improve its wetting properties using different additives. An FT-IR study was done to identify certain functional groups in non-modified and modified coke as well as in pitch. The wetting tests were carried out using the sessile-drop method to measure the contact angle between cokes and pitch. Based on FT-IR and wettability results, an additive was selected and used for the fabrication of anodes, which were characterized before and after baking. The modification of coke with the selected additive improved the anode properties.
1. Introduction
Aluminum is produced by the electrolytic reduction of alumina. In this process, the carbon anodes are consumed according to Equation 1.
2Al2O3+3C = 4Al + 3CO2 (1)
The carbon anodes are made of dry aggregate (calcined petroleum coke, butts and recycled anodes) and coal tar pitch. The dry aggregate and pitch are mixed to form the anode paste at around 170°C. The anode paste is compacted in a press or vibro-compactor to produce the green anode. The green anode is baked in a furnace to produce the baked anode. Calcined coke constitutes around 65-70% of the anode raw materials. Carbon anode cost is one of the major elements of the aluminum production cost, which could exceed 20% [1].
In recent years, the demand for anode-quality raw materials has increased due to the increase in aluminum production. The calcined petroleum coke and coal tar pitch are the main raw materials required for the production of carbon anodes. Properties of calcined coke are important since it is present in anodes in large quantity and directly affect the quality of baked anode. It is a solid by- product from oil refineries, representing some 2 % of their overall revenues [2]. Thus, the quality of coke is not a primary concern for the refineries. Its quality depends on the crude oil, processes within the refineries, and calcination conditions. Thus, the quality of calcined coke can change.
Pitch is also a by-product of the coal tar industry, and its quality can also change. A good quality baked anode has high density, low electrical resistivity, low air and CO2 reactivities, and good mechanical properties [3]. In spite of the variation in the raw material quality, the industry has to maintain the anode quality.
During anode manufacturing, calcined coke and pitch interact with each other in the mixing stage. The pitch, which is used as a binder, must not only fill the void space between particles,
but also penetrate into the pores of calcined coke [4]. During baking, the pitch carbonizes and binds the coke particles together. This requires good wetting properties between the two components [5]. To achieve this, the surface tension must be reduced, and the interaction between coke and pitch needs to be enhanced. In order to obtain good anode, the raw material properties should be improved.
Wettability of a solid surface by a liquid is the function of the surface and interfacial forces which are both adhesive and cohesive (physical wetting) and the chemical interactions (chemical wetting). When a liquid makes contact with a solid surface, a spontaneous interaction takes place at the interface. The resulting pattern (contact angle) is used to determine the wetting properties of solid [6]. Wettability of coke by pitch controls the interactions between these two components.
Improved wettability of coke by pitch helps pitch better penetrate into the pores of the coke as well as the void between different particles. Three kinds of chemical interactions are possible between coke and pitch: hydrogen bonding, electrostatic interaction, and acid-base reactions/condensation. These interactions require aromatics, charged centres, and heteroatom- containing (O, N, S) functional groups [5].
The interactions between the pitch and the particles depend on their properties. Among the properties of coke, the particle size, the texture, and the chemical functional groups on the surface considerably affect the wettability of coke by pitch. In order to quantify the wettability, the contact angle between the solid and the liquid surfaces is measured. If the value of the contact angle is greater than 90°, it is considered non-wetting. If the contact angle is smaller than 90°, it is considered that the pitch wets the solid surface [7].
Coke is one of the major raw materials used in the anode recipe. The interactions between coke and pitch influence the resulting anode density. Hence, the wettability of coke is an important parameter to consider during the mixing stage. In the work of Sarkar et al. [5], the influence of some coke properties on the wettability was investigated. It was observed that porosity, O2
content, and the amount of C-S bond control the wettability of coke by pitch. Usually electronegative heteroatoms such as O, N and S help formation of hydrogen and covalent bonds between coke and pitch enhancing the coke-pitch interaction. Sarkar et al. [5] identified the role of C-S based on linear multivariable analysis. Jiang et al. [8] studied the effect of chemical treatment of petroleum coke by perchloric acid (HClO4) and hydrogen peroxide (H2O2). After the modification, the structure of coke changed, and the specific surface area increased. The oxygen containing functional groups increased due to the chemical treatment. However, they did not use the coke for anode production.
Pitch is also one of the important raw materials in the anode production. Researchers have studied the improvement of the pitch wetting behavior by the use of surfactants and additives [9- 12], and different organic compounds such as aceptophenone, dimethyl-naphthalene, acenaphthene, fluorine, diphenylene-oxide, α-methyl-naphthalene, and polymeric resins [13].
However, to our knowledge, there is no published study on the improvement of coke properties, and use the modified coke in the production of anodes.
The aim of this study is to improve the wettability of coke by pitch using additives. Based on the wettability test results carried out with and without additives, anodes were fabricated and characterized in the carbon laboratory of the UQAC Research Chair on Industrial Materials (CHIMI) to see the effect of coke modification on anode properties.
2. Experimental
2.1. Materials Used
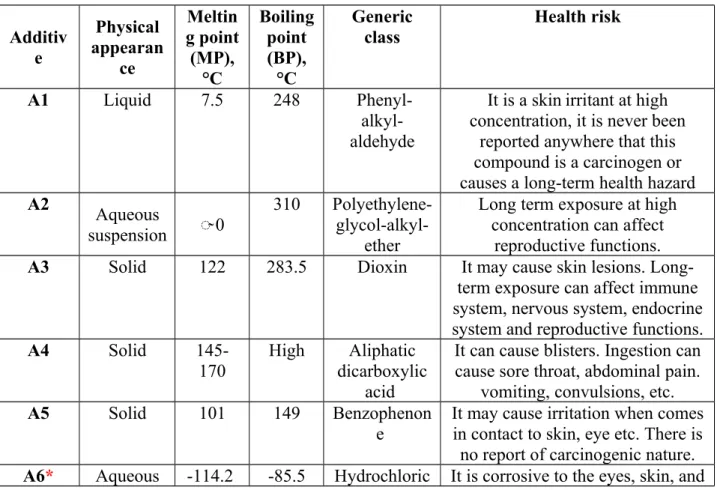
In this study, a calcined petroleum coke and a coal tar pitch were used. They were obtained from the industry. The softening point of the pitch was around 120°C. Six additives and a solvent (aliphatic alcohol) were purchased from Sigma Aldrich. Organic additives which would not leave any inorganic residues during heating at high temperatures (i.e., during anode baking) were chosen. Measured quantities of additives were dissolved in the solvent and were then used to modify the coke. The melting and boiling points and the physical states at room temperature of the six chemicals are presented in Table 1. The generic names of the chemicals are presented in Table 1 hiding some detailed structural information due to confidentiality.
Table 1: Properties of the additives Additiv
e
Physical appearan
ce
Meltin g point (MP),
°C
Boiling point (BP),
°C
Generic class
Health risk
A1 Liquid 7.5 248 Phenyl-
alkyl- aldehyde
It is a skinirritant at high concentration, it is never been
reported anywhere that this compound is a carcinogen or causes a long-term health hazard
A2 Aqueous
suspension ̴̴ 0
310 Polyethylene- glycol-alkyl-
ether
Long term exposure at high concentration can affect
reproductive functions.
A3 Solid 122 283.5 Dioxin It may cause skin lesions. Long-
term exposure can affect immune system, nervous system, endocrine system and reproductive functions.
A4 Solid 145-
170
High Aliphatic dicarboxylic
acid
It can cause blisters. Ingestion can cause sore throat, abdominal pain.
vomiting, convulsions, etc.
A5 Solid 101 149 Benzophenon
e
It may cause irritation when comes in contact to skin, eye etc. There is
solution acid mucous membranes. Short-term exposure may cause respiratory tract irritation and pulmonary
edema.
*The properties given are for hydrogen chloride (HCl) gas. Hydrochloric acis (HCl), which is aqueous (aq), forms when hydrogen chloride gas dissolves in water. Boiling and melting points of aqueous HCl depend on the concentration of HCl gas dissolved in the solution.
2.2. Modification of the Calcined Coke with Additives a) For wettability experiments
Calcined coke particles of size less than 1 mm were crushed in a laboratory hammer mill (Retsch SK 100). The crushed particles were sieved using a sieve shaker (Humboldt MFG) and -125+100 µm particles were collected. This particle fraction was modified using the additives for the wettability tests.
Addition of solid or aqueous suspension chemicals directly into coke does not ensure homogeneous mixing and the modification of all coke particles. Thus, the chemicals were dissolved in a solvent. A polar high-dielectric constant solvent with low boiling point was used to ensure that the chemicals will dissolve in this solvent and the solvent will evaporate during drying. The high dielectric constant indicates the high polarity of the solvent, which dissolves polar additive molecules. A measured quantity of the additive was dissolved in a specific volume of the solvent using a magnetic stirrer. Then, measured quantity of coke was added to the solution, which was stirred for 10 minutes. The mixture was dried in a furnace at 85°C for 1.5 h.
The modified coke samples were finally cooled to room temperature and used for the wetting experiments.
b) For anode preparation
One standard anode (used as a reference) and one anode with the coke modified with a chosen additive were produced to determine the effect of that additive on anode properties. All the other
raw materials (pitch, anode butts, green and baked rejects) and fabrication conditions were maintained the same. The optimum pitch content was chosen based on the previous study [14]
carried out at UQAC. This study was done using untreated coke and pitch. It was found that 15- 17% pitch can help produce good quality anodes with good properties. In this study 15% pitch content was used. The pitch content was not optimized for anode made with the modified coke.
Such a study might improve further the properties of the anodes. However, it was not within the scope of this work.
The standard anode was manufactured using non-modified coke. Then, the solution which contains the measured amount of additive and a certain amount of solvent was prepared for the modification of the coke. The percentage of the additive was calculated based on the dry aggregate amount. The dry aggregate was placed in a container. Then, the solution was added slowly to the container. The temperature was increased to 50°C and maintained for five minutes.
After, the mixture was left at room temperature for 1 day to dry.
2.3. Sample Characterization
2.3.1. Fourier Transform Infrared Spectroscopy (FT-IR)
FT-IR experiments were done to identify different functional groups present in the cokes (modified and non-modified with chemicals), pitch, and additive samples using Nicolet 6700 FT- IR. KBr was used to prepare the sample and the ratio of KBr to sample was approximately 200:1.
The number of scans carried out was 36 for each sample to get the average spectra. The IR spectra were collected for the wavenumber range of 400-4000 cm-1. The spectra were smoothened, and linear baseline correction was done using Omnic software. Each sample was
2.3.2. Wettability
Wettability experiments were carried out using the sessile-drop method with a set-up available in the carbon laboratory of Chair CHIMI. The equipment includes one tube furnace, an injection chamber for pitch, a graphite sample crucible, a camera, a vacuum pump, and a nitrogen line.
Measured quantity of coke sample was placed into the graphite sample crucible and was compacted to achieve a smooth coke bed surface. The injection chamber contained the solid pitch sample. This chamber has a small hole in its body and is placed just above the coke sample by rotating the injection chamber during the experiment. The coke and pitch were heated in a tube furnace. Since calcined coke or pitch can react with oxygen at high temperature, an inert nitrogen atmosphere was maintained inside the furnace. The nitrogen gas was passed through O2
and humidity traps before entering the system. The temperature was set to 170°C, which is the average anode paste (mixture of aggregate and pitch) temperature used in industry during mixing. At 170ºC coke will not catch fire, since this temperature is much lower than the auto- ignition temperature of coke. However, there will be loss of coke in presence of oxygen due to formation of CO and/or CO2. The images of the pitch drop on the coke bed were saved at each predetermined time interval, and the contact angles were calculated at different times using the software FTA-32. Further information about the sessile-drop system was published elsewhere [5, 14, 15]. Each experiment was repeated twice, and the average of the contact angles measured during these two experiments was used for the analysis. If the contact angle value at a certain time differed by more than 5°, the experiment was repeated.
2.4. Fabrication of laboratory anodes
A measured quantity of dry aggregate (modified or non-modified) was mixed with molten coal tar pitch in a mixer to form the anode paste. The dry aggregate contains calcined petroleum coke,
butts, green and baked rejects of certain granulometry (measured quantity of coarse, medium and fine particles) [15]. The paste temperature was maintained at around 170°C. The paste was compacted in a vibro-compactor for one minute. Green anodes (nearly 10 kg) of rectangular cross-section were obtained from the vibro-compactor mould. Four cylindrical cores of 50 mm in diameter were cut from the green anode [14, 15]. The density and the electrical resistivity of the green cores were measured. Two of the cores (same positions for all the anodes) were baked in a baking furnace using a heating rate (11ºC/h) similar to that used in the industry. The final baking temperature was 1100°C. After reaching 1100ºC a soaking time of 8 h was applied. These baked cores were used for further studies. A detailed description of the anode manufacturing process and the baking conditions was published elsewhere [14-16].
2.5. Characterization of Anode Properties
The density and electrical resistivity of the green anode samples (GAD, GER) (φ50 x 130 mm) were measured according to ASTM D5502-00 (2015) and ASTM D6120-97 (2012), respectively.
The density was measured by dividing the mass of the sample by the volume.
The resistivity (ρ) of the cores was measured by the four-point method. The resistivity of the core was calculated using Equation 2.
ρ= V I
A L
(2 ) where, A is the cross-sectional area and L is the distance between the points where voltage drop V was measured for a current I. In this case L was 100 mm.
The density, electrical resistivity, and flexural strength of the baked cores (BAD, BER) (φ50 x 130 mm) were measured based on ASTM D5502-00 (2015), ASTM D6120-97(2012), and ISO N 848, respectively. The flexural strength of the baked cores was measured by 3 point bending method using Instron. The flexural strength (σ) was calculated using Equation 3.
σ = Fl ( d /2 )
3(3 ) where, d is the diameter of the sample, l is the separation of two blocks and F is the maximum force.
Then, two φ50 x 50 mm samples were cut (one from the top and another from the bottom) from one of the baked cores (same for all the anodes). The φ50 x 50 mm sample from the top was used for air reactivity measurement (ASTM-D6559-00a), and the sample from the bottom was used for CO2 reactivity measurement (ASTM-D6558-00a). During the reaction, the binder phase (carbonized pitch and coke fines) is usually consumed faster compared to the filler (coarser coke particles). This differential oxidation results in the loss of binder between the coarse coke particles. Consequently, these particles fall in the electrolytic cell; this phenomenon is called dusting. The dusting was also measured for the reactivity studies. The reactivities of the samples were measured using a thermogravimetry equipment (Carbolite TVS 12/600 furnace and Mettler toledo model XS2002S balance) available at UQAC. The reactivity and dusting were measured based on the standard procedures (3 h at 525°C for air reactivity, 7 h at 960°C for CO2 reactivity, gas flow rate 2.2 l/min). The detailed descriptions of the characterization methods were published elsewhere [15].
3. Results and Discussion
3.1. FT-IR Results
Wetting of coke by pitch can be physical and/or chemical. The physical interaction is controlled by the surface texture and porosity of coke, and viscosity of pitch. The chemical interaction is controlled by the functional groups present in coke and pitch. As same pitch was used in the study, the physical and chemical properties of pitch did not change. Similarly, since the same coke was used, the surface texture and porosity of coke did not change. The treatment of coke by the additives modifies the chemical nature of the coke surface. Thus the property that might change due to the treatment of coke is the functional groups on the coke surface. There are different techniques (such as x-ray photoelectron spectroscopy, nuclear magnetic resonance spectroscopy etc.) to identify and estimate the functional groups. However these methods are costly. FT-IR spectroscopy is a simple, low-cost method for the estimation of these groups, with the available portable FT-IR, this method can be easily utilized in the industry. Thus, in this study the focus was on FT-IR. As the wettability of treated coke by pitch was controlled by the chemical functional groups on the coke surface, the effort was made to correlate the wettability of coke by pitch with the FT-IR results. So far no quantitative study has been reported to correlate the wettability and FT-IR results.
FT-IR spectra can give an idea of the presence of different functional groups in a sample. FT-IR spectra are usually analyzed based on certain fingerprint regions, which are unique to certain functional groups. Due to the presence of different neighboring molecules, steric hindrances, position, and orientation of the functional groups, there might be some shifts in their rotational, vibrational, and stretching energies. These energies correspond to the wavenumbers in the FT-IR
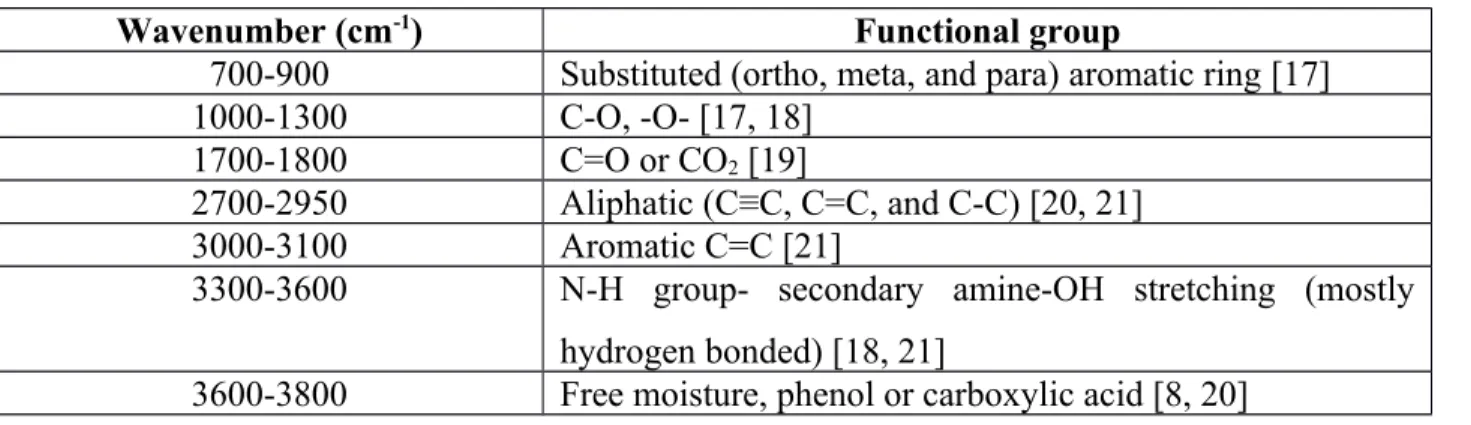
spectra. Table 2 lists the ranges of wavenumbers for certain functional groups. Thus, a peak in that range will represent the specific functional group.
Table 2: List of functional groups in calcined coke from FT-IR study
Wavenumber (cm-1) Functional group
700-900 Substituted (ortho, meta, and para) aromatic ring [17]
1000-1300 C-O, -O- [17, 18]
1700-1800 C=O or CO2 [19]
2700-2950 Aliphatic (C≡C, C=C, and C-C) [20, 21]
3000-3100 Aromatic C=C [21]
3300-3600 N-H group- secondary amine-OH stretching (mostly hydrogen bonded) [18, 21]
3600-3800 Free moisture, phenol or carboxylic acid [8, 20]
For FT-IR spectra using KBr pellet, it is difficult to correlate the peak area with the concentration of the functional group due to the probability of non-homogeneous distribution of the KBr sample and the interaction of the sample with the laser beam. Some researchers normalized the FT-IR spectra based on a certain reference peak [22]. However, this method is difficult to apply in the case of coke and pitch samples. Thus, the absolute value of peak area might not give a reasonable idea of the concentration of a specific functional group in coke or pitch samples. The ratio of two different peak areas can be used to avoid the problem. This ratio can give an idea of the relative amount of a particular functional group. Whatever be the method of analysis, FT-IR peaks indicate the presence of different functional groups.
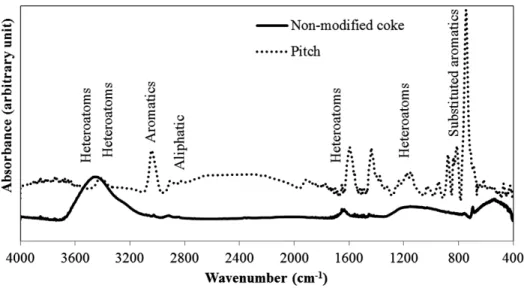
Figure 1 shows the FT-IR spectra of the non-modified coke and pitch. The spectra show that both coke and pitch contain aromatic and aliphatic functional groups (see Table 2). They also contain heteroatom (O and N) containing functional groups (see Table 2). Aliphatic functional groups do not facilitate the coke-pitch interactions due to the steric hindrances of the long aliphatic chains [15]. Aromatic rings have negatively charged ∏-electron cloud. The electron cloud can form electrostatic bonds with positive centers (such as quaternary ammonium species).
Electronegative atoms (such as O and N) attached to hydrogen pulls the electron cloud towards them making hydrogen positively charged. These hydrogen atoms can form hydrogen bond with other electronegative atoms. Two molecules can undergo condensation reactions through the elimination of small molecules (such as water or ammonia). Acid-base reaction can also take place between an acidic functional group (phenolic –OH and pyrrole) and a basic functional group (amine, and pyridine). FT-IR analysis cannot detect the presence of the specific compounds such as pyridine, pyrrole, etc. However, earlier studies showed that the presence of different functional groups necessary to form different types of bonds in coke and pitch samples can be detected using FT-IR [14, 15]. It has also been explained that these types of bonds can take place between coke and pitch. Detailed study of these compounds needs XPS analysis [14, 15], which is a costly procedure. The objective of this study was to develop criteria for the extent of wettability, which can be applied in industry. FT-IR is a simple technique, and low-cost hand- held FT-IR analyzers are available in the market. Therefore, the functional groups were analyzed using only FT-IR analysis in this study. The FT-IR results showed the presence of aromatic, aliphatic, and heteroatom-containing functional groups in both coke and pitch, which can help coke-pitch interactions. A functional group in coke can bind with the complementary functional group in pitch. Depending on the source and process conditions, the quality of pitch and coke,
which depends on the amount of functional groups available on the surface, may vary. Low amounts of aromatics and heteroatom-containing functional groups result in poor coke-pitch interactions. The amounts of these functional groups may vary in different coke and pitch samples. Thus, the focus of this work was on the addition of chemicals (additives) containing these functional groups. The additive binds the functional groups of coke and/or pitch and initiates the interaction between them, resulting in improved wetting. Improvement of the wettability of coke by pitch can help improve anode quality [14, 15].
Figure 1: FT-IR spectra of non-modified coke and pitch
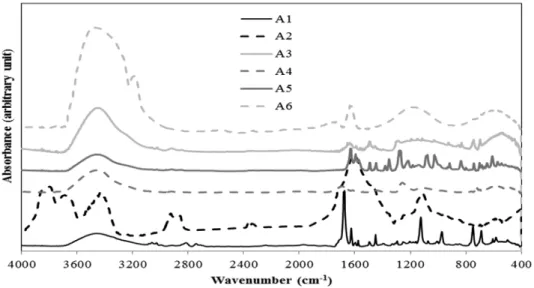
Six chemicals were chosen to modify coke based on the presence of aromatics and heteroatom- containing functional groups. The FT-IR spectra of the pure chemicals were analyzed. It is possible that the functional groups of the chemicals may not react with the functional groups of the coke. If there is no chemical reaction, then the FT-IR spectra of the modified coke will be a weighted sum of the FT-IR spectra of the non-modified coke and the pure additive. If x wt% of additive is mixed with coke and yc and ya are the absorbances of the FT-IR spectra
that wavenumber if there is no reaction) [23]. Thus, the FT-IR spectra of non-modified coke and the pure additive chosen were added based on the percentages of the two components. These spectra will be referred as total spectra in the text. The total spectra are presented in Figure 2 for the different additives. The spectra show the presence of aromatic, aliphatic, and heteroatom- containing functional groups (see Table 2). These spectra show the peaks corresponding to the functional groups of the non-modified coke as well as those of the pure additives. It does not show any new peak or changes in any peak due to interaction.
Figure 2: FT-IR analysis of total spectra of non-modified coke and pure additives
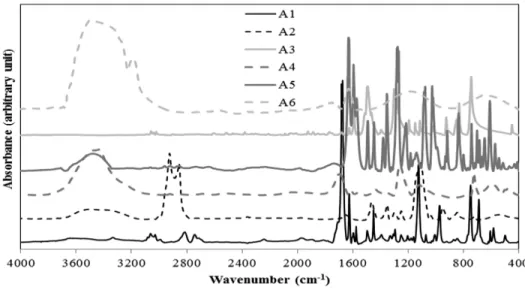
Figure 3 presents the FT-IR spectra of the coke samples modified using the different additives.
These spectra also show the presence of aromatic, aliphatic, and heteroatom-containing functional groups (see Table 2). However, the total spectra (the weighted sum of the spectra of unmodified coke and the spectra of the additive) differed significantly from the spectra of the modified coke shown in this figure. Some new peaks appeared, and the shape and size of some other peaks changed. This shows the presence of interaction between the coke and the additive.
The modified coke samples did not show significant changes in the aromatics region (3000-3100
FT-IR for the additive A6 shows significant difference compared to those for the other additives.
This might be due to the water present in A6. However, the total spectra and spectra for coke modified by A6 were similar. Thus it can be assumed that A6 did not create new bonds. The variations in the peaks corresponding to the aliphatic were not important in terms of the improvement of wettability of the coke by pitch. Some changes were observed related to the substitution reaction of the aromatic ring (750-900 cm-1). These bonds might form due to condensation reactions between heteroatom-containing functional groups. There are significant differences in the regions for heteroatom containing functional groups (1000-1300 cm-1, 1700- 1800 cm-1, 3300-3600 cm-1, 3600-3800 cm-1). In spite of the fact that 3600-3800 cm-1 can give some information about phenolic OH and carboxylic acid, this region shows the presence of moisture. Thus, this region was not considered in the study. Also, 1700-1800 cm-1 region shows the presence of carbonyls. As this region can show a peak belonging to carbon dioxide, this region was not considered in the analysis. Background correction can reduce the presence of CO2, but it is difficult to eliminate the peak of CO2. Thus, the analysis of heteroatom containing functional groups was restricted to two wavenumber ranges: 1000-1300 cm-1 and 3300-3600 cm-
1.
Figure 3: FT-IR analysis of cokes modified using different additives
The region of 1000-1300 cm-1 represents primary alcohol/secondary alcohol/ether while the surface functional groups in the region of 3300-3600 cm-1 represent mostly hydrogen bonded OH and NH. It may be noted that ether shows peak at around 1000-1300 cm-1 but does not show peak at 3200-3700 cm-1. It should also be kept in mind that for a vibrational mode to be infrared active the motion must cause a change in the dipole moment of the molecule. Thus an absence of peak in 3200-3700 cm-1 region (as seen for coke treated with additive A3) can happen due to presence of ether group or symmetrical vibrations. The functional groups in the range of 3300-3600 cm-1 can also show inter/intra molecular hydrogen bonding [5]. The hydrogen bonded species are not free to bind with the pitch. The functional group of the additive will bind with the complementary functional group of coke. The additives were chosen in such a way that they have minimum two functional groups. One functional group can interact with coke, while the other can interact with pitch. The additive acts as a bridge between coke and pitch.
There is no existing quantitative relation between FT-IR and wettability results. Thus in this work some ratio was explored to identify relation between the FT-IR and wettability results. The
calculated for each sample. Then, the value of (Area1 / (Area1 + Area 2)) ratio was calculated.
This gives an idea of the primary alcohol/secondary alcohol/ether functional groups in the sample which might not have formed hydrogen bond. This ratio was calculated to find a quantitative criterion for selecting the additive. Other ratios were tried; however, no other ratio, which can be correlated to coke-pitch interactions, was found. An assumption was made that a high value of this ratio is an indicator for improved coke-pitch interaction. Improved interaction can enhance the wettability of coke by pitch.
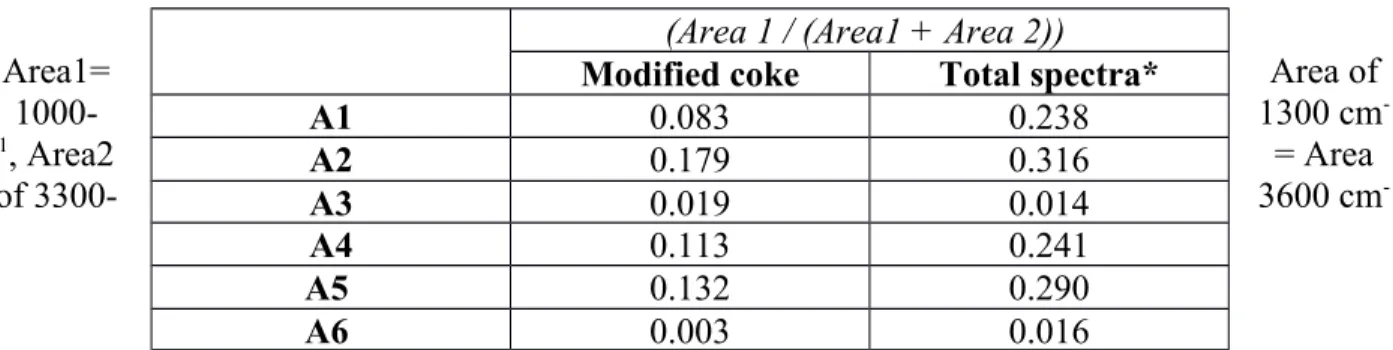
Table 3 shows the value of the ratio for modified coke and the total spectra. The results showed that the values were significantly different for all the cases except that for A3. The similarity in the values for A3 indicates that there was practically no interaction between the additive and the functional groups of coke. For all the other cases, there was interaction between the functional groups of the additive and coke.
The value of the ratio for the modified coke signifies the quality of wetting. As mentioned earlier, a high value will indicate the availability of heteroatom containing functional groups capable of binding with pitch. Thus, the results show that A3 and A6 have low values and will not likely improve the wettability of coke by pitch. On the other hand, A1, A2, A4, and A5 have high values, and it is possible that they can improve the coke wettability.
Table 3: Ratios calculated from FT-IR results
Area1= Area of
1000- 1300 cm-
1, Area2 = Area
of 3300- 3600 cm-
(Area 1 / (Area1 + Area 2)) Modified coke Total spectra*
A1 0.083 0.238
A2 0.179 0.316
A3 0.019 0.014
A4 0.113 0.241
1
*weighted sum of the spectra of unmodified coke and the spectra of the additive
3.2. Wettability
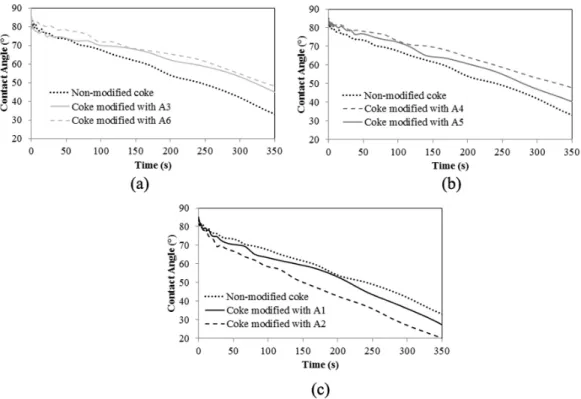
Wettability experiments were carried out using the sessile-drop system. The contact angle was measured with respect to time. The contact angle decreased with increasing time for all the samples as expected. FT-IR study showed that A3 and A6 do not improve wettability, and it can be seen from Figure 4a that they showed poor wettability (higher contact angle) compared to that for the non-modified coke. Also, FT-IR study indicated that A1, A2, A4, and A5 can improve the wettability of coke by pitch (Figure 2 and Table 3). Figure 4b shows that A4 and A5 reduced the wettability of the modified cokes compared to that for the non-modified coke, but as it can be seen from Figure 4c, A1 and A2 improved the wetting behavior of the modified cokes (lower contact angle). The actual reason for the discrepancy between the wettability and the FT-IR results is hard to determine experimentally. The effect of the functional groups and the area ratio on wettability is a hypothesis. One way to validate this effect is to carry out wettability tests at room temperature. However, it was not possible as pitch is solid at room temperature and melts at around 170ºC. Also, molten pitch dropped on cold coke bed will solidify making it impossible to perform the wettability study. Thus, an analysis was performed to identify the reason for the discrepancy based on experimental observations. It was observed that A1 and A2, which improved the wettability of the modified coke, had a low melting point (liquid (A1) or was in aqueous suspension form (A2) at room temperature) and had high boiling points (see Table 1).
Their boiling points are higher than 170°C. A4 has a high melting point as well as a high boiling point, and it showed poor wetting behavior. Therefore, high melting point of the additive might be the reason for the poor wettability of the modified coke prepared with this additive. A5 has a high melting point but a low boiling point and resulted in poor wettability of the modified coke.
It may be noted that after the wettability study with coke modified by A5 some white residue
additive A5 might have evaporated. Accordingly, in this case, poor wettability can be attributed to the high melting point and the low boiling point. Low melting point of the additive will help liquefy the additive and distribute homogeneously on the coke surface. Hence, liquid (A1) and aqueous suspension additives (A2) spread evenly on the coke surface compared to that for solid additives (A4 and A5). On the other hand, boiling point higher than 170°C will reduce the rate of vaporization of the additive from the coke surface. Thus, high boiling point of the additives helped improve the wettability of the cokes modified with A1 and A2. Based on the experimental observations it can be seen that an additive with a low melting point and a high boiling point (above the mixing temperature) can improve the wettability of coke. The additive should also have high value of (Area 1 / (Area1 + Area 2)) ratio obtained from the FT-IR analysis.
It may be noted that A5 and A6 have boiling point lower than 170ºC. The vaporization of these additives (A5 and A6) cannot justify the reduction in wettability of the modified cokes. If the additive simply leaves the coke surface, the wettability of the modified coke will be the same as that for the non-modified coke. Figures 4b and 4c show that this did not happen; the wettability of the modified cokes was less (higher contact angle at a given time) than that of the non- modified coke. This is possible if the additive A5 and A6 modified the coke surface before leaving the coke matrix. Thus the removal of the additives from the coke surface might be associated with chemical reactions that degraded the wettability of the coke surface. The functional groups of the additives can form bonds with the functional groups of the coke particles. As the additives contained heteroatom-containing functional groups, there is the possibility of condensation reactions. During condensation reactions, small molecules such as water or ammonia are released [24]. These losses might reduce the number of heteroatoms of the non-modified coke surface. Thus, the loss of additive will result in a coke surface with low heteroatom content. Fewer heteroatoms will reduce the wettability of the coke surface. The poor wettability of coke modified by the high melting point additive (A3 and A4) might be due to non-homogeneous distribution of the additive in the coke matrix. Another explanation can be removal of water of crystallization (removal of OH) or decomposition of the additive at 170ºC.
Crossey [25] found that oxalate (which is a dicarboxylate species similar to A4) can dissociate at even 180ºC following a first order kinetics with a rate constant of 0.0168 h-1. Thus there is a possibility of decomposition resulting in loss of functional groups. This may decrease the wettability of the coke by pitch. This section discussion is based on a number of assumptions and observations, as it is difficult to prove experimentally.
Figure 4: Wettability results for non-modified coke and cokes modified with additives (a) A3 and A6, (b) A4 and A5 and (c) A1 and A2
3.3. Effects of Additive on Anode Properties
Based on the FT-IR and wettability studies, it was found that A1 and A2 can improve the wettability of coke by pitch. It is true that A2 improved the wettability more than A1 (see contact angle at 350 s). However, for anode fabrication, A1 was chosen as its price was lower compared to that for A2. In addition, A2 was no longer available (the production of this chemical stopped) at this point of the study. A1 was a safer choice over A2 as it does not pose any serious health hazard (see Table 1). Another anode was fabricated with (poor wetting) coke modified using A6.
The major issue of this anode fabrication with this coke was the release of considerable amount of acidic vapor during coke preheating.
Anodes were produced using non-modified coke and the coke modified with A1 and A6 to see the effect of additive on anode properties. All other raw materials and fabrication conditions
were maintained the same. Any change in the anode properties can then be attributed to the additive.
As described earlier, cylindrical samples were taken from the green anodes and characterized.
The cores were baked and characterized again. The properties of anodes made of non-modified and modified cokes were compared in order to study the effect of additive on anode properties.
3.3.1. Green and Baked Anode Density
A good quality anode requires high green (GAD) and baked (BAD) anode density. The anodes with high GAD will result in anodes with high BAD if the baking conditions were optimal.
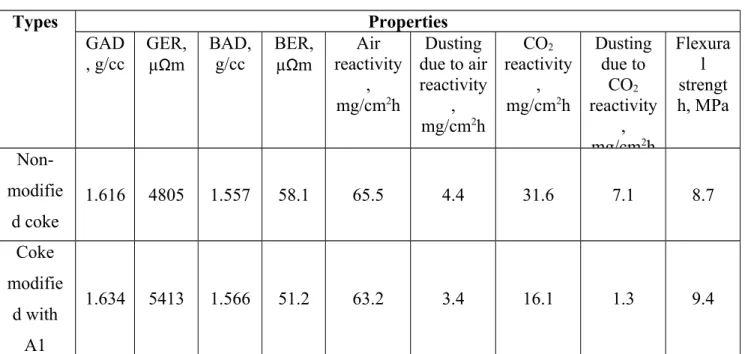
However, anodes with low GAD will never give anodes with high BAD. The anode produced using A6 modified coke had low GAD (1.442 g/cc) compared to that for non-modified coke (1.616 g/cc). Due to the low GAD the anode was not baked for further analysis. This anode proved that the additive A6 had negative effect on anode property. Table 4 shows the GAD and BAD for the two anodes (non-modified coke and A1 modified coke). It can be seen from the Table 4 GAD and BAD of anode increased after modification of the coke with the additive. It was observed from the wettability results that A1 increased interaction between coke and pitch.
This additive modified the coke particles and allowed the pitch to penetrate into the coke pores as well as inter-particle spaces easily. Better interaction between the coke and the pitch helped produce a denser anode. For a 1000 kg anode (approximate weight of industrial anodes used for over 300 kA cells), an increase in BAD by 0.01 g/cc can increase the carbon content by around 6 kg/anode. This will increase the anode life.
3.3.2. Electrical Resistivity
Another parameter, which is important for anode quality, is electrical resistivity. Electrical resistivity of baked anode should be low to reduce the energy cost. Usually if the density is high, electrical resistivity is low. Since dense anode has less porosity, current can pass easily through the sample.
Table 4 showed that the green anode resistivity (GER) was higher for the anode made with the modified coke compared to that for the one made with non-modified coke. The baked anode resistivity (BER) showed the opposite trend. Pitch, before baking, has high electrical resistivity.
Thus, a layer of pitch between the particles can result in high GER. After baking, the carbonized pitch has low resistivity. Hence, carbonization of this pitch layer might reduce BER. BER decreased for the anode after modification of coke by A1. It may be noted that decrease in BER by 1 µΩm may reduce the energy consumption by 0.1%. Considering the volume of aluminum production, this can result in significant amount of energy saving for the industry.
3.3.3. Air and CO2 Reactivity
The theoretical amount of carbon required to produce 1ton aluminum is 334 kg. Carbon is oxidized to CO2 during the electrolytic production of aluminum. This CO2 reacts with the anode inside the cell to produce CO. Air can also react with the exposed surface of the anode to produce CO2. This additional consumption of anodes due to air and CO2 reactivities, and dusting results in excess carbon use increasing the total carbon consumption to more than 400 kg carbon per ton of aluminum. Reactivity of anode is thus related to excess anode consumption and emission of greenhouse gases. High reactivity means that air and CO2 react more with anode.
Table 4 shows that the addition of A1 decreased the air and CO2 reactivities as well as dusting.
Reactivity of anode depends on density. Since higher anode density implies presence of less
porosity, air and CO2 could not diffuse easily into the anode. Air usually reacts with any carbon material at high temperature. Researchers have different opinions on the effect of anode density on air reactivity. Sarkar [15] found that the reactivity can increase with increase in anode density whereas Wang et al. reported the opposite trend [26]. For the same coke pitch-pair significant increase in anode density might have reduced the exposed surface area as well as diffusion of air into the matrix of the sample. It is also possible that A1 played a role in reducing the air reactivity. Further study is required to determine the mechanism. Lower reactivity of the anode resulted in lower dusting. On average, the reduction in reactivity or dusting by 1 mg/cm2h in a one-ton anode reduces carbon consumption by around 10 kg/anode. This can, in turn, reduce the CO2 emission by around 35 kg/anode.
3.3.4. Flexural Strength
The three-point bending test was carried out to measure the flexural strength of the anodes. The results showed (Table 4) that the flexural strength of the anode, which was produced using modified coke, was higher than that for the anode produced using non-modified coke. Addition of A1 improved this mechanical property of the anode.
Table 4. Comparison of properties of anodes made with non-modified coke and coke modified by A1
Types Properties
GAD , g/cc
GER, µΩm
BAD, g/cc
BER, µΩm
Air reactivity
, mg/cm2h
Dusting due to air reactivity
, mg/cm2h
CO2
reactivity , mg/cm2h
Dusting due to
CO2
reactivity , mg/cm2h
Flexura l strengt h, MPa Non-
modifie d coke
1.616 4805 1.557 58.1 65.5 4.4 31.6 7.1 8.7
Coke modifie
d with A1
1.634 5413 1.566 51.2 63.2 3.4 16.1 1.3 9.4
4. Conclusions
The results showed that the additive should have heteroatom containing functional groups to enhance interaction between coke and pitch. The ratio of peak areas measured from the FT-IR spectra can be an indicator of the effectiveness of the additive in improving the wettability of a coke. The additive should have a low melting point and a high boiling point. Two additives (A1 and A2) were identified, which can improve the coke-pitch interactions. A1 was chosen based on the results and price as well as the availability of the additive. Two anodes were produced using this additive. The modification of coke by A1 increased the green and baked anode densities as well as flexural strength. It also decreased the specific electrical resistivity, the air and CO2 reactivities, and dusting.
The quality of raw materials plays an important role to produce good quality anodes. This study shows that the use of additives chosen based on certain criteria can improve anode properties. In
this case, anode properties were improved without changing any process parameters. Thus, this method can be applied in the industry using the existing facilities.
5. ReferencesX1.Radenovic A. Properties of carbon anode components for aluminium production. Nafta 2012; 63(3-4): p. 111-114.
2. Fernandez R. Petroleum coke, grades and production, CarboMat Seminar Trondheim:
2003.
3. Hulse KL. Anode Manufacture, raw materials formulation and processing parameters.
New Zealand: R&D.
4. Adams AN, Schobert HH. Characterization of the surface properties of anode raw materials. TMS Light Metals. 2004.
5. Sarkar A, Kocaefe D, Kocaefe Y, Sarkar D, Bhattacharyay D, Morais B, et al. Coke–
pitch interactions during anode preparation. Fuel 2014; 117, Part A(0): p. 598-607.
6. Abdallah W, Buckley J.S, Carnegie A, Edwards J, Herold B, Fordham E, et al.
Fundamentals of wettability. Oilfield Review, 2007; 19(2).
7. Jung YC, Bhushan B. Wetting behavior of water and oil droplets in three-phase interfaces for hydrophobicity/philicity and oleophobicity/philicity†. Langmuir 2009;
25(24): p. 14165-14173.
8. Jiang B, Zhang Y, Zhou J, Zhang K, Chen S. Effects of chemical modification of petroleum cokes on the properties of the resulting activated carbon. Fuel 2008; 87(10–
11): p. 1844-1848.
9. Rocha VG, Granda M, Santamaria R, Blanco C, Diestre EI, Menendez R. Pyrolysis behaviour of pitches modified with different additives. Journal of Analytical and Applied Pyrolysis 2005; 73(2): p. 276-283.
10. Rocha VG, Granda M, Santamaria R, Blanco C, Diestre EI, Menendez R. Improvement of pitch/coke iteractions by addition of surface tension modifiers. Instituto Nacional del
11. Rocha VG, Blanco C, Santamaria R, Diestre EI, Menendez R, Granda M. The effect of the substrate on pitch wetting behaviour. Fuel Processing Technology 2010; 91(11): p.
1373-1377.
12. Rocha VG, Blanco C, Santamaria R, Diestre EI, Menendez R, Granda M. Pitch/coke wetting behaviour. Fuel 2005; 84(12-13): p. 1550-1556.
13. Starovoit A and Maliy Y. Research of polymeric additive influence of organic composition on thermochemical conversion of carbon masses. Chemistry & Chemical Technology 2008; 2(1): p. 69-73.
14. Lu Y. Effect of pitch properties on anode properties. University of Quebec at Chicoutimi:
Canada, Master thesis, 2016.
15. Sarkar A. Effect of coke properties on anode properties. Univesity of Quebec at Chichoutimi: Canada, PhD thesis, 2015.
16. Amrani S. Impact de la préparation des anodes crues et des conditions de cuisson sur la fissuration dans des anodes. University of Quebec at Chicoutimi (UQAC): Canada, PhD thesis, 2015.
17. Menendez JA, Pis JJ, Alvarez R, Barriocanal C, Fuente E, Diez MA. Characterization of petroleum coke as an additive in metallurgical cokemaking. Modification of thermoplastic properties of coal. Energy & Fuels 1996: 10(6): p. 1262-1268.
18. Guillen MD, Iglesias MJ, Dominguez A, Blanco CG. Semi-quantitative FTIR. Analysis of a coal tar pitch and its extracts and residues in several organic solvents. Energy & Fuel 1992; 6(4): p. 518-525.
19. Alcañiz-Monge J, Cazorla-Amorós D, Linares-Solano A. Characterisation of coal tar pitches by thermal analysis, infrared spectroscopy and solvent fractionation. Fuel 2001;
80(1): p. 41-48.
20. Wazir AH and Kakakhel L. Preparation and characterization of pitch-based carbon fibers.
New Carbon Materials 2009; 24(1): p. 83-88.
21. Manocha LM, Patel M, Monacho SM, Vix-Guterl C, Ehrburger P. Carbon/carbon composites with heat-treated pitches: I. Effect of treatment in air on the physical
characteristics of coal tar pitches and the carbon matrix derived therefrom. Carbon 2001;
39(5): p. 663-671.
22. Huang X, Kocaefe D, Kocaefe Y, Boluk Y, Krause C. Structural analysis of heat-treated birch (Betule papyrifera) surface during artificial weathering. Applied Surface Science 2013; 264: p. 117-127.
23. Klempner D. Polymer Alloys III: Blends, blocks, grafts, and interpenetrating networks.
24. Morrison RT, Boyd RN. Organic chemistry. 6th ed. New Jersey: Prentice-Hall, Inc; 1992.
25. Crossey LJ. Thermal degradation of aqueous oxalate species. Geochimica et Cosmochimica Acta, 1991; 55: p. 1515-1521.
26. Wang YW, Peng JP, Di YZ, and Feng NX. Production of carbon anodes by high- temperature mould pressing. Transactions of Nonferrous Metals Society of China 2013;
p. 3119-3124.
List of Figures:
Figure 1: FT-IR spectra of non-modified coke and pitch
Figure 2: FT-IR analysis of total spectra of non-modified coke and pure additives Figure 3: FT-IR analysis of cokes modified using different additives
Figure 4: Wettability results for non-modified coke and cokes modified with additives (a) A3 and A6, (b) A4 and A5 and (c) A1 and A2
List of Tables:
Table 1: Properties of the additives
Table 2: List of functional groups in calcined coke from FT-IR study
Table 4: Comparison of properties of anodes made with non-modified coke and coke modified by A1