En vue de l’obtention du
DOCTORAT DE L’UNIVERSITÉ DE TOULOUSE
Délivré par
Institut National Polytechnique de Toulouse (INP Toulouse) Discipline ou spécialité
Hydrologie, Hydrochimie, Sol, Environnement
Présentée et soutenue par Lobat TAGHAVI Le 28 septembre 2010
Titre
Dynamique de transfert des pesticides en périodes de crue sur les bassins versants agricoles gascons
Mme Hélène BLANCHOUD, Maître de conférences UPMC, CNRS, EPHE, Paris, examinatrice Mme Hélène BUDZINSKI, Directrice de Recherche CNRS, ISM, LPTC, Talence, rapporteur
M. Georges MERLINA, IR INP Toulouse, EcoLab, co-directeur de thèse M. Eric PINELLI, Professeur INP Toulouse, EcoLab, Président
M. Jean-Luc PROBST, Directeur de Recherche CNRS, EcoLab, Toulouse, Directeur de thèse M. Marc VOLTZ, Directeur de Recherche INRA, LISAH, Montpellier, rapporteur
Ecole doctorale
Sciences de l’Univers, de l’Environnement et de l’Espace (SDU2E)
Unité de recherche
EcoLab, UMR 5245, Laboratoire d’Ecologie Fonctionnelle Directeur(s) de Thèse
M. Jean-Luc PROBST M. Georges MERLINA
To my Divine Protector
To My
To My
To My
To My Dear Parents
Dear Parents
Dear Parents
Dear Parents
I would like first to thank my PhD directors, Professor Jean-luc PROBST and Dr. Georges MERLINA for their trust and belief in me during my PhD program at INPT (EcoLab). They, in fact, opened my eyes to a new world with their high level of knowledge of the study subject. I thank them for their invaluable advice and supervision.
I wish to express my gratitude to the members of the PhD committee for their valuable time to review my thesis and for their comments.
My very special thanks go to Madame Annick CORREGE, the secretary of EcoLab and my “French mother”, for her encouragement and support each time I was feeling down. I definitely owe a debt of gratitude to her.
During the field and laboratory works, I received important technical support from Mr Gael DURBE, Dr. Vincent ROUSSIEZ and Dr. Frederic BRUNET to whom I would like to express my gratitude.
I would like to appreciate my friends who gave me tremendous moral support during the week of exceptional anxiety and excitement, the week before my thesis defense. A very specific thank go to Floriane BOURDIOL, Desiree EL AZZI, Christine JULIEN, Thierry POLARD, Roman TEISSERENC, Muhammad SHAHID, Julien ARROYO and all of my friends in laboratory for their great kindness. They provided me with helpful moments that I cherish for ever.
I would like to express my cordial thanks to my colleague Dr. Christophe LAPLANCHE for the help and availability he offered me.
I can never forget the sincere friendship and love of my colleagues in EcoLab laboratory. I would like to express my deepest thanks and profound gratitude to all of them.
I want to express my deepest gratitude towards my colleagues in TANDEM laboratory for their kindness.
I would like to give special thanks to my aunt, Madame Brigitte Chevrin for her moral support and encouragement.
And the most special thanks to my uncle, Dr. Seyf EHDAIE for his help, support and encouragement. I am indebted to him for everything he taught me.
And last, but not least to those who are the most important people in my life, my parents, and my sisters, Afsoon, Afshan, Leila and my brother-in-law (Mr Hamid SAKHAIE, Mr Reza MASHAKZADEH and Mr Maziar SHALAHI). I say thank you and I love you all. Also I need to mention that the propensity and love go to back to my country to embrace the joys of my life, my nephew and nieces, Saman, Nazanin and Hania always gave me a sense of courage and stamina.
The mechanisms of pesticides transport to stream flow were studied in two agricultural nested catchments of different size in Gascogne region (South West of France): the Save river basin at Larra (1110 km2) and the Montoussé experimental watershed at Auradé (3.28 km2). The intensive agricultural practices used in this region lead to an important risk for water resources by pesticides, especially during storm events. This is why we have paid special attention on storm events when a large quantity of contaminant was transported during hydrological periods. Fourteen molecules of pesticides (herbicides and fungicides) were investigated during the study period. Both of these groups are widely used for agricultural purposed in these catchments.
The results achieved over the two years monitoring (2007-2009) enable us to emphasize the principal processes, implied in pesticide transfer on these agricultural catchments. The majority of compounds are detected during storm runoff events. And, the average concentrations of some pesticides are exceeded at the authorization limit of the European Union for pesticide concentrations in drinking water (0.1 µg.L-1 for individual pesticides and
0.5 µg.L-1 for total pesticides).
To better understand the mechanisms of pesticide transport hysteresis, patterns on the concentration-discharge relationship (result of different concentration of pesticides in rising and falling limb of storm) were studied. However, clockwise or anticlockwise hysteresis patterns could be observed for some molecules of pesticide and their controlling factors such as dissolved organic carbon (DOC), particulate organic carbon (POC) and total suspended matters (TSM) according to their transfer dynamic in the catchment. We proceeded with hydrograph separation of the main stormflow components (surface runoff, subsurface flow and groundwater) so that the main pesticide routing could be traced for its soil-river transfers. We also came to the conclusion that there is a positive relationship between riverine TSM, DOC and pesticide, concentrations and the discharges of surface or subsurface runoffs according to pesticide properties. Pesticide flux calculation shows between 60 to 90% of the molecule transport takes place during storm periods. Specific flux calculation also demonstrated the higher flux value in Save catchment than in Aurade with higher pesticide concentration for a given specific discharge. The latter result may be due to the more consumption of pesticide in Save catchment. The analyses of pesticides both in filtered and unfiltered water enabled us to estimate the distribution of pesticides into particulate and dissolved phases. Moreover, the pesticide flux values allow calculating average partition coefficients kd between dissolved and particulate fractions which present good relationship
with Kow values (octanol-water) extracted from literature. The percentage of each pesticide
transported as particulate forms is also well correlated to Kow.
Table of contents
General Introduction
21Chapter 1 Pesticide in the environment (Literature review)
29I: Pesticide history, classification, market and use 29
1 General knowledge 29
1.1 Pesticides’ definitions 29
1.2 Historical context of pesticide use 30
1.3 Pesticides classification 32
1.3.1 Classification based on chemical structure: inorganic, organic
and botanical
32
1.3.2 Classification and active chemicals 33
1.3.3 Classification and pesticide - specifity 33
1.4 The Market for pesticides (Current Status) 35
1.5 Pesticide usage and consumption 36
1.5.1 General context 36
1.5.2 National context 36
1.5.3 Regional context 36
II: Pesticide’s movement 39
2 Transfer of Pesticide 39
2.1 Pesticide life cycle 39
2.2 Behavior and fate of a pesticide in the environment 40
2.2.1 Transformation processes 40
2.2.2 Transport processes 41
2.2.3 Retention 41
2.3 Most important factors playing a major role in the fate of pesticides in detail 43
2.3.1 Pesticides properties 43
2.3.2 Chemical properties 45
2.3.3 Climatic factors 46
2.3.4 Soil and geologic properties 46
2.4.2 Stormwater 50
2.5 Principal parameters in pesticide’s transfert 51
2.5.1 Organic matters 51
2.5.2 suspended matters 54
2.6 Interaction between organic and suspended matters with Pesticide 54
2.7 Partitioning between dissolved and particulate phases (Kd) 56
3 Occurrence of pesticides in water 56
Summary
59Chapter II : Materials and Methods
611 Experimental Study 61
1.1 Study areas (Locations and characteristics) 61
1.2 Climate and Hydrology 63
1.3 Geological substratum and soil characteristic 63
1.4 River water composition 64
1.5 Selection of pesticide 64
1.6 Pesticide families 65
1.7 Sampling 66
2 Technical methods 67
2.1 Extraction of pesticide residues 67
2.1.1 Principle in the liquid liquid extraction 67
2.1.2 Advantage and drawbacks 68
2.2 Methods of analysis 69
2.2.1 Multiresidue analysis 69
2.2.2 GC and MS techniques 70
2.3 Chromatographic conditions and sample preparation 71
2.3.1 Condition of GC/MS 71
2.3.2 Chemical and reagents 72
2.3.3 Calibration standards 73
2.3.4 Detection limit 73
2.4 Analytical methods to measure controlling factors (COD, COP, pH, EC) 73
3 Hydrograph separation 74
3.1 Hydrograph definition 74
3.2 Different storm flow components 75
3.3 Separation of storm flow components 76
3.3.1 Limitation of hydrograph separation techniques 78
Summary
79Chapter III : Spatial and temporal variations
811 Hydrological characterization of river discharge 81
2 Spatial variation in Auradé catchment 82
2.1 Spatial variation of pesticide concentration 82
2.2 Spatial variation of controlling factors (DOC-POC-pH-EC and TSM) 84
3 Pesticide occurrence in Save and Aurade catchments 85
4 Temporal variations of pesticide concentration 89
4.1 Save river 89
4.2 Auradé catchment 95
5 Temporal variations of controlling factors (DOC, TSM, pH and EC) at the
outlet of Save and Auradé catchments
100
Summary
106Chapter IV: Contribution of different stromflow components
1091 Study of storm flow components 109
1.1 Hydrograph separation 109
2 Relationships concentration – discharge: Hysteresis phenomenon 117
2.1 TSM, DOC and POC relationships with discharge 118
2.2 Hysteresis phenomenon and pesticides molecules 124
2.2.1 Save river at Larra 125
2.2.2 Montoussé creek at Auradé 129
3 Relationships between concentration and discharge of storm flow components 129
3.1 Save catchment 130
3.2.1 Relationship between pesticide and the controlling factors with stream discharge
139
Summary
143Chapter V: Pesticide riverine fluxes and distribution between
dissolved and particulate fractions
1451 Flux Calculations 145
2 DOC and TSM fluxes 146
3 Pesticide fluxes 147
4 Specific fluxes and comparison between Auradé and Save catchments 152
5 Partitioning between dissolved and particulate phases 153
5.1 Partition coefficients 153
5.1.1 Sorption isotherms (Kd) and sorption coefficients (Koc) 153
5.1.2 Kd and Kow relation during storm period in Save and Auradé catchment
154
5.2 Relationship between log Kow and the percentage of pesticide in suspended
matter
156
6 Relationships between Kd and TSM during storm periods 160
6.1 Relationships between Kd and water discharge (QT) during storm of April 2008
in Save catchment 163
Summary
165General Conclusion
167Perspective
177Reference
179Annexes
207Figure 1- Current status of pesticide’s market by continent and by category of pesticides in
billion euros. 35
Figure 2- Distribution of pesticide market (billion euros) in Europe in 2006. 35
Figure 3- Distribution of land use in Garonne watershed. 37
Figure 4- Cycle of pesticide in the environment. 39
Figure 5- Behavior and fate of a pesticide in the environment. 41
Figure 6- Processes involved in the dispersion of a pesticide in the interaction zone with
stream flow according to (Leonard, 1990). 48
Figure 7- illustrates the occupation of soil and the location of Save and its subbasin,
Auradé in catchment. 62
Figure 8- Chemical formula of different families of pesticides. 66
Figure 9- Principle of liquid liquid extraction method (1- row water, 2- add DCM as an
organic solvent 3- recuperated DCM in an erlen as an organic phase). 69
Figure 10- Step of quantification of sample by MS. 71
Figure 11- A typical hydrograph showing the 2 flow components and the corresponding
rainfall hydrograph. 74
Figure 12- Separation of streamflow components (modified from Probst (1983, 1985,
1986), P0 (beginning of stormwater), P (initial discharge of surface water), A0
(beginning of subsurface drainage), B0 (beginning of groundwater drainage), A (initial
discharge of groundwater), B (end of the storm). 78
Figure 13- Pattern of rainfall and natural discharge variations of the Save (a) and Auradé
(b) watersheds during the study period. 82
Figure 14- Average of pesticides concentration in all of the 8 stations in unfiltered water
according to the pesticides’ family. 83
Figure 15- Principal component analysis and distribution of pesticide’s molecules in
unfiltered water in 2007 and 2009. 84
Figure 16- Spatial variation of controlling factors in Auradé catchment during 2 sampling
periods, June 2007 and June 2009. a - TSM, b – DOC, c – pH and d – EC. 85
Figure 17- Temporal variations of substituted urea family in unfiltered (above) and filtered
filtered (below) water in save river at the outlet during the period of 2007-2009. 91 Figure 19- Temporal variations of toluidine family (trifluralin and aclonifen) in unfiltered
(above) and filtered (below) water in Save river. 92
Figure 20- Temporal variations of fungicides family in unfiltered (above) and filtered
(below) water in Save river. 93
Figure 21- Temporal variations of atrazine and deethyatrazine concentration and of their ratio DEA/atrazine in unfiltered (above) and filtered (below) water in Save river. 94 Figure 22- Temporal variations of substituted urea family (clorotuloron, isoproturon and
linuron) in unfiltered (above) and filtered (below) water in the Montoussé river at
Auradé during the period 2007-2009. 96
Figure 23- Temporal variations of chloroacetanilide family (metolachlor, alachlor) in unfiltered (above) and filtered (below) water in the Montoussé river at Auradé during
the period 2007-2009. 97
Figure 24- Temporal variations of toluidine family (aclonifen,trifluralin) in unfiltered (above) and filtered (below) water in Aurade catchment during the period 2007-2009.
98 Figure 25- Temporal variation of fungicides in unfiltered (above) and filtered (below)
water in the Montoussé river at Auradé during the period 2007-2009. 99
Figure 26- Temporal variations of atrazine and deethyatrazine in unfiltered (above) and
filtered (below) water in Aurade catchment during the period 2007-2009. 100
Figure 27- Hourly discharge with temporal variation of DOC, pH and TSM, EC in the
Save river at Larra station during the period 2008-2009. 101
Figure 28- Temporal variation of DOC, pH, TSM, EC and discharge during two- years
observation (2007-2009) in the Montoussé creek at Auradé. 102
Figure 29- Relationship between TSM (left) and DOC (right) versus discharge in Save
(above) and Auradé (below) catchments. 103
Figure 30- Relationship between DOC and TSM in Save (left) and Auradé (right)
catchments. 104
Figure 31- Relationship between particulate organic carbon (POC) and total suspended
matter (TSM) in Save (above) and Auradé catchments (below). 105
Figure 32-Relationship between discharge of groundwater and total discharge of the Save
catchment. 111 Figure 34- Relationships between total discharge and the contribution (%) of groundwater
discharge for Save (left) and Auradé (right) catchments. 112
Figure 35- Relationship between subsurface water and total discharge in Save catchment. 112 Figure 36- Relationship between subsurface water and total discharge in Auradé
catchment. 113
Figure 37- Relationships between percentage of subsurface discharge and total discharge in
Save (left) and Auradé (right) catchments. 113
Figure 38- Relationships of surface runoff versus total discharge in Save (left) and Auradé
(right) catchments. 114
Figure 39- Relationships between the proportion of surface runoff with total discharge in
Save (left) and Auradé (right) watersheds. 114
Figure 40- Hydrograph separation for storm of April 2008 in Save catchment. a- volume of each component: QS: surface runoff, QSS: subsurface runoff and QG: Groundwater and red circles: sampling points. b- discharge of subsurface runoff and
total discharge. c- discharge of surface runoff and total discharge. 115
Figure 41- Hydrograph separation for storm of April (1,2) 2009 in Auradé catchment. a- volume of each component: QS: surface runoff, QSS: subsurface runoff and QG: Groundwater and red circles: sampling points. b- discharge of subsurface runoff and
total discharge. c- discharge of surface runoff and total discharge. 116
Figure 42- Relationships between discharge (m3.s-1) and Total suspended matter (TSM) in
(mg.L-1) for the Save river during the storm events. 119
Figure 43- Relationships between discharge (m3.s-1) and Total suspended matter (TSM) in
(mg.L-1) for the Auradé catchment during 4 storm events. 120
Figure 44- Relationships between DOC and total river discharge during 5 storm events in
Save catchment. 121
Figure 45- Relationships between DOC and total river discharge during 4 storm events in
Auradé catchment. 122
Figure 46- Relationships between POC and total river discharge during 5 storm events in
Save catchment. 123
Figure 47- Relationships between POC and total river discharge during 4 storm events in
unfiltered water for aclonifen and linuron during storm of April 2008 for the Save
river. 126
Figure 49- Discharge – pesticide concentration relationships: Hysteresis pattern in unfiltered (left) and filtered (right) water for metolachlor during storm of April 2008
for the Save river. 127
Figure 50- Discharge – pesticide concentration relationships: Hysteresis pattern in unfiltered water for aclonifen (left) and linuron (right) during storm of June 2008 for
the Save river. 127
Figure 51- Discharge – pesticide concentration relationships: Hysteresis pattern in unfiltered (left) and filtered (right) water for metolachlor during storm of June 2008 in
the Save river. 128
Figure 52- Discharge-pesticide concentration relationships: Hysteresis pattern for
fungicides in unfiltered water during storm of June 2008 in the Save river. 128
Figure 53- Anticlockwise hysteresis in unfiltered water for aclonifen, linuron (above) and metolachlor in unfiltered water (left) and filtered water (right) during storm of May
(2008) in Auradé catchment. 129
Figure 54- Relationships between TSM (above), POC (meddle) and DOC (below) concontrations and the contribution (%) of surface plus subsurface runoffs for the
Save river during 4 storm events. 131
Figure 55- Relationships between TSM, POC and DOC riverin content and the
contribution of surface or subsurface runoff to Save river discharge. 132
Figure 56- Relationships beteen aclonifen and linuron riverine concentration and the contribution (%) of surface plus subsurface flows in the Save river for 4 storm events.
133 Figure 57- Relationships between aclonifen and linuron riverine concentration and the
contribution (%) of surface runoff to the Save river discharge during 4 storm events. 134 Figure 58- Relationships between TSM, POC, and pesticides concentration and the
contribution (%) of surface plus subsurface flows during the storm event of April
2008 in the Save river. 135
Figure 59- Relationships between TSM, POC (mg.L-1) and pesticide (left) concentration
and the contribution (%) of the surface runoff to the total Save river discharge during
the controlling factors (TSM, POC). 137 Figure 61- Relation between the concentration of metolachlor and DOC and the discharge
of subsurface runoff during storm of April 2008 for the Save river. 138
Figure 62- Relationship between metolachlor and DOC contents in filtered water during
storm of April 2008 for the Save river. 138
Figure 63- Relationships between linuron and DOC with the proportion of subsurface
runoff. 140
Figure 64- Relationship between metolachlor and DOC contents in filtered water during
storm of April 2008 for the Auradé chachment. 140
Figure 65- Relationships between aclonifen concentration, TSM and POC (left), and the relationship between TSM and POC with the proportion of subsurface water (right).
141 Figure 66- Relationship between the proportion of subsurface water and metolachlor
during storm of May 2008 in Aurade catchment. 141
Figure 67- Relationships between metolachlor concentration, and DOC during storm of
May 2008 in Auradé catchment. 142
Figure 68- Relationships between volume of water and pesticides fluxes during 5 storm
events in the Save river. 151
Figure 69-Relationships between specific flux of pesticides and specific water discharge in
both catchments, Save and Auradé, during storm events. 152
Figure 70- Relation between log Kd and log Kow during storm periods in Save catchment.
Kd is calculated for pesticide fluxes export during storm events. 154
Figure 71- Relationship between log Kow and log Kd during storm of June 2008 in Save
catchment. 155
Figure 72- Relationship between log Kd and log Kow during storm period (2008-2009) in
Auradé catchment. 155
Figure 73- Relationship between log Kow and log Kd during storm of April 2009 (1) in
Auradé catchment. 156
Figure 74- Relationship between log Kow and percentage of pesticide in suspended matter
in Save catchment during storm events. 157
Figure 75- Relationship between log Kow and percentage of pesticide in suspended matter
catchment during storm of June 2008. 159
Figure 77- Depicted the relationship between log Kow and log Kd in Save watershed during
storm of April (1) in 2009. 160
Figure 78- Relationship between total suspended matter (TSM) and partition coefficient
(Kd) in Save and Auradé catchments for aclonifen during investigated storms in
2008-2009. 161
Figure 79- Relationship between the slope a of the relationship Kd = aTSM + b and Kow
value for six molecules in the Save catchment during the storm events. 162
Figure 80- Relationships the Kd value of chlorotoluron (left) or aclonifen (right) and TSM
concentration for instantaneous samples collected during the storm periods in the
Save catchment. 163
Figure 81- Relationship between tebuconazole Kd (g.L-1) and river discharge (m3.s-1)
during storm of April 2008 in the Save catchment, showing a clockwise hysteresis
Table I- Chronology of pesticides development by Stephenson and Solomon (1993). 31 Table II- The most common classification scheme based on the pest group control. 34 Table III- Transfer and degradation processes controlling the movement and fate of organic
chemicals like pesticide. 42
Table IV- Summary of the concentration of DOC and POC in several rivers with different
sizes worldwide. 54
Table V- Chemical formula, Type of pesticides (H for herbicide, F for fungicide), application periods and chemical and physical characteristic of molecules was listed.
65 Table VI- Specific ions for detection and quantification of investigated molecules. 72 Table VII- Number of pesticide detections, detection frequency and concentration of
selected pesticides in unfiltered water (a) and filtered water (b) in Save watershed (In
general, 65 sampling points are set as a total of 100%). 87
Table VIII- Frequency and concentration of selected pesticides in unfiltered water (a) and filtered water (b) in Auradé catchment (In general, 121 sampling points are set as a
total of 100%). 88
Table IX- Coefficients (α) of the nonlinear reservoir, determined for flow recessions
measured in hour-scale for Save and in minute-scale for Auradé Catchments. αG for
groundwater, αSS for subsurface runoff and αS for surface runoff. 110
Table X- Contribution (%) of each stream flow components to the total volume of Save
river discharge during the different storm events. 135
Table XI- Equations adjusted to the relationships between TSM, POC and pesticides concentration and the contribution (%) of the surface plus subsurface flows to the
total Save river discharge. 136
Table XII- Coefficient of the relationships between metolachlor concentrations and the
streamflow components. 137
Table XIII- Contribution (m3 and %) of each stream flow components to the total
of water (X in m ) for some molecules in unfiltered and filtered water in Save
Catchment. 150
Table XV- Relationships between the amount of pesticides transported (Y in g) and the
volume of water (X in m3) in Auradé catchment. 151
Table XVI- Relationship between percentage of particulate fractions (%PF) and the Kow
values during the each storms period in Save and Auradé catchments. 158
Table XVII- Equations of the relationships between the TSM concentration (X in g.L-1) in
List of annexes
Annexe I- Different stream flows discharge during storm events in Save river. 207
Annexe II- Different stream flows discharge during storm events in Aurade
cachment. 208
Annexe III- Hydrograph separation for storm events in Save and Aurade catchments
during 2008-2008. 209
Annexe III (a)- Hydrograph separation for storm of March 2008 in Save river at
Larra. 209
Annexe III (b)- Hydrograph separation for storm of June 2008 in Save river at Larra. 210 Annexe III (c)- Hydrograph separation for storm of December 2008 in Save river at
Larra. 211
Annexe III (d)- Hydrograph separation for storm of January 2009 in Save river at
Larra. 212
Annexe III (e)- Hydrograph separation for storm of April 2008 in Montoussé river at
Auradé. 213
Annexe III (f )- Hydrograph separation for storm of May 2008 in Montoussé river at
Auradé. 214
Annexe IV- Fluxes of water, TSM, DOC and different pesticide molecules (g and%) exported in unfiltered, filtered and particulate fractions in Save et Auradé catchments during stormwater and base flux of the hydrological cycle
2008-2009 215
Annexe IV (a)- Fluxes of water, TSM, DOC and different pesticide molecules (g
and %) exported in unfiltered water by the Save river at Larra. 215
Annexe IV (b)- Fluxes of water, TSM, DOC and different pesticide molecules (g and %) exported in filtered water by the Save river at Larra during stormwater
and base flux of the hydrological cycle 2008-2009. 216
Annexe IV (c)- Percentage of each pesticide in particulate phase ([unfiltered minus
filtered water]/ unfiltered). 217
Annexe IV (d)- Fluxes of water, TSM, DOC and different pesticide molecules (gr) exported in unfiltered (a) and filtered (b) water by the Montousse river at Auradé during stormwater and base flux of the hydrological cycle from June 2007- to June 2009 and March 2008 until March 2009 in common with the 218
Save river.
Annexe V- Scientific productions 219
Annexe V (a)- Taghavi et al. 2010. Intern. J. Environ. Anal. Chem., 90: 390–405. 219
Annexe V (b)- Taghavi et al. 2010. Knowledge and Management of aquatic ecosystems (KMAE)., In press.
235
Annex V (c)- Taghavi et al. 2008. Proceedings 5th European Conference on
Pesticides and Related Organic Micropollutants and 11th symposium on
chemistry and fate in the Environment, Marseille, France, 439-444. (Awarded
the first prize for posters) 253
Annexe V (d)- Taghavi et al. 2010. Proceedings 6th European Conference on
Pesticides and Related Organic Micropollutants and 12th symposium on
chemistry and f in the Environment, Metera, Italy. (oral presentation) 261
Annexe V (e)- Taghavi et al. 2010. Proceedings 6th European Conference on
Pesticides and Related Organic Micropollutants and 12th symposium on
chemistry and fate in the Environment, Metera, Italy. (poster) 265
Annexe V (f)- Boithias et al. 2010. Proceedings European Geosciences Union
(EGU), Vienne, Autrich. (poster) 269
Annexe V (g)- Taghavi et al. 2010. Proceeding 39th French National Conference on
Pesticides (Toulouse, France). (oral presentation) 271
Annexe V (h)- Taghavi et al. 2010. Proceeding 40th French National Conference on
Abbreviations
ACTA Association to Coordination of Agricultural Technique
CACG Compagnie d’Aménagement des Coteux de Gascogne
DAR Desethylatrazine/Atrazine Ratio
DCM Dichloromethane
DF Detection Frequency
DL Detection Limit
DOC Dissolved organic carbon
DOM Dissolved Organic Matter
EEC European Economic Community
EU European Union
FAO Food and Agriculture Organization
G Ground water
GC Gas Choromatography
HPLC High Performance Liquid Choromatography
Kd Coefficient of distribution
Koc Organic carbon normalized soil solution partitioning constant (L/Kg OC) Kow Octanol Water partitioning constant
LLE Liquid Liquid Extraction
MEDD Ministère de l’Ecology du Development Durable
MS Mass Spectrometry
PF Particulate Fraction
POC Particulate Organic Carbon
S Surface water
SIM Specific Ions Monitoring
SPE Solid Phase Extraction
SS Subsurface water
SSC Suspended Sediment Concontration
Sw Solubility
TOC Total Organic Carbon
TSM Total Suspended Matter
VOC Volatile Organic Carbon
Scientific production and Awards
This Ph.D thesis has been partly published in peer reviewed journals or presented in national and international congresses.
Publications in JCR indexed Journals
Taghavi L. Probst J.L. Merlina G., Marchand A.L. Durbe G. and Probst A., 2010.
Flood event impact on pesticide transfer in a small agricultural catchment (Montousse at Auradé south west of France. Intern. J. Environ. Anal. Chem., 90: 390–405.
Taghavi L. Probst J.L. Merlina G., 2009. The role of storms on concentration of
pesticides associated with particulate and dissolved elements as a threat to aquatic system: Case study: Agricultural watershed of Save (South west of France). Accepted to Knowledge and Management of Aquatic Ecosystems.
Taghavi L. Probst J.L. Merlina G., 2010. Hysteresis patterns and storm components
showing the main pathway of pesticide transport? Case study: Agricultural watershed of Save (South west of France). To be submitted to the Science of the Total
Environment.
International and national congresses
Taghavi L. Probst J.L. Merlina G. Marchand A.L. Durbe G. and Probst A., 2008.
Pesticide transfers in a small agricultural catchment (Aurade, South west of France), during flood flows partitioning into dissolved and particulate fractions. Proceedings
5th European Conference on Pesticides and Related Organic Micropollutants and 11th symposium on chemistry and fate in the Environment, Marseille, France, 439-444.
(Awarded the first prize for posters)
Taghavi L. Probst J.L. Merlina G., 2009. Dynamique de transfert des pesticides en
périodes de crue sur le basin versant de la Save – South West of France. Proceeding
39th French National Conference on Pesticides, Toulouse, 13-15 May (oral
presentation)
Taghavi L. Probst J.L. Merlina G., 2010. Dynamique de transfert des pesticides en
périodes de crue sur le bassin versant de la Save (Sud-Ouest de la France): approche par découpage des hydrogrammes de crue. Proceeding 40th
French National Conference on Pesticides, May 2010, 26-28, Banylus-Sur-Mer(oral presentation)
Boithias L. Taghavi L. , Oeurng C , Sauvage S, Polard T. Ferrant S. Jean S. Probst J.L. Merlina G. and Sanchez-Perez J.M., 2010. Modelling pesticide transfer during flood events in an agricultural catchment using the SWAT model. Geophysical
Research Abstract, Vol. 12, EGU2010-8258-1, 2010. EGU General Assembly 2010.
Vienne, Autriche, April 2010 (poster)
Taghavi L. Probst J.L. Merlina G., 2010. Contribution of the different stream flow
of France). Proceedings 6th
European conference on pesticides and related organic micropollutants in the environments and 12th symposium on chemistry and fate of modern pesticide, Matera, Italy, Sep 2010 (oral presentation)
Taghavi L. Probst J.L. Merlina G., 2010. Pesticide transfer dynamic in an agricultural
watershed (Save-South west of France): contribution of the flood flows to the total fluxes. Proceedings 6th
European conference on pesticides and related organic micropollutants in the environments and 12th symposium on chemistry and fate of modern pesticide, Matera, Italy Sep 2010 (poster)
General Introduction
Pesticides are substances used to fight against pests of plants, animals and vegetal which pose serious problems to human activities, especially in agriculture (Gouy, 1993).
Herbicides are the main group of pesticides which are used frequently to maintain uncultivated soil, on the one hand and to protect the soil under cultivation in the early stage of growing crops, on the other hand. Fungicides fall into second category of pesticide in use in term of frequency to combat fungi. Substituted urea, s-triazine, toluidine, chloroacetamide and s-triazole are the pesticides used more frequently for corn, winter wheat, sunflower and colza in our study areas. As the consequence, a large quantity of the pesticides used enters into aquatic systems by rain, snow especially in spring and winter. As a matter of this fact investigation about the behaviour of these pesticide families is the purpose of our study.
The results of previous studies show many kinds of pesticides and their metabolites have been detected in various water bodies even under normal agricultural practices (Martin et al., 2003). Though their mechanisms remain unknown and it is highly necessary to conduct study on the transfer of pesticide in agricultural area (Louchart, 1999; Gouy et al., 2000).
Looking into pesticides’ concentration and transport to water course especially during storm events by runoff have been studied by some investigators (Ng and Clegg, 1997 ; Borah et al., 2002 ; Holvoet et al., 2007; Rabiet et al., 2010). But none have really investigated course of storm events by runoff and therefore little is known about the main routs of pesticide transport. And consequently controlling the contribution of the different streamflow components (surface and subsurface runoff, groundwater) to this reverine transfers. Hydrograph separation has been used as a means to estimate the contribution of each stream component during every flood event. The relationship between some particulate and soluble elements with stream components was previously demonstrated (Probst, 1985; Kattan et al., 1986; Probst and Bazerbachi, 1986) but nothing as such for pesticides.
Natural water contains suspended matter, dissolved organic and inorganic matter and many kinds of biota. As a consequence, the interaction between natural water contents and pesticides’ molecules is important to better understand pesticides transfers, particularly during storm events. In addition, in 1994 MC Bride pointed out that these
interactions are influenced by the physico-chemical properties of the pesticides such as hydrophobicity (log Kow) and pesticide distribution coefficient (Kd). Then, we have
paid especial attention to prediction of pesticide distribution coefficient during storm events when there is a large quantity of particulate and soluble, TSM, POC and DOC, elements that serve as a vector on pesticides’ transport (Mahler et al., 1999; Spark and Swift, 2002; Voice and Webber, 1993). Consequently, the distribution of pesticides in particulate and dissolved phase could be predicted by using the value of Kow
registered in literature. Since the distribution of pesticide in particulate or dissolved phases depends on organic fractions, therefore the extent of sorption is described in term of the organic-c-normalised partition coefficient, Koc (Chiou et al., 1979). The
relationship between Kow and Koc values has been found by several authors
(Karickhoff, 1979; Kenaga and Goring, 1980; Lyman et al., 1982). Since the contribution of organic carbon is low in our study area we focus our attention on Kd
calculation. Moreover, there is a lack of studies on the calculation of Kd based on the
flux value during storm events.
The present study was realised in the Save watershed and its subbasin, Auradé, close to Toulouse. The agricultural zone is intensively cultivated with sunflower, wheat and corn. Storm events were centre of our attention during this research, whilst weekly sampling was also done out of the storm periods. Previous mesurements have shown that the concentration of some molecules such as aclonifen, isoproturon, linuron, chlorotuluron, metolachlor and tebuconazole recorded during these periods revealed values higher than the limit established by EU (0.1µg.L-1), particularly during flood
periods.
Consequently, monitoring pesticides’ displacements in surface water during flood periods carried out to pursue the following objectives:
o To determine pesticide levels in the different fractions (dissolved phase,
suspended matter) and their variation during flood events.
o To understand the role of different controlling factors (flow, TSM, POC,
DOC, pH, EC) on the transfer of pesticides and their distribution between different phases.
o To determine the relationship between concentration and discharge, in order to
understand the principal processes of transport.
o To assess the contribution of different stream flows in exporting of pesticides
o To calculate the flux of each pesticide and their controlling factors during a
whole period of study and estimate the contribution of storm and base flow to annual flux.
o To estimate the coefficient of distribution Kd (dissolved / particulate) for
different molecules and verify its evolution based on the value of Kow (listed in
literature).
This thesis is divided into six parts
The first chapter is an introduction on pesticide and its interactions in environment. The second chapter is dealt with the methodology, explaining how the field study and analysis were carried out.
Chapter three is the part where the spatial variation of pesticides during two sampling campaigns in Auradé catchment in the first and at the end of our observations is illustrated. Temporal variation of pesticides and their controlling factors in Save and Auradé watersheds are also demonstrated in this chapter.
The Fourth chapter presents the results of storm’s hydrograph separation in the first part, then evolution of hysteresis pattern for controlling factors and molecule of pesticides was elaborated in the second part of this chapter. In the third part the relationship between different stream components with pesticides and their controlling factors was explained.
Chapter five is devoted to flux calculations during storm and base flow. Although, the value of flux only contributed to 4 storm periods in Auradé catchment. The result of specific flux to comparing between Save and Auradé watersheds was also investigated in this chapter. Finally to better understand the partitioning of the molecules in dissolved or particulate phase, the relationship between coefficient of distribution (Kd)
Introduction Générale
Les pesticides sont des substances utilisées pour lutter contre les ravageurs des plantes, animaux, insectes ou champignons et contre les végétaux concurrentiels des cultures qui posent de sérieux problèmes aux activités humaines, en particulier dans l'agriculture (Gouy, 1993). Les herbicides sont le principal groupe de pesticides qui sont utilisés fréquemment pour conserver l’état du sol et protéger les cultures en place dans la phase initiale de leur développement. Les fongicides constituent la deuxième catégorie de pesticides utilisés en terme de fréquence pour lutter contre les champignons. Les phénylurées substituées, les s-triazines, les anilides, les chloroacétamides et les s-triazoles constituent les familles de pesticides les plus fréquemment utilisées dans la zone d'étude (Sud Ouest de la France) sur le maïs, le blé d'hiver, le tournesol et le colza. Ainsi, une grande quantité de pesticides utilisés peut entrer dans les systèmes aquatiques par les apports d’eau dus à la pluie ou à la neige et plus particulièrement en hiver et au printemps. Cette étude porte donc sur le comportement de ces familles de pesticides dans deux types de bassins versants du sud ouest de la France.
Les résultats des études précédentes ont montré que de nombreux types de pesticides et de métabolites de ceux-ci ont été détectés dans divers compartiments aquatiques, même pour des pratiques agricoles normales (Martin et al., 2003). Dans ces conditions d’usage, le mécanisme de leur transport et l’impact de ces activités agricoles restent mal connus (Louchart, 1999; Gouy et al., 2000). La concentration des pesticides et le transport de ceux-ci dans les cours d’eau, en particulier par les eaux de ruissellement en période de crue ont été étudiés par quelques chercheurs (Ng and Clegg, 1997 ; Borah et al., 2002 ; Holvoet et al., 2007; Rabiet et al., 2010). Cependant, aucun n'a vraiment étudié le phénomène en fonction des débits caractéristiques de la crue et donc on connaît peu l’itinéraire principal des produits pesticides dans ce transfert du champ au cours d’eau et par conséquance la contribution des differants écoulements (ruissellement, écoulement hypoderemique et nappe) au transfert fluvial. La décomposition de l'hydrogramme de crue est utilisée comme un moyen d'estimer la contribution de chaque composante durant chaque événement. Des relations ont déjà été mises en évidence antérieurement entre certaines phases particulaires ou les éléments solubles et les différentes composantes de l’écoulement fluvial (Probst,
1985; Kattan et al., 1986; Probst et Bazerbachi, 1986), mais aucune jusqu’à présent sur les pesticides.
Les eaux naturelles contiennent des matières en suspension, des matières organiques dissoutes et inorganiques ainsi que de nombreux élements biogènes. En conséquence, les interactions entre les teneurs en ces constituants et les molécules de pesticides présentes sont importantes pour mieux comprendre le transfert des pesticides, en particulier ces interactions sont controlées notamment par les propriétés physico-chimiques des pesticides tels que l'hydrophobicité (log Kow) et le coefficient de
distribution des pesticides entre differentes phases (coefficients Kd, Mc Bride 1994).
Une attention particulière est accordée à l’estimation de ces coefficients de distribution des pesticides en période de crue lorsqu’une grande quantité d’élements dissous et particulaire, TSM, POC et DOC, éléments vecteurs pour le transport des pesticides est présente (Mahler et al., 1999; Spark et Swift, 2002; Voice et Webber, 1993; Thouvenin et al., 2007). Ainsi, la distribution des pesticides dans la phase particulaire et la phase dissoute peut être évaluée en utilisant les valeurs de Kow de la
littérature. Comme cette distribution de pesticides entre les phases particulaires et dissoutes dépend des fractions organiques respectives, la différence de sorption peut être aussi décrite en terme de partition organique représentée par le coefficient C-normalisé Koc (Chiou et al., 1979). Une relation entre les valeurs de Kow et de Koc a
sauvent été établie par differents auteurs (Karickhoff, 1979; Kenaga and Goring, 1980; Lyman et al., 1982). Quand la contribution du carbone organique est faible comme c’est le cas dans notre zone d'étude, l’approche de la répartition du pesticide entre les deux phases peut être ramenée au calcul du Kd pour l’épisode de crue par une
valeur basée sur les différents flux permettant une nouvelle représentation de ce phénomène, plus réaliste et plus proche de la réalité hydrologique.
La présente étude a été réalisée dans le bassin hydrographique de la Save et un de ses sous-bassins, i.e., le Montoussé à Auradé, près de Toulouse. C’est une zone de culture intensive de tournesol / blé en rotation et de maïs en monoculture. L’objectif est ici d’étudier les périodes de crues, même si un échantillonnage hebdomadaire est fait en dehors de ces périodes. Les premieres mesures des concentrations de certaines molécules telles que l’aclonifène, l’isoproturon, le linuron, le chlorotuluron, le métolachlore et le tébuconazole enregistrées durant ces périodes ont révélées des valeurs supérieures aux limites établies par l'Union européenne (0.1µg.L-1) notament
en periode de crue. Ainsi le suivi de l’évolution du transfert des pesticides vers les eaux de surface au cours de ces périodes de crue devrait nous permettre de :
o Déterminer le niveau de concentration de pesticides dans les différentes
fractions (phase dissoute, les matières en suspension) et leur variation pendant la période de crue.
o Comprendre le rôle des différents facteurs de contrôle (débit, TSM, POC,
DOC, pH, CE) sur le transfert des pesticides et leur répartition entre les différentes phases.
o Déterminer la relation entre les concentrations et les débits, afin de
comprendre les principaux processus de transfert des pesticides.
o Evaluer la contribution des différentes composantes de l’écoulement fluvial
dans l'exportation des pesticides dans la rivière.
o Calculer le flux de chaque pesticide et des facteurs de contrôle sur la période
d’étude et estimer la contribution des périodes de crue et de débit de base au flux total annuel.
o Estimer le coefficient de distribution Kd (dissous / particulaire) pour les
différentes molécules et mettre en évidence sa relation avec le paramètre Kow
caractérisant l’hypophilie de ces molécules.
Ce travail de Thèse est divisé en six parties.
Le premier chapitre est une introduction sur les pesticides et sur leurs interactions avec l’environnement. Le second chapitre est consacré à la méthodologie concernant l’étude sur le terrain et les analyses. Le chapitre trois est la partie traitant de la variation spatiale des pesticides durant deux campagnes sur le site d’Auradé effectuées en début et fin d’étude. On aborde aussi dans ce même chapitre la variation temporelle des pesticides et les facteurs de contrôle pour les bassins versants de la Save et d’Auradé. Le quatrième chapitre est divisé en3parties : dans la première partie on présent les résultats sur la séparation des hydrogrammes de crue. Dans la deuxième partie, on montre les résultats sur l’évolution des facteurs de contrôle et des molécules de pesticides. La troisième partie est consacrée à l’explication des relations entre des débits des differentes composantes de l’écoulement et les molécules de pesticides et leurs facteurs de contrôle. Le cinquieme chapitre est consacré au calcul des flux durant les crues et le régime de base. Bien que la valeur du flux soit basée sur 4 périodes de crues sur Auradé, les résultats des flux spécifiques ont été comparés entre les bassins versants de la Save et d’Auradé dans ce chapitre. A la fin de ce chapitre on
aborde la relation entre Kd et Kow tiré de la littérature pour mieux comprendre le
Chapter I
Pesticides in the environment
Chapter I
Pesticides in the environment
(Literature review)
Introduction
The first part of this chapter out lines in brief, the definition of pesticides suggested by some official organizations. In the second part, history of pesticides use is adumbrated. Moreover, classification and market status of pesticides will be highlighted. In the following part pesticide’s life cycle and the main factors such as runoff and stormwater, playing undeniable roles in pesticide’s fate and behavior in the environment, will be of our interest.
I: Pesticide history, classification, market and use
1
General knowledge
1.1 Pesticides’ definitions
The name of pesticide is derived from the Latin words pestis (pestilence, plague) and,
caedere (to kill). According to the definition used in the Joint FAO/ WHO food
standards programme a pesticide is:
«
any substance or mixture of substances intended for preventing, destroying or controlling any pest, including vectors of human or animal disease, unwanted species of plants or animals causing harm during or otherwise interfering with the production, processing, storage, transport or marketing of food, agricultural commodities, wood and wood products or animal feedstuffs, or substances which may be administered to animals for the control of insects, arachnids or other pests in or on their bodies. The term includes substances intended for use as a plant growth regulator, defoliant, desiccant or agent for thinning fruit or preventing the premature fall of fruit, and substances applied to crops either before or after harvest to protect the commodity from deterioration during storage and transport (FAO, 2002)».
According to Directive 91/414/EEC of 15 July 1991 (EEC, 1991) pesticide is one or more active substances which are designed to:
o protect plants against all harmful organisms or to prevent them from harmful
actions,
o influence the life processes of plants, o conserve the plants,
o destroy parts of plants, check or prevent undesired growth.
In 2002 ACTA the French Association to Coordination of Agricultural Technique has denoted the pesticides are substance that apply to fight against pests, pest control and protection, under different names, are used to identify chemicals and minerals and sometimes a majority in the form of synthetic organic compounds that applied to plants growth.
The term «pesticide residues» describes the surplus substance present in the environment
or in products following the use of a pesticide. This term covers both the compound and its degradation products.
1.2 Historical context of pesticide use
Humans battling to eradicate pests and protecting crops date back to the twentieth century. Sulfur is known to be the very first chemical used in Mesopotamia some 4500 years ago.
No noticeable progress in using and discovering new substance was traced in history until 15th century when the campaign against harmful pests gained momentum. By then till 17th century number of toxic chemicals such as arsenic, mercury and lead were used to
safeguard crops from harmful pests. Nicotine, a substance contained in tobacco, was employed as an insecticide, for the first time in the 17th century. Some more natural
pesticides such as pyrethrum, rotenone were introduced to combat harmful pests in the 19th century (Miller, 2002). The mid-twenty century appears to make something of
turning point in the compaigns against harmful pests. Arsenic derived pesticides were, until 1950, the most commonly used of all chemicals (Ritter, 2009). DDT was recognized to be a highly effective insecticide. And, organochlorines were dominant chemical substances in use in the U.S. from mid 1970s, organophosphates and carbamates and their derived substances like pyrethrin compounds were among the dominant insecticide used in the U.S. Herbicide utilizations have become widespread in 1960s. However, in 1962 the Silent Spring, written by Rachel Carson, was published. Carson’s book focused public attention on the problem of pesticide and other chemical pollution. Table I,
presents a chronology of pesticides development suggested by Stephenson and Solomon (1993).
Table I- Chronology of pesticides development by Stephenson and Solomon (1993).
Generally, producing pesticides capable of distorting pest without harming plants in the environment has always been a challenge for the manufactures.
Period / year Uses of pesticides
1500 BC Egyptians produced insecticides against lice, fleas and wasps.
1000 BC The Greek poet Homer referred to a pest-averting sulphur.
200 BC The Roman writer Cato advises vineyard farmers to burn bitumen to
remove insects.
Early 1700s John Parkinson, author of Paradisus, the Ordering of the Orchard'
recommended a concoction of vinegar, cow dun and urine to be put on trees with canker.
1711 In England, the foul smelling herb rue was boiled and sprayed on
trees to remove cantharid flies.
1763 In Marseilles, a mixture of water, slaked lime and bad tobacco was
a remedy for plant lice.
1821 London Horticultural Society advised that sulphur is the remedy for
mildew on peaches.
1867 The beginning of modern pesticide use.
Colorado beetle invade US potatoes crops and arsenic is applied.
Late 1800s French vineyard growers have the idea of selective weed killers.
1892 The first synthetic pesticide, potassium dinitro-2-cresylate, marketed
in Germany.
Early 1900s Insecticides, fungicides and herbicides have all been discovered.
Inorganic substances introduced.
1932 Products to control house hold pests marketed.
1939 Muller discovered the powerful insecticides properties of DDT.
1945 After the Second World War, farming intensity intensified
production.
New pesticides are being developed, including biological and botanical derivative and alternative that are thought to reduce health hazard and environmental risks. In addition, applications are being encouraged to consider alternative controls and adopt methods that reduce the use of chemical pesticides.
Today, environmentally friendly pesticides can be manufactured so that to target a specific pest’s life cycle only.
1.3 Pesticides classification
The pesticides on the market today are characterized by a multiplicity of chemical structures, functions and activities that making their classification difficult. In general, pesticides are classified based on different criteria such as:
o Chemical structure o Active substances
o Specific use of the pesticide
1.3.1 Classification based on chemical structure: inorganic, organic and
botanical
o Inorganic pesticide
Some pesticides do not have carbon in their formulae. These compounds usually have relatively low molecular weight and often contain less than 10 atoms.
These types of pesticides are derived from mineral deposit and chemical compounds which are very stable in the nature. A few inorganic pesticides have been used for more than 1000 years but their use increased dramatically from 1850 to 1950. The popularity of many inorganic pesticides declined after the development of more effective and less persistent organic pesticides. In the past, people were quick to adopt any treatment that would control pests and increase food supply. These inorganic pesticides containing lead- mercury- arsenic have been banned, on the grounds that they will harm the environment. And they now constitute only small part of the pesticides in use. Examples of inorganic pesticides are:
o Arsenical pesticides (Paris green) o Fluoride insecticides (Cryptile) o Inorganic herbicides (Borax)
o Inorganic fungicides (Bordeaux mixture)
Organic pesticides include a wide rang of pesticides in use today. They have carbon atoms and may contain other elements such as oxygen, hydrogen, phosphorus, sulphur and many more. Some of these pesticides are extracted from plants however most of them are synthetically produced.
o Botanicals
The botanical pesticides are the pesticides which are extracted from various parts of the plants as stems, seeds, roots, … . Many of botanical pesticides act as stomach poisons, and some of the botanical insecticides have a short residual activity and do not accumulate in the environment. Some of the examples of this category are nicotine, rotenone.
1.3.2 Classification and active chemicals
According to the active substances used in the chemical formula pesticides can be classified as:
oorganochlorine (DDT, dieldrin,…) oorganophosphates (parathion, malathion,) ocarbamate (carbaryl, aldicarb, …)
ophenoxyacetic acid herbicides: (2.4-D, MCPA,) osubstitute urea: (chlorotoluron, isoproturon, …) otriazine herbicides: (simazine, atrazine,…) opyridinium herbicides: (paraquat, Diquat,…)
Existence of a wide rang of pesticide families some of which contain several active substances to combat two or more group of parasites, make their classification a real challenging task.
1.3.3 Classification and pesticide -specifity
The growth and reproduction of parasites can be suppressed by applying specific pesticides. The three main families of pesticides are: herbicides, fungicides and insecticides.
Herbicides are the most widely used pesticides in the world. They are intended for
elimination of grass that competing with the crops. Herbicides act on plants in a variety of ways. For example they can inhibit : photosynthesis (atrazine, terbuthylazine, isoproturon), cell division (trifluralin, pendimethalin), lipid synthesis (family of cyclohexanediones , like cycloxydime), cellulose synthesis (chlorotiamide), amino acid synthesis (glyphosate) (Record, 1965 ; Gunsolus et al., 1999).
Fungicides fight the spread of plant disease caused by fungus or bacteria. Like
herbicides, fungicides act on plants in different ways. They can inhibit: respiration (transfer inhibiter of ATP, like silthiofam), cell division (benomyl), biosynthesis of amino acids or proteins (it is essentially the family of anilinepyrimidines like, cyprodinil), disturb the metabolism of carbohydrates (fludioxinil) (Fairbanks et al., 2002; Dane and Dalgic, 2005).
Insecticides are used to protect plants and animals from harmful insects by eliminating
them or preventing them from reproducing. There are various types including: neurotoxins (i.e. sodium channel blocking, like oxadiazines family (indoxacarbe), growth regulators (teflubenzuron), cell respiration inhibitors (inhibit of oxidative phosphorylation like tha accaricide family as cyhexatin), (Aamlid et al., 2007; James et al., 2008; Demicco et al., 2010).
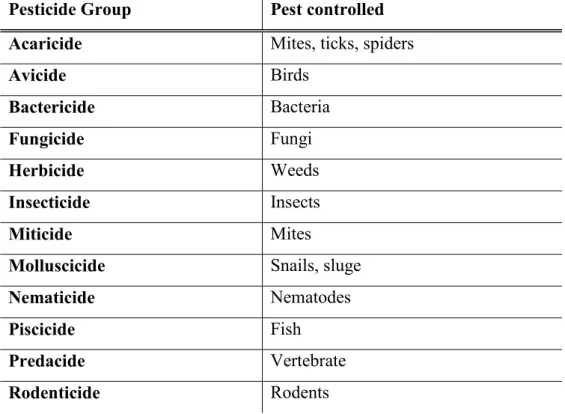
Apart from these main pesticide families, some others can be included in table II:
Table II- The most common classification scheme based on the pest group control.
Pesticide Group Pest controlled
Acaricide Mites, ticks, spiders
Avicide Birds Bactericide Bacteria Fungicide Fungi Herbicide Weeds Insecticide Insects Miticide Mites
Molluscicide Snails, sluge
Nematicide Nematodes
Piscicide Fish
Predacide Vertebrate
1.4 The Market for pesticides (Current Status)
Today, pesticides are conclusively identified as the main source of surface and groundwater contamination and have become a major environmental preoccupation in Western Europe (Albanis et al. 1998). In sum, market of pesticides was 33 390 billion dollars in 2007. The contribution of each continent is: Europe (10 568), Africa (1 330), Latin America (6 170), North America (7 507), Asia (7 815) in billion dollars. And the market of different category of pesticides is: herbicides (16 115), Fungicides (8 105), insecticides (8 016) and others (1 154) in billion dollars, the percentage value was demonstrated in figure 1.
Figure 1- Current status of pesticide’s market by continent and by category of pesticides in billion euros.
((U.I.P.P.http://http://www.uipp.org/var/uipp/storage/original/application/eac46ae8e554ec913d206818f33e57c0.pdf).
Of the total amount of pesticides used in the world the quantity of herbicides accounted for the largest part, followed by insecticides, fungicides and other pesticides. In fact, pesticides are among the substances liable to harm both human health and the environment. This problem is all the more pressing in France, as it is the world’s third largest utilizer of pesticide products, behind the United States and Japan. France, due to the vast agricultural area which represents more than half of its territory, is the largest European consumer of pesticides followed by Germany and Italy (figure 2).
Figure 2- Distribution of pesticide market (billion euros) in Europe in 2006.
(U.I.P.P.http://http://www.uipp.org/var/uipp/storage/original/application/eac46ae8e554ec913d206818f33e57c0.pdf). B il li o n e u ro s B il li o n e u ro s
Pesticide usage by continent
23.40% 22.50% 31.70%
18.50% 4%
South America North America Asia Europe Africa
Pesticide production by cate gory
48.30% 24% 24.30%
3.50%
1.5 Pesticide usage and consumption
1.5.1 General context
Over the past 10 years there has been an increasing awareness about nonpoint source pollution and the potential linkage to agriculture. According to the status list of active substances available commercially in the EU, more than 1.100 pesticide substances to combat harmful organisms (pests) are currently registered (Huskova et al. 2008). However, reliable data on the usage of pesticides in any country is not easily available as manufacturers are reluctant to disclose such information. In developing countries, data is even sparser since records are often incomplete and there is little government control on the use of pesticides (Wilson and Tisdell, 2001). Observations of pesticide occurrence in streams and lakes adjacent to agricultural fields have prompted much discussion about whether to ban or greatly restrict agricultural activities that would potentially impair water quality.
1.5.2 National context
France ranks 3rd after the USA and Japan in the use of pesticide with around 110, 000
tonnes of active substances consumption annually. In agriculture, there are more than 6000 varieties of pesticides produced from 800 different active substances. 400 of these active substances are used to manufacturing pesticides in France (IFEN, 2006).
France is also the first agriculture producer in Europe (21.7% of the total production in Europe) and it is the top corn producer, and very big herbicide utilizer (42.7% of the total production in Europe) (Miquel and Revol, 2003). The quantities consumed in France are nonetheless equivalent to average European countries per hectare, that is to say 4.4 kg.ha-1. Which is quite a considerable amount comparing to Portugal which does not
consume more than 1.9 kg.ha-1 whereas the Netherlands is the bad European fellow
utilizing 17.5 kg.ha-1.
The quantity used in France is hence important and consequently we find these quantities in aquatic ecosystem accordingly; and this is why the French Ministry of Ecology and Sustainable Development (Ministère de l’Ecology et du Development Durable (MEDD)) asserts in a recent report that pesticide contamination will be a major problem in terms of pollution of the natural waters in the years to come (MEDD, 2003).
1.5.3 Regional context
The Garonne is the most important river of southwestern France and its watershed covers 57 000 km2. In fact, there is a long history of agricultural development in this catchment