HAL Id: hal-00316395
https://hal.archives-ouvertes.fr/hal-00316395
Submitted on 1 Jan 1998
HAL is a multi-disciplinary open access
archive for the deposit and dissemination of sci-entific research documents, whether they are pub-lished or not. The documents may come from teaching and research institutions in France or abroad, or from public or private research centers.
L’archive ouverte pluridisciplinaire HAL, est destinée au dépôt et à la diffusion de documents scientifiques de niveau recherche, publiés ou non, émanant des établissements d’enseignement et de recherche français ou étrangers, des laboratoires publics ou privés.
Physical mechanism of strong negative storm effects in
the daytime ionospheric F2 region observed with
EISCAT
A. Mikhailov, K. Schlegel
To cite this version:
A. Mikhailov, K. Schlegel. Physical mechanism of strong negative storm effects in the daytime iono-spheric F2 region observed with EISCAT. Annales Geophysicae, European Geosciences Union, 1998, 16 (5), pp.602-608. �hal-00316395�
Physical mechanism of strong negative storm eects in the daytime
ionospheric F2 region observed with EISCAT
A. Mikhailov1, K. Schlegel2
1Institute for Applied Geophysics, 129128 Rostokinskaya 9, Moscow, Russia
2Max-Planck-Institut fuÈr Aeronomie, Max-Planck-Str. 2, D-37189 Katlenburg-Lindau, Germany
Fax: +49 5556 979 240; e-mail: [email protected]
Received: 14 January 1997 / Revised: 2 December 1997 / Accepted: 12 December 1997
Abstract. A self-consistent method for daytime F-region modelling was applied to EISCAT observations during two periods comprising the very disturbed days 3 April 1992 and 10 April 1990. The observed strong Ne
decrease at F2-layer heights originated from dierent physical mechanisms in the two cases. The negative F2-layer storm eect with an NmF2 decrease by a factor of
6.4 on 3 April 1992 was produced by enhanced electric ®elds (E » 85 mV/m) and strong downward plasma drifts, but without any noticeable changes in thermos-pheric parameters. The increase of the O++ N
2
reaction rate resulted in a strong enrichment of the ionosphere with molecular ions even at F2-layer heights. The enhanced electric ®eld produced a wide mid-latitude daytime trough on 03 April 1992 not usually observed during similar polarization jet events. The other strong negative storm eect on 10 April 1990 with a complete disappearance of the F2-layer maximum at the usual heights was attributed mainly to changes in neutral composition and temperature. A small value for the shape parameter S in the neutral temperature pro®le and a low neutral temperature at 120 km indicate strong cooling of the lower thermosphere. We propose that this cooling is due to increased nitric oxide concentration usually observed at these heights during geomagnetic storms.
Key words. Atmospheric composition and structure á Thermosphere á Ionosphere á Ion chemistry
and composition á Atmosphere interactions 1 Introduction
Ionospheric F2-layer negative storms have been studied for years and general mechanisms of their origin are well known. A comprehensive review on this problem can be
found in ProÈlss (1995). So far mid- and low-latitude F2-layer storm eects have been studied more extensively than high-latitude ones. This is partly due to the diculties with ground-based ionosonde observations during geomagnetically disturbed periods. In addition, the high-latitude F2 region is very variable, being strongly in¯uenced by magnetospheric processes; in particular, substantial electric ®elds are usually present during geomagnetic storms. These electric ®elds and the corre-sponding horizontal E ´ B plasma drifts can strongly perturb the electron density distribution at F2-layer heights. Neutral composition and temperature changes are the other source of negative F2-layer storm eects. The aim of the present work is to study the physical mechanism and to estimate the contribution of various processes to the observed storm-time Ne(h) changes. Two
periods of EISCAT observations comprising the very disturbed days 03 April 1992 and 10 April 1990 with a very strong electron concentration depletion are analyzed in the paper.
These cases were chosen to demonstrate dierent physical mechanisms of the observed negative storm eect. The ®rst case presents an isolated geomagnetic storm with a moderate Ap 32 but a sharp and very strong upsurge in the westward E ´ B plasma drift around noon followed by a NmF2 decrease of a factor of
6.4 relative to the quiet prestorm day 02 April 1992. The other case of 10 April 1990 refers to an extremely severe geomagnetic storm with Ap 124 when the F2-layer maximum practically disappeared at the usual heights and an electron concentration peak around 200 km constituted the ionospheric maximum. Similar eects were observed in the American longitudinal sector with the Millstone Hill incoherent-scatter radar on 10 April 1990 (Buonsanto et al., 1992): The daytime ionospheric densities were extremely low over the probed latitude range, and since the peak height was in the molecular ion-dominated region below 200 km, the F2-layer maximum was in fact a F1-layer peak. The storm eects at Millstone Hill were studied by Mikhailov and Foster (1997).
The EISCAT observations are analyzed in this paper with the help of the self-consistent method developed by Mikhailov and Schlegel (1997). It provides the set of main aeronomic parameters ([O], [O2], [N2], vertical plasma
drift W, exospheric temperature Tex, and the shape
parameter S for the neutral temperature height pro®le, which are altogether responsible for the formation of the Ne(h) pro®le) and yields information about the physical
mechanisms of the observed F2-layer storm eects. The main aim of Mikhailov and Schlegel (1997) was to demonstrate that our method is very eective and yields valuable information about the ionosphere and thermosphere. In this investigation we apply our model to two speci®c examples of ionospheric storm events. Moreover, as a new feature in this study, neutral temperature at 120 km height was included to the set of ®tted parameters, as it may dier from the values provided by the MSIS model during severe storm periods.
Our original method can be used when the F2-layer maximum is well de®ned. In this case some of the parameters can be found from ®tting theoretical NmF2
and hmF2 values to the observed ones. On 10 April
1990 when the F2-layer maximum was absent, a dierent approach was used to ®nd the solution. In this case all six aeronomic parameters Tex, S, T120, [O],
[O2], [N2] were varied to ®t the observed Ne(h) pro®le.
The vertical plasma drift was calculated as in the previous method using the observed Vl(h) and other
parameters calculated in a self-consistent way in the Ne(h) ®tting procedure.
2 Observations and model calculations
A list of the available observations along with solar and magnetic indices used in the study is given in Table 1. The 3-month average solar index F10.7 was 151.7 and 187.9 for the two periods in question.
The April 1992 period is very suitable for the analysis as it includes three quiet days preceding the storm, so 2 April can be used as a quiet reference day. For the second period we do not have a similar quiet reference, but Millstone Hill radar observations for the same period (Mikhailov and Foster, 1997) show that the F2 layer was only moderately disturbed on 9 April 1990 with NmF2 reduced by a factor of 2 with respect to the
nearest quiet day 7 April.
The EISCAT CP-1 program provides range pro®les of Ne, Te, Ti and Vl with the antenna beam directed
along the local geomagnetic ®eld line. We used the long-pulse data for our purpose in the form as distributed by EISCAT (integration time 5 minutes, standard pro®le of [O+]/N
e). We calculated median pro®les over about an
hour (12±13 values, see Table 1) for each of the four parameters with standard deviations at each height. Data with ®ner height resolution from an alternating code pulse scheme for E and lower F regions were analyzed as well, but they were not used in the study (see Sect. 3).
On 3 April 1992 a steep upsurge of the westward E ´ B drift started after 1000 UT, peaked around 1200± 1400 UT at values of about 2000 m/s, and then subsided down to 1000 m/s. Therefore we accepted a mean value of 1700 m/s (E » 85 mV/m) for the analyzed period 1400±1500 UT. On 10 April 1990, strong E ´ B drifts were observed during the whole day. A northwest drift of 700 m/s (E » 35 mV/m) was observed during the analyzed period 1315±1415 UT.
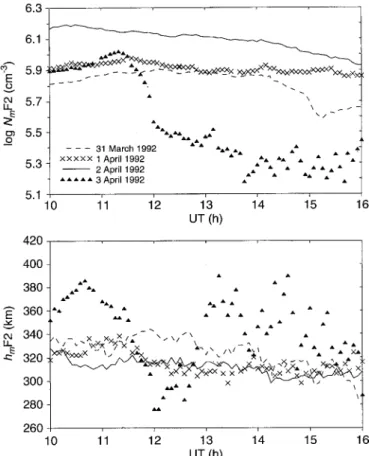
In Figs. 1 and 2 we present observed NmF2 and hmF2
variations during daytime hours for the two periods. The disturbed day 3 April is characterized by an increase in hmF2 and a strong decrease in NmF2 in comparison
with the previous quiet days. Such hmF2 and NmF2
variations are similar to mid-latitude negative F2-layer storm eects resulting from changes of neutral compo-sition and temperature (see for instance ProÈlss, 1995). In
Table 1. Dates and geophysical parameters of the periods used in the study
date time (UT) Ap F10.7
(day/day-1) E ´ B(m/s) 31 March 1992 1300±1400 14 191.4/182.4 250 1 April 1992 1300±1400 13 186.1/191.4 150 2 April 1992 1300±1400 6 161.2/186.1 50 3 April 1992 1400±1500 32 159.7/161.2 1700 9 April 1990 1400±1500 34 146.3/151.9 500
10 April 1990 1315±1415 124 148.7/146.3 700 Fig. 1. Observed NmF2 and hmF2 variations for 31 March to 3 April
1992 during daytime hours
this case NmF2 was reduced by a factor of 6.4, and hmF2
increased by about 40 km. On 10 April 1990 a large decrease in both NmF2 and hmF2 was observed. Figure 2
shows a normal negatively disturbed F2 layer around 1230 UT which is then split into two layers. After 1300 UT the ionosphere was characterized by one layer with a peak around 200 km height.
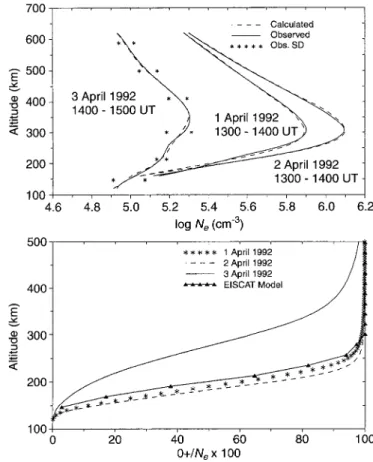
Electron density pro®les resulting from our model calculations in comparison with observed Ne(h) pro®les
for the two periods in question are displayed in Figs. 3 and 4 (upper panels). The lower panels show a compar-ison of the calculated [O+]/N
e ratio with the EISCAT
ion composition model used for the routine incoherent data reduction. The calculated height variations for [O+]/N
eare close to the standard EISCAT ion
compo-sition model for quiet days (1, 2 April 1992), and therefore no correction was applied for the measured Ne(h), Te(h), and Ti(h) pro®les. For disturbed days,
however, the calculated ion composition diers signif-icantly from the standard EISCAT model. A strong enrichment of the ionosphere with molecular ions even at heights of the F2 layer required a correction of the measured Ne(h), Te(h), and Ti(h) pro®les for these days
as outlined in Mikhailov and Schlegel (1997). 3 Discussion
Figures 3 and 4 show that our model calculations describe the observed Ne(h) pro®les with good accuracy
for quiet as well as for disturbed conditions. So we can conclude that the considered set of main physical processes in the model is sucient for the description of the sunlit auroral F2 region even during such disturbed conditions. These are the same processes commonly used for mid-latitude F2-layer modelling. Similar conclusions were obtained by Farmer et al. (1984) and Lathuillere and Brekke (1985) analyzing EISCAT observations.
The observed negative storm eect on 3 April 1992 looks much like mid-latitude events with reduced NmF2
and increased hmF2 values, but the mechanism causing it
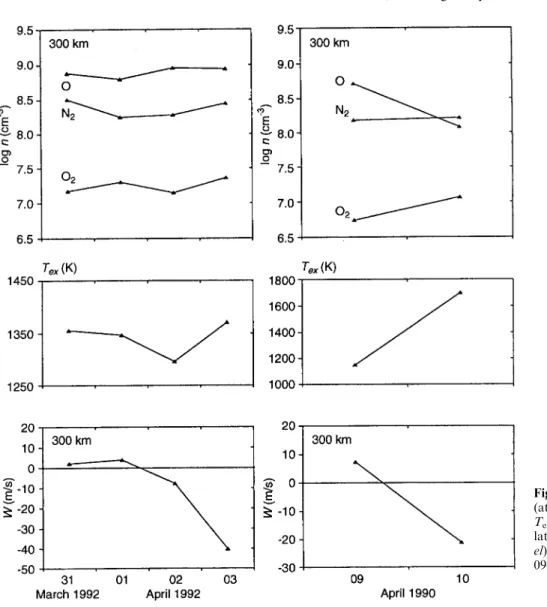
turns out to be dierent. The calculated relative varia-tions of the neutral composition during the 31 March - 3 April period (Fig. 5, left panel) are not strong. This may be attributed to the fact that the considered period (14± 15 UT) was relatively close to the beginning of the geomagnetic storm at about 10 UT. Much more time is usually required for changes in the neutral composition. Nevertheless a pronounced dierence in the shape of the Tn(h) pro®le can be already seen for this period (Fig. 6,
left panel): The calculated shape parameter is S 0.035 km)1, while MSIS-83 gives S 0.017 km)1 as for the
previous quiet days. The increased value of S results from the strong Joule heating which took place for the period in question. Figure 6 shows two Tn(h) pro®les
together with the observed Ti(h). The unusual Ti(h)
Fig. 2. Same as Fig. 1 but for the period 9±10 April 1990 Fig. 3. Top panel: observed (together with a band of standard deviations) and calculated Ne(h) pro®les for two geomagnetically quiet
(1, 2 April) and disturbed (3 April 1992) days. Bottom panel: calculated and EISCAT model [O+]/N
e height variations for the 3
pro®le below 200 km clearly indicates the strong frictional heating in this height range. Our method is indeed sensitive enough to reproduce such changes in the shape of Tn(h).
The observed strong NmF2 reduction from 2 to 3
April 1992 (by a factor of up to 6.4) does not result from neutral composition changes: the O/N2ratio equals 5 on
2 April and 4.7 on 3 April at the hmF2 height. Also,
Fig. 5 reveals only small neutral composition changes at 300 km altitude. On the other hand, the linear loss coecient b c1N2 c2O2 for O+ions increased by
a factor of 5 at the F2-layer maximum height. This results from a large increase in c1 by more than a factor
of 10 due to its dependence on the electric ®eld (Schunk et al., 1975). Therefore, the very large negative F2-layer storm eect on 3 April 1992 is mainly a consequence of the strong electric ®eld (E » 85 mV/m), rather than of changes in neutral composition. In principle, an addi-tional contribution to the NmF2 reduction can originate
from a strong downward plasma drift (Fig. 5, lower left panel). Under normal conditions the vertical plasma drift can be fully attributed to the meridional thermos-pheric wind Vnx(Farmer et al., 1984), as the magnetic
®eld line declination at Tromso is only 1.24° and the zonal wind component, Vny is not ecient at least for
near-noon hours when it is small. The calculated strong downward drift of 40 m/s on 3 April (Fig. 5, lower left panel) however, can hardly be attributed to a northward wind of » 180 m/s, but may partly be explained by a
geometrical eect proposed by Schlegel (1986): if the line-of-sight velocity measured by the radar and inter-preted as Vlis not exactly parallel to B on a local scale
(especially during geomagnetic disturbances), a compo-nent of the perpendicular ion velocity, Vperp, can map
into the line-of-sight velocity. Even if the deviation from the parallel direction is only of the order of 1°, a large perpendicular ion velocity of 1700 m/s (as we have for 3 April) can easily give a contribution of several 10 m/s to the measured line-of-sight velocity, falsely assumed to be parallel to B. Therefore we assume that the calculated strong downward drift on 3 April 1992 may have ± at least partly ± a geometrical rather than a geophysical explanation.
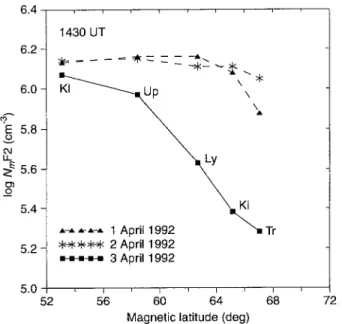
The observed steep upsurge of the electric ®eld produced not only a negative disturbance at the latitudes of EISCAT, but also a daytime trough in the latitudinal distribution of NmF2. Figure 7 shows the
observed latitudinal variation of NmF2 along a chain of
European ionosonde stations for the same time-interval. The disturbance due to the high-latitude electric ®eld is seen to extended down to latitudes of Uppsala (U 58°), and a small NmF2 reduction is seen even at
the mid-latitude station Kaliningrad. Therefore 3 April provides an excellent example of a daytime trough formation due to an enhanced electric ®eld. The observed eect resembles a polarization jet ®rst reported by Galperin et al. (1973) but is not identical to so-called SAID events [subauroral ion drift, see Anderson et al. (1991) for details].
The considered case of 3 April 1992 demonstrates a pure eect of increased electric ®eld without any noticeable changes in thermospheric parameters, as the analyzed period was just at the beginning of the geomagnetic storm. The case of 10 April 1990 already represents the second day of a severe geomagnetic storm with strong worldwide F2-layer negative storm eects (e.g. Buonsanto et al., 1992). A complete disappearance of the F2-layer maximum at the usual heights implies strong changes in the thermosphere, as was shown by Mikhailov and Foster (1997) using Millstone Hill observations for that day.
Figure 4 (top panel) shows that the observed iono-spheric maximum around 200 km results from the superposition of two layers: a normal F1 layer at 175 km composed of molecular ions and a strongly reduced and distorted F2 layer composed of O+ions. Similar to
the previous case, the ionosphere on 10 April 1990 is enriched with molecular ions even at F2-layer heights. As we do not have a real quiet reference day, we can only compare 10 April with 9 April. The latter looks like a normal day with undisturbed ion composition (Fig. 4, bottom), although in fact it was a disturbed day as well (Table 1). The analysis has revealed that the main reason for the strong F2-layer depletion is the decrease in atomic oxygen concentration by a factor of 4.3 at 300 km altitude, accompanied by increased [N2] and
[O2] (Fig. 5, top right). Both, the increase in [N2] and
[O2] and in c1 due to enhanced temperature, and a high
electric ®eld result in an increment in the linear loss coecient b c1N2 c2O2 on 10 April with respect
Fig. 4. Same as Fig. 3 but for 9±10 April 1990. Calculated atomic oxygen and molecular ion concentrations are shown as well (in the upper panel)
to 9 April (by a factor of 1.6). This type of neutral composition changes is typical of the auroral zone where Joule heating results in atmospheric upwelling followed by a decrease in light atmospheric species and an increase in heavy species (e.g., ProÈlss and Fricke,1976; Trinks et al., 1976; ProÈlss, 1991). An additional reduc-tion of [O+] can be caused again by a downward plasma
drift. As in the 10 April 1990 case the calculated downward drift of 21 m/s hardly can be fully attributed to a » 100 m/s northward thermospheric wind, since usually a southward circulation is expected for disturbed days. Again the observed northwest ion drift (700 m/s) can easily give a contribution of several m/s to the measured downward line-of-sight plasma velocity.
Both the height of the Ne(h) maximum around
200 km, and the value of the electron concentration in the peak are determined by the height distribution of neutral gas concentrations. Large changes in the Tn(h)
pro®le are required to ®t the observed Ne(h) pro®le.
A very low value of the shape parameter, S 0.0055 km)1instead of 0.016 km)1predicted by
MSIS-83, and a reduced neutral temperature at 120 km (T120 385 K instead of 515 K from MSIS-83)
result-ed from the Ne(h) ®tting procedure, while Texis close to
the MSIS-83 prediction (Fig. 6, right panel). The
observed Ti(h) has a similar slope around 200 km
height, con®rming the obtained result of the low S value. Such a Tn(h) pro®le results in a moderate [O2] and
[N2] increase at 300 km height despite the 600-K
increase in Tex(Fig. 5, right panel).
A small value of S (0.011±0.013 km)1with respect to
the MSIS-83 predicted S 0.017 km)1) was obtained
for the same day, 10 April 1990 from the Millstone Hill data analysis (Mikhailov and Foster, 1997). Therefore the results of our calculations show a pronounced decrease in the neutral temperature in the lower thermosphere for this severe geomagnetic storm. We propose that this Tndecrease results from the enhanced
atmospheric cooling trough nitric oxide (Richards et al.,1982; Gerard and Roble, 1988). The increase of nitric oxide concentration during disturbed periods is well documented (e.g., Rush, 1973; Barth, 1989; Siskind et al.,1989 a,b). It should be mentioned that the MSIS-83 model shows a tendency for the S parameter to decrease with growing geomagnetic activity level repre-sented by the Ap index. The 10 April 1990 storm was a unique event with Ap 124 which cannot be properly described by an empirical model like MSIS-83.
We have solely used the long-pulse EISCAT results in this paper. A comparison of these data and CP1
Fig. 5. Calculated neutral composition (at 300 km) and exospheric temperature Tex(top and middle panels) and
calcu-lated vertical plasma drift (bottom pan-el) for 31 March±3 April 1992 (left) and 09±10 April 1990 (right)
multipulse data with their ®ner height resolution below 260 km has shown a noticeable dierence between the two sets of results. A systematic study of the cause of these dierences is beyond the scope of this paper. The fact is that the multipulse data above 200 km often suer from bad signal-to-noise ratio. The long-pulse data on the other hand may be unreliable below about 180 km because the pulse length (corresponding to about 40 km) does not adequately match the scale height of E-region structures. Since in our model the parameters Ne(h), Ti(h), Te(h), and Vl(h) are most important at
F2-region heights, we restricted our analysis to the long-pulse data.
It should also be noted that non-Maxwellian eects in the ion velocity distribution which become important in the presence of large electric ®elds have not been considered in our study. It is well known that these eects give rise to systematic errors in the interpretation of incoherent-scatter spectra [see Hubert et al. (1996) for a recent review]. For ®eld-aligned measurements as in the case of CP-1, however, these eects should be small even at electric ®elds of 85 mV/m (3 April 1992). The resulting uncertainties are within the overall error limits of our method which are discussed in Mikhailov and Schlegel (1997).
4 Summary
A self-consistent method for daytime F-region model-ling has been applied to EISCAT observations during two disturbed periods with a strong Ne decrease at
F2-layer heights. The main results of our analysis can be summarized as follows:
1. The large negative F2-layer storm eect on 3 April 1992 with an NmF2 reduction by a factor of 6.4
compared to the previous quiet period, is mostly due to strong electric ®eld (E » 85 mV/m), rather than to changes in neutral composition. This is attributed to the fact that the considered period was only about 4 h later than the storm onset. Additional contribution to the NmF2 reduction can result from a strong downward
plasma drift, although it is uncertain how much of this is due to geometrical eects.This is dierent from mid-latitude F2-layer storms where the vertical plasma drift is usually more positive due to enhanced equatorward thermospheric wind.
2. Unlike the 3 April 1992 case, the strong negative storm eect on 10 April 1990 with a complete disap-pearance of the F2-layer maximum at usual heights is
Fig. 6. Calculated and MSIS-83 Tn(h) pro®les together with the observed Ti(h) pro®le for the disturbed days 3 April 1992 (left) and 10 April 1990
(right)
Fig. 7. Observed NmF2 latitudinal variation for the chain of
European ionosonde stations: Kaliningrad, Uppsala, Lycksele, Kiruna and Tromso (EISCAT location)
mainly attributed to changes in neutral composition and temperature. Three processes are responsible for the observed F2-layer depletion: a reduction in [O] (by a factor of 4.3) causes a corresponding reduction of the O+production rate; the increase in [O
2], [N2], Tex, and
electric ®eld provide a substantial growth in the linear loss coecient b c1N2 c2O2 for O+ ions and
®nally a downward plasma drift.
3. The appearance of the ionospheric maximum around 200 km height is the result of the superposition of two layers: a normal F1 layer at 175 km and a depleted and distorted F2 layer with a maximum around 260 km height. The positions of both maxima are strongly controlled by the neutral composition, and a very small value of the shape parameter (S 0.0055 km)1) for the neutral temperature pro®le was
required to ®t the observed Ne(h).
4. A small value of the shape parameter S and a low neutral temperature at 120 km (T120 385 K instead
of 515 K predicted by MSIS-83) indicate strong cooling of the lower thermosphere. We propose that this cooling is due to enhanced nitric oxide concentration usually observed at these heights during geomagnetic storms.
Acknowledgements. The authors thank the Director and the sta of EISCAT for running the radar and providing the data. The EISCAT Scienti®c Association is funded by scienti®c agencies of Finland (SA), France (CNRS), Germany (MPG), Japan (NIPR), Norway (NF), Sweden(NFR), and the United Kingdom(PPARC). A.M. is grateful to the Max-Planck-Gesellschaft for a research stipend at the MPAE.
Topical Editor D. Alcayde thanks U. Lovhaug and another referee for their help in evaluating this paper.
References
Anderson, P. C., R. A. Heelis, and W. B. Hanson, The ionospheric signatures of rapid subauroral ion drifts, J. Geophys. Res., 96, 5785±5792, 1991.
Barth, C. A., Reference models for thermospheric NO, Hand MAP, 31, 1, 132±144, 1989.
Buonsanto, M. J., J. C. Foster, and D. P. Sipler, Observations from Millstone Hill during the geomagnetic disturbances of March and April 1990, J. Geophys. Res., 97, 1225±1243, 1992. Farmer, A. D., M. Lockwood, R. B. Horne, B. J. I. Bromage, and K.
S. C. Freeman, Field-perpendicular and ®eld-aligned plasma ¯ows observed by EISCAT during a prolonged period of northward IMF, J. Atmos. Terr. Phys., 46, 473±488, 1984.
Galperin, Y. I., Y. N. Ponomarev, and A. G. Zosinova, Direct measurements of ion drift velocity in the upper atmosphere during a magnetic storm, Cosmicheskie Issled, 11, 273±283, 1973.
GeÂrard, J.-C., and R. G. Roble, The role of nitric oxide on the zonally averaged structure of the thermosphere: solstice condi-tions for solar cycle maximum, Planet. Space Sci., 36, 271±279, 1988.
Hubert, D., F. Leblanc, and P. Galmard, Current state-of-the-art for the measurements of non-Maxwellian plasma parameters with the EISCAT UHF facility, Ann. Geophysicae, 14, 1506± 1512, 1996
Lathuillere, C., and A. Brekke, Ion composition in the auroral ionosphere as observed by EISCAT, Ann. Geophysicae, 3, 557± 568, 1985.
Mikhailov, A. V., and J. C. Foster, Daytime thermosphere above Millstone Hill during severe geomagnetic storm, J. Geophys. Res., 102, 17 275±17 282, 1997.
Mikhailov, A. V., and K. Schlegel, Self-consistent modelling of the daytime electron density pro®le in the ionospheric F region, Ann. Geophysicae, 15, 314±326, 1997.
ProÈlss, G. W., Thermosphere-ionosphere coupling during dis-turbed conditions, J. Geomagn. Geoelectr., 43, 537±547, 1991. ProÈlss, G. W., Ionospheric F-layer storms, In Handbook of
atmospheric electrodynamics, Vol.2, Ed. H. Volland, CRC Press, Boca Raton, pp. 195±248, 1995.
ProÈlss, G. W., and K. H. Fricke, Neutral composition changes during a period of increasing magnetic activity, Planet. Space Sci., 24, 61±67, 1976.
Richards, P. G., M. R. Torr, and D. C. Torr, The seasonal eect of nitric oxide cooling on the thermospheric UV heat budget, Planet. Space Sci., 30, 515±518, 1982.
Rush, D.W., Satellite ultraviolet measurements of nitric oxide ¯uorescence with a diusive transport model, J. Geophys. Res., 78, 5676 ±5686, 1973.
Schlegel, K., The study of tides and gravity waves with the help of ®eld-aligned velocities measured by EISCAT, J. Atmos. Terr. Phys., 48, 879±886, 1986.
Schunk, R. W., W. J. Raitt, and P. M. Banks, Eect of electric ®elds on the daytime high-latitude E and F regions, J. Geophys. Res., 80, 3121±3130, 1975.
Siskind, D. E., C. A. Barth, D. A. Evans, and R. G. Roble, The response of thermospheric nitric oxide to an auroral storm 1. Low and middle latitudes, J. Geophys. Res., 94, 16885±16898, 1989a.
Siskind, D. E., C. A. Barth, D. A. Evans, and R. G. Roble, The response of thermospheric nitric oxide to an auroral storm 2. Auroral latitudes, J. Geophys. Res., 94, 16899±16911, 1989b.
Trinks, H., S. Chandra, N. W. Spencer, and U. von Zahn, A two-satellite study of the atmosphere response to a major geomag-netic storm, J. Geophys. Res., 81, 5013±5017, 1976.