To link to this article:
DOI:10.1016/j.scitotenv.2010.09.006
http://dx.doi.org/10.1016/j.scitotenv.2010.09.006
This is an author-deposited version published in:
http://oatao.univ-toulouse.fr/
Eprints ID: 5708
To cite this version: Oeurng, C. and Sauvage, Sabine and Sanchez-Pérez,
José-Miguel Temporal variability of nitrate transport through hydrological response
during flood events within a large agricultural catchment in south-west France.
(2010) Science of the Total Environment, vol. 409 (n°1). pp. 140-149. ISSN
0048-9697
O
pen
A
rchive
T
oulouse
A
rchive
O
uverte (
OATAO
)
OATAO is an open access repository that collects the work of Toulouse researchers and
makes it freely available over the web where possible.
Any correspondence concerning this service should be sent to the repository
administrator:
[email protected]
Temporal variability of nitrate transport through hydrological response during
flood
events within a large agricultural catchment in south-west France
Chantha Oeurng
a, Sabine Sauvage
a,b,⁎
, José-Miguel Sánchez-Pérez
a,b aUniversité de Toulouse ; INPT ; UPS; ECOLAB (Laboratoire Ecologie Fonctionnelle);
Ecole Nationale Supérieure Agronomique de Toulouse (ENSAT) Avenue de l'Agrobiopole BP 32607 Auzeville Tolosane 31326 CASTANET TOLOSAN Cedex, France b
CNRS; ECOLAB (Laboratoire Ecologie Fonctionnelle); 31326 CASTANET TOLOSAN Cedex, France
a b s t r a c t
a r t i c l e i n f o
Keywords: Temporal variability Nitrate transport Hydrological response Flood eventsLarge agricultural catchment
The temporal variability of nitrate transport was monitored continuously in a large agricultural catchment, the 1110 km2Save catchment in south-west France, from January 2007 to June 2009. The overall aim was to analyse
the temporal transport of nitrate through hydrological response duringflood events in the catchment. Nitrate loads and hysteresis were also analysed and the relationships between nitrate and hydro-climatological variables withinflood events were determined. During the study period, 19 flood events were analysed using extensive datasets obtained by manual and automatic sampling. The maximum NO3−concentration duringflood varied from
8.2 mg l−1to 41.1 mg l−1withflood discharge from 6.75 m3s−1to 112.60 m3s−1. The annual NO 3
−loads in 2007
and 2008 amounted to 2514 t and 3047 t, respectively, with average specific yield of 2.5 tkm−12yr−1. The
temporal transport of nitrate loads during different seasonalflood events varied from 12 t to 909 t. Nitrate transport duringflood events amounted to 1600 t (64% of annual load; 16% of annual duration) in 2007 and 1872 t (62% of annual load; 20% of annual duration) in 2008. The level of peak discharge duringflood events did not control peak nitrate concentrations, since similar nitrate peaks were produced by different peak discharges. Statistically strong correlations were found between nitrate transport and total precipitation,flood duration, peak discharge and total water yield. These four variables may be the main factors controlling nitrate export from the Save catchment. The relationship between nitrate and discharge (hysteresis patterns) investigated throughflood events in this study was mainly dominated by anticlockwise behaviour.
1. Introduction
High nutrient levels in streams draining intensively cultivated catchments have become a widespread problem throughout Europe in recent decades (Heathwaite et al., 1996). Excessive application of nutrient fertilisers to agriculturalfields is considered to be the largest source of nitrogen input to European freshwater systems, and intensive crop production in recent decades has resulted in a major threat to surface water quality due to the transfer of sediment and nutrients with associated contaminants. Excessive nitrate concentra-tions in surface waters contribute to eutrophication and algae development (Garnier et al., 1995; Jarvie et al., 2005). In general, nitrate concentrations in groundwater and stream water are a matter of concern for Western countries and environmental management policies. Long-term nutrient concentration datasets are a key resource for environmental scientists, catchment managers and policy-makers because they permit analyses of nutrient trends, loads, nutrient
behaviour and the effectiveness of past nutrient migration and supporting data for future management decisions regarding issues of eutrophication and nutrient control (Burt, 2003). Therefore, monitoring programmes have been put in place to measure nutrient concentrations in water bodies such as in France (Probst, 1985), in north-eastern England (Bateman et al., 2006), in Central Europe (Haag and Kaupenjohann, 2001), in the Nordic and Baltic regions (Vagstad et al., 2004), and in Australia (DECC, 2007).
Hydrologically active periods, particularly flood events, are important because the addition of new water sources during such events mobilises distinctly new and different sources of nutrients from the catchment (Buda and DeWalle, 2009). However, the transfer of nutrients is also highly dependent on landscape characteristics and their influences on hydrological processes (Cirmo and McDonnell, 1997; Haag and Kaupenjohann, 2001). Knowledge of how hydrolog-ical response triggers nitrate transport at catchment level on the timescale of a single hydrologicalflood event is still lacking (Rusjan et al., 2008). The high frequency of data collection (nitrate and hydroclimatic data) duringflood event is important to understand the nitrate dynamics and can help to identify factors influencing dynamic processes and transport. Moreover, accurate quantification of nitrate loadings at annual scale is hard to achieve over long time scale due to
⁎ Corresponding author. Tel.: +33 5 34 32 39 85; fax: +33 5 34 32 39 01. E-mail address:[email protected](S. Sauvage).
lacking high data frequency. Observations of event-scale hydro-biogeochemical transport of nitrate can be highly complex and can vary from one catchment to another. Duringflood events, hysteresis is often observed in nutrient concentration and discharge relationships. The study of nitrate concentrations and discharge relationships during flood events could be a useful approach to identifying the nitrate sources (McDiffett et al., 1989). Clockwise nutrient hysteresis patterns are produced when a particular nutrient has a higher concentration during the rising stage of aflood hydrograph, compared with the falling stage. This means that the nutrient is rapidly transported to the sampling point during theflood event, implying that the nutrient load is coming from either within the river channel itself, of from a catchment source that is rapidly transported to the river and it could also indicate a depletion of nutrient supply through theflood event (Bowes et al., 2009). An anticlockwise hysteresis pattern is produced when the nutrient concentration is highest on the falling limb of the flood hydrograph, and these patterns can be produced by either a dominance of nutrient supply that is mobilised slowly during aflood event, or could indicate a rapid input of nutrient from a source with a nutrient concentration lower than that in the river (Bowes et al., 2009). Hysteresis patterns have been used in previous studies to indicate changing sources of nutrient supply to rivers and changes in nutrient form through storm events (House and Warwick, 1998; Bowes et al., 2005; Stutter et al., 2008).
So far, little investigation with high frequency of data collection has been carried out within large agricultural catchments, where there are many difficulties such as spatiotemporal variability in climatic conditions, land use, agricultural practices and soil texture. Field measurements and data collection are generally difficult tasks, rarely achieved over long time scales in large catchments. A water quality programme has been continuously running since January 2007 within the Save catchment in south-west France, with the aim of establishing comprehensive water, sediment and nitrate budgets. The present study examined the temporal transport of nitrate through hydrological response duringflood events within this large agricul-tural catchment. Analyses were also carried out to quantify the nitrate loads in stream water, to assess the relationships between nitrate and hydro-climatological variables during flood events and to study hysteresis.
2. Materials and methods 2.1. Study area
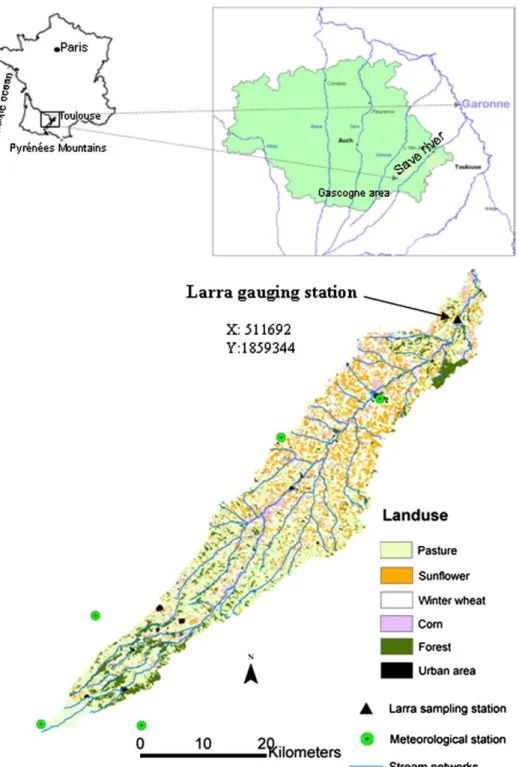
The Save catchment, located in the area of Coteaux Gascogne, France, is an agricultural catchment consisting of 1110 km2and has its
source in the piedmont zone of the Pyrenees Mountains (south-west France) at an altitude of 600 m, joining the Garonne River after a 140 km course with a linear shape and an average slope of 3.6‰ (Fig. 1). This catchment lies on detrital sediments from the Pyrenees Mountains. It is bordered on the east by the Garonne River, on the south by the Pyrenees and on the west by the Atlantic Ocean. Throughout the Oligocene and Miocene, this catchment served as an emergent zone of subsidence that received sandy, clay and calcareous sediments derived from the erosion of the Pyrenees Mountains, which were in an orogenic phase at that time. The heterogeneous materials were of low energetic value and produced a thick detrital formation of molasse type in the Miocene. From the Pleistocene onwards, the river became channelized, cutting broad valleys in the molassic deposits and leaving terraces of coarse alluvium (Revel and Guiresse 1995). The substratum of the catchment, known as the underlying geology, consists of impervious Miocene molassic deposits. Calcic luvisols (UN FAO soil units) have developed on the tertiary substratum and local rendosols on the hard calcareous sandstone beds. The calcic cambisols that developed on hillsides with very gentle slopes have been subjected to moderate erosion. Calcic soils represent dominantly
more than 90% in the whole catchment with a clay content ranging from 40% to 50%. Non-calcic silty soils, locally named boulbènes, represent less than 10% of the soil in this area (50–60% silt). The upstream part of the catchment is a hilly agricultural area mainly covered with pastures (5-year rotation including one year of corn and 4 of grazed fescue) and little forest, while the lower part isflat and devoted to intensive agriculture, dominantly a 2-year rotation of sunflower and winter wheat and little cornfields (90% of the area used for agriculture) (Fig. 1) (Macary et al., 2006). Fertilisers are generally applied from late winter to spring, with 20–100 kg Nha−1in pasture
areas (upstream) and 30–52 kg Nha−1 in sunflower and winter
wheat area (downstream). Forest areas are not fertilised, but corn fields also receive fertiliser quantity (20–100 kg Nha−1).
The climatic conditions are oceanic, with annual precipitation of 700–900 mm and annual evaporation of 500–600 mm. The dry period runs from June to August (the month with maximum deficit) and the wet period from October to May. The hydrological regime of the catchment is mainly pluvial, i.e. regulated by rainfall, with maximum discharge in May and lowflows during summer (July to September). The catchment substratum is relatively impermeable due to its high clay content. Consequently, the river discharge is mainly supplied by surface and subsurface runoff, and groundwater is limited to alluvial and colluvial phreatic aquifers. The maximum instantaneous dis-charge for the long-term period (1965–2006) is 620 m3s−1(1 July
1977) and mean annual discharge (1965–2006) is 6.29 m3
s−1(data from CACG: Compagnie d'Aménagement des Coteaux de Gascogne). During lowflow periods, the Save River is sustained by approximately 1 m3s−1from the Neste canal at the upstream area.
2.2. Instrumentation and sampling strategy
A Sonde YSI 6920 (YSI Incorporated, Ohio, USA) measuring probe and Automatic Water Sampler (ecoTech Umwelt-Meßsysteme GmbH. Bonn, Germany) with 24 one-litre bottles were installed at the Save catchment outlet (Larra bridge) in January 2007 to continuously monitor water quality (Fig. 2). The Sonde probe was placed near the bank of the river under the bridge, where homogeneity of water movement was considered for all hydrological conditions. The pump inlet was placed next to the Sonde pipe. The Automatic Water Sampler ecoTech connecting with the Sonde which was placed in the river, was programmed to activate pumping water on the basis of water level variations (Δx(cm)) ranging from 10 cm to 30 cm, depending on seasonal hydrological conditions for the rising and falling stages. This sampling method provided high sampling frequency during flood events. Manual sampling was also undertaken using a 2-litre bottle lowered from the Larra bridge, near the Sonde position, at weekly intervals when water levels were not very changeable.
2.3. Water sample analysis
During the study period (low and highflow periods), about 300 water samples were collected from automatic and manual sampling. These water samples werefiltered in the laboratory using a pre-weighed nitrocellulose filter (GF 0.45 μm) to separate out the suspended sediment fraction. After filtration, each water sample was stored at 4 °C until analysis as soon as possible. Nitrate (NO3−) was
determined with a Dionex (DX-120) instrument by the High Performance Ionic Chromatography (HPIC) method. Analyses were carried out in triplicate on 10% of all samples and on a standard control for every 10 samples to assess the reproductivity of the measurement, with the errors of less than 2%. Quality control standards were analysed alongside each batch. Temperature, pH and electric conductivity were measured by WTW instrument (pH/Cond 340i/SET) on weekly water samples in thefield.
2.4. Statistical analysis
Statistical analyses were performed using statistical techniques (Pearson correlation matrix) and Principal Component Analysis (PCA) in the STATISTICA package in order to determine the relationships between precipitation, discharge and nitrate variables (concentration and load). The results of these statistical analyses allowed factors influencing hydrological and nitrate responses during flood events to be identified. A database was generated for each flood event and contained two main groups of variables: antecedent variables to the flood conditions and flood variables (precipitation, discharge and nitrate concentrations during the flood). Variables used in the characterisation of floods are summarised in Table 1. Antecedent variables comprised accumulated precipitation one day before the
flood (P1d, mm), five days before (P5d), and ten days before (P10d), beginning baseflow (Qb) before the flood starts and the antecedent flood corresponding to the current flood (Qa). Flood variables comprised the precipitation that caused theflood as characterised by total precipitation (Pt) and hourly maximum intensity of the precipitation (Imax). Total water yield (Wt) during theflood was expressed by the total water depth of the event, total duration of the event (Fd), and mean (Qm) and maximum discharge (Qmax) corresponding to the time of rise to reach the peak discharge (Tr). The discharge speed to reach the peakflow during flood events was defined by flood intensity If (If=(Qmax−Qb) / Tr). Nitrate variables
comprised mean discharge-weighted nitrate concentration (Nm), maximumflood nitrate concentration (Nmax) and nitrate transport (load) duringflood events (Nt).
2.5. Data sources and load calculation
Mean total precipitation and intensity in the entire catchment were derived using the Thiessen Polygon method on data obtained fromfive meteorological stations (Meteo France) in the catchment (Fig. 1). Data on hourly discharge at the Larra hydrometric station were obtained from CACG (Compagnie d'Aménagement des Coteaux de Gascogne), which is responsible for hydrological monitoring in the Gascogne region. Discharge was plotted by the rating curve in which water level was measured hourly by pressure at a rectangular weir (length 12 m) and then transferred by teletransmission. The nitrate load for each flood event was calculated using the method
recommended by the Paris Commission for estimating river loads (Walling and Webb, 1985):
Load = V ×∑
n
i = 1ðCi × QiÞ
∑n i = 1Qi
where Ci is the instantaneous concentration for each sample point (mg l−1), Qi is the hourly discharge at each sample point (m3s−1), V
is the water volume over theflood period (m3) and n is the number of
samples. This is the preferred method forflux estimates given the available data (Littlewood, 1992) and is common in the literature for estimates of dissolved loads (e.g.Hope et al., 1997; Dawson et al., 2002; Worrall et al., 2003; Worrall and Burt, 2005).
Based on the high frequency of data collection (3 min to 24 h per sample duringflood) and weekly sampling during stable flow, a linear interpolation method was applied between two neighbouring instantaneous sampling points to construct a continuously nitrate concentration series, then we are able to calculate continuous daily load through the product of concentration and water volume. 3. Results
3.1. Hydro-meteorological context of observedflood events
The term‘flood’ is used here to refer to a complete hydrological event with rising and recession limbs. During the observation period, 19flood events were studied. There is not a particularly strong seasonal distribution in terms of event (5 in winter, 9 in spring and 5 in autumn) (Fig. 3).Table 2summarises allflood characteristics for all flood events studied. Total annual rainfall during the study period from January 2007 to June 2009 amounted to 1755 mm (603 mm in 2007, 787 mm in 2008 and 365 mm infirst 6 months of 2009). Major rainfall events generally occurred in autumn (October to December) and spring (March to June), with minor rainfall in summer (July to October). Total precipitation
Fig. 2. Instrumentation and sampling method based on manual and automatic sampling using Ecotech and Sonde YSI.
Table 1
Names, abbreviations and units for the variables used to characteriseflood events and to perform Pearson correlation matrix and factorial analysis.
Abbreviation Unit Antecedent event conditions
Accumulated precipitation 1 day before theflood P1d mm Accumulated precipitation 5 days before theflood P5d mm Accumulated precipitation 10 days before theflood P10d mm
Baseflow before the flood Qb m3
s−1 Antecedent maximum discharge Qa m3s−1
Flood event conditions
Flood duration Fd h
Time of rise (time to reach maximum discharge) Tr h Total precipitation during theflood Pt mm Maximum rainfall intensity of theflood Imax mm h−1
Flood intensity If m3min−2
Total water yield Wt hm3
Mean discharge Qm m3
s−1
Maximum discharge Qmax m3
s−1 Mean nitrate concentration Nm mg l−1 Maximum nitrate concentration Nmax mg l−1 Nitrate transport duringflood Nt t
duringflood events varied from 1.1 mm to 74.5 mm (mean=23.9 mm; st. dev.= 17.2 mm). The low total precipitation in event 18 (2 May 2009) was explained by high accumulated precipitation one day before the food event. The largest rainfall event was observed in winter 2009, with total precipitation of 74.5 mm on 27 Jan 2009. Maximum rainfall intensity in the whole catchment ranged from 0.7 to 17.2 mm h−1 (mean = 3.9 mm h−1; st. dev. = 3.5 mm h−1). The duration of flood events ranged from 95 h to 351 h, with a mean value of 172 h. Seven events were longer than average duration, while 12 events were shorter. Longer events with high magnitude mostly occurred in spring. However, the longestflood of 351 h occurred in winter, on 27 Jan 2009. This event was a 10-year return period flood. Maximum hourly discharge during observedflood events varied from 6.75 m3s−1(on 11 Dec 2007) to 112.60 m3s−1(on 27 Jan
2009) (mean = 31.79 m3s−1; st. dev = 24.19 m3s−1). The highest flood intensity (2.48 m3min−2) was recorded on 1 June 2008 with
the shortest time of 16 h to reach the peak, while the mean rising time to reach peakflood was 39 h (st. dev. = 18 h). The total water yield of the two full study years, 2007 and 2008, was 98 mm and 120 mm, respectively. These values are below the long-term mean
value of 136 mm for the period 1985–2008. A year was considered dry when the annual water yield was below the long-term value. Within this context, both years can be classified as dry but the first year (2007) was very dry, since no major floods occurred in autumn.
3.2. Temporal variability of nitrate concentrations and loads
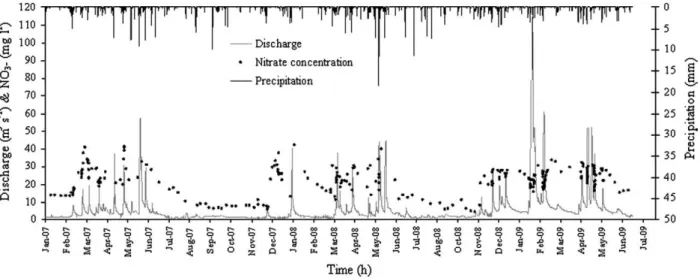
The temporal variability during all hydrological conditions (January 2007–June 2009) is shown inFig. 4. Generally, nitrate concentrations were at a minimum (5–10 mg l−1) from summer to early autumn and at
a maximum (15–42 mg l−1) from late winter to spring (all hydrological
conditions: discharge-weighted mean concentration = 22.1 mg l−1; st. dev. = 7.7 mg l−1). During flood periods, the maximum nitrate concentration ranged from 8.2 mg l−1on 11 Dec 2007 to 41.1 mg l−1on 2 May 2007 (Table 2) (mean= 29.5 mg l−1; st. dev. = 7.6 mg l−1). It is observed that the increase of nitrate concentration in the river following a smallflood event on 11 Dec 2007 reached the similar level of nitrate concentrations during the autumnfloods (November to December
Fig. 3. Hourly discharge with 19 studiedflood events and weekly measurement of pH, water temperature (T) electrical conductivity (EC) during study period.
Table 2
General characteristics of allflood events observed in the Save catchment during the study period (January 2007 to June 2009). No. Event date Season Number of samples Fd
(h) Tr (h)
If
(m3min−2) Pt(mm) Imax(mm h−1) Qb(m3s−1) Qm(m3s−1) Qmax(m3s−1) Wt(Hm3) Nm (mg l−1) Nmax(mg l−1) Nt(t) 1 13/02/07 Winter 7 132 55 0.11 15.6 4.8 1.89 4.20 7.97 2.13 15.9 17.7 34 2 27/02/07 Winter 8 140 30 0.47 9.6 1.4 3.61 6.67 17.62 3.82 30.2 41.0 115 3 09/03/07 Winter 8 164 41 0.37 7.5 1.3 3.83 6.05 19.11 4.12 28.2 34.2 116 4 25/03/07 Spring 8 139 21 0.72 12.6 2.6 3.83 7.74 18.94 3.68 6.6 29.0 24 5 02/05/07 Spring 7 200 21 1.27 20.2 2.5 3.61 10.30 30.36 5.79 35.3 41.1 204 6 11/12/07 Autumn 5 128 46 0.08 9.2 2.8 3.16 3.46 6.75 1.71 7.1 8.2 12 7 28/03/08 Spring 11 228 84 0.42 39.3 2.8 2.56 10.39 37.60 8.56 23.7 29.0 203 8 21/04/08 Spring 6 189 22 1.19 19.4 4.0 4.06 9.60 30.20 7.10 24.2 30.4 172 9 01/06/08 Spring 11 228 16 2.48 50.0 17.2 4.28 15.70 44.02 12.75 24.1 40.0 307 10 08/11/08 Autumn 4 105 46 0.22 23.8 4.6 2.96 6.18 12.97 2.40 16.4 24.8 39 11 26/11/08 Autumn 8 191 43 0.53 35.9 4.4 4.90 9.08 27.57 3.42 23.2 28.2 79 12 06/12/08 Autumn 5 126 54 0.28 27.7 5.3 4.90 10.12 19.77 3.21 25.2 27.7 81 13 14/12/08 Autumn 5 256 27 0.73 13.3 1.6 6.95 11.63 26.74 6.01 26.2 28.0 157 14 27/01/09 Winter 21 351 69 1.57 74.5 4.1 4.06 34.50 112.60 43.71 20.8 30.7 909 15 11/02/09 Winter 26 233 54 0.94 32.9 4.2 9.99 25.94 60.66 19.71 21.4 27.9 422 16 14/04/09 Spring 10 141 29 0.64 29.5 4.5 5.10 14.08 23.80 7.15 28.5 32.2 204 17 22/04/09 Spring 15 112 36 1.26 19.3 4.2 6.75 24.31 52.24 9.80 25.9 30.5 254 18 02/05/09 Spring 18 116 22 1.20 1.1 0.7 11.00 15.90 37.47 7.18 23.7 31.0 170 19 15/05/09 Spring 7 95 26 0.48 13.0 1.9 5.10 9.68 17.62 3.31 26.5 28.7 88 Maximum values in bold type, minimum values in bold italics.
2008) (Fig. 4). In both cases, the nitrate level is comparatively high to that during winter and springfloods.
The results from the study period demonstrate the temporal transport of nitrate load during different seasonalflood events. Less nitrate load was transported in autumn than in winter and spring due to lowerflood magnitude and the absence of crop fertilisation. The nitrate load transported during observedfloods varied from 12 t to 909 t (mean = 189 t; st. dev. = 203 t). The highest nitrate load (909 t) was transported during theflood with the highest magnitude and longest duration on 27 Jan 2009, while the lowest transport (12 t) was observed during theflood with the lowest magnitude on 11 Dec 2007. The variation in loads occurred from late winter to late spring due to highflood magnitude combined with long flood duration and high
nitrate availability after crop fertilisation (Fig. 5). Annual nitrate transport of 2007 and 2008 accounted for 2514 t (2.2 t km−12) and 3047 t (2.74 t km−12), with an average value of 2.5 t km−12y−1. Annual nitrate transport during floods was 1600 t (64% of annual load; 16% of annual duration) in 2007 and 1872 t (62% of annual load; 20% of annual duration) in 2008.
3.3. Relationships between nitrate and hydro-climatological variables Relationships between antecedent andflood event variables were assessed tofind the controlling factors influencing hydrological and nitrate response duringflood events in the Save catchment. A Pearson correlation matrix and factorial analysis that included all the
above-Fig. 4. Temporal variability of nitrate concentrations recorded between January 2007 and June 2009 at Larra station.
mentioned variables (Table 1) were generated for the 19flood events.
Table 3shows the relationships between precipitation, discharge and nitrate variables in the Save catchment. Total precipitation (Pt) showed a good correlation with mean discharge (Qm) (R = 0.64), maximum discharge (Qmax) (R = 0.76), and total water yield (Wt) (R = 0.79). Flood duration (Fd) was well correlated with Qmax, Wt and Pt. Mean and maximum nitrate concentrations had weak relationship with Pt (R = 0.04 and R = 0.18, respectively). Nmax was fairly correlated withflood intensity (If) (R=0.58), but lowly correlated withflood duration (Fd) and discharge variables (Qb, Qm and Qmax). Nitrate transport (Nt) showed a strong relationship with Pt (R = 0.78) and Fd (R = 0.79) and very strongly significant correlations with peak discharge and total water yield duringflood events (R = 0.97 and R = 0.99, respectively). However, weaker relationships were found between nitrate variables and antecedent conditions of the catchment (baseflow, antecedent flood discharge and antecedent precipitation P1d, P5d and P10d).
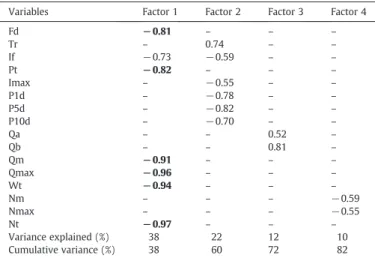
In the Principal Component Analysis (PCA) taking samples and variables into account, two factors explained 60% of the total variance. Factor 1, which explained 38% of the total variance, was characterised by a high negative Eigen-value (N0.80) for total rainfall (Pt), mean and maximum discharge (Qm; Qmax),flood duration (Fd), total water yield (Wt) and nitrate transport (Nt), which suggests a response of nitrate load transport through hydrological responses duringflood events. Four factors were retained for rotational analysis. A summary of varimax rotated factor of all variables is given inTable 4. Thefirst four axes absorbed 82% of the total variance.
3.4. Nitrate concentrations and discharge relationships
There is a scattered distribution of nitrate concentration versus discharge duringflood response. The relationship between nitrate concentration and discharge within the 19 flood events observed revealed the existence of hysteresis effects with dominant anticlock-wise behaviour in the Save catchment. However, clockanticlock-wise patterns were produced when the nitrate concentration was high at the rising limb of theflood hydrograph, compared with the falling limb.Fig. 6
shows hysteresis patterns for selected seasonalflood events (winter, spring and autumn). The width and the slope of the patterns differed substantially. The autumn and winter loops (Fig. 6A and C) wereflat and the increase in nitrate concentration over the initial (pre-event) nitrate concentration was very small, giving very slight variation in nitrate with changeable discharge; whereas, the spring loops (Fig. 6B) were wider due to significant variability in nitrate concentrations. The hysteresis patterns in the nitrate concentration and the discharge relationship during the hydrological response provided an indication
of the nitrate sources and nitrate delivery process occurring within the catchment duringflood events.
4. Discussion
4.1. Temporal variability of nitrate transport during hydrological response Nitrate concentrations in streamwater of agricultural catchments often exhibit interannual variations, which are supposed to result from land use changes, as well as seasonal variations mainly explained by the effect of hydrological and biogeochemical cycles (Martin et al., 2004). Analysis of nitrate concentrations collected during all hydro-logical conditions in the Save catchment provided an insight into the characteristics of nitrate transport variability in this large agricultural catchment during flood events. Hydrological response caused an increased variability of nitrate and raised stream nitrate concentra-tions (Fig. 4). Maximum nitrate concentrations generally increased duringflood events and crop fertilisation periods (Fig. 4). However, the increase of nitrate concentration following the smallflood event on 11 Dec 2007 and that during the autumn floods (Fig. 4) are similarly high to that during winter and spring floods. The high concentration could be linked with extreme meteorological condi-tions which occurred from summer to early autumn with lack of precipitation and low flow conditions (Rusjan et al., 2008).
Table 3
Pearson correlation matrix of all variables (n = 19).
Fd Tr If Pt Imax P1d P5d P10d Qa Qb Qm Qmax Wt Nm Nmax Nt
Fd 1.00 Tr 0.33 1.00 If 0.49 −0.37 1.00 Pt 0.74 0.47 0.48 1.00 Imax 0.21 −0.13 0.61 0.53 1.00 P1d 0.16 −0.51 0.45 0.04 0.31 1.00 P5d 0.07 −0.37 0.40 0.12 0.50 0.76 1.00 P10d −0.18 −0.42 0.39 −0.04 0.48 0.34 0.62 1.00 Qa 0.13 0.07 0.20 0.17 0.03 −0.18 0.06 0.02 1.00 Qb 0.02 −0.24 0.29 −0.15 −0.15 −0.28 −0.11 0.05 0.61 1.00 Qm 0.58 0.21 0.62 0.64 0.17 −0.14 −0.11 −0.03 0.46 0.50 1.00 Qmax 0.75 0.32 0.63 0.76 0.17 −0.07 −0.12 −0.13 0.32 0.31 0.95 1.00 Wt 0.78 0.37 0.55 0.79 0.18 −0.01 −0.09 −0.19 0.29 0.19 0.89 0.97 1.00 Nm 0.14 −0.20 0.27 0.04 −0.04 0.18 0.13 0.01 0.16 0.19 0.17 0.14 0.04 1.00 Nmax 0.24 −0.40 0.58 0.18 0.19 0.30 0.19 0.06 0.13 0.13 0.25 0.27 0.18 0.75 1.00 Nt 0.79 0.32 0.60 0.78 0.19 0.05 −0.04 −0.15 0.31 0.21 0.90 0.97 0.99 0.18 0.27 1.00 Correlations significant at Pb0.01 marked in bold and at Pb0.05 marked in italics.
Table 4
Summary of varimax rotated factor for all variables presented inTable 1(Eigen-values b0.50 were excluded).
Variables Factor 1 Factor 2 Factor 3 Factor 4
Fd −0.81 – – – Tr – 0.74 – – If −0.73 −0.59 – – Pt −0.82 – – – Imax – −0.55 – – P1d – −0.78 – – P5d – −0.82 – – P10d – −0.70 – – Qa – – 0.52 – Qb – – 0.81 – Qm −0.91 – – – Qmax −0.96 – – – Wt −0.94 – – – Nm – – – −0.59 Nmax – – – −0.55 Nt −0.97 – – – Variance explained (%) 38 22 12 10 Cumulative variance (%) 38 60 72 82 Significant variables with Eigen–values >0.80.
Hydrologically, nitrate could not be mobilized from the soil horizons until the occurrence offloods in autumn (November to December). When the early seasonal rainfall starts, the saturation zone rises towards upper soil layers enriched by the accumulated nitrate pool during the previous seasons, more nitrate isflushed into the river (Sánchez–Pérez et al., 2003a).
The responses of differentflood discharge magnitudes showed little variability in concentrations, indicating that the level of discharge increase did not control the increase in nitrate concentration (similar nitrate peaks were caused by different peak discharges). This can be observed inflood on 02 May 2007 (Qmax=30.36 m3s−1; Nmax=41.1 mg l−1), on 01
June 2008 (Qmax =44.02 m3s−1; Nmax=40 mg l−1), on 27 Jan 2009
(Qmax =112.60 m3s−1; Nmax=30.7 mg l−1) and on 14 April 2009
(Qmax =23.80 m3s−1; Nmax=32.2 mg l−1). A weak statistical
rela-tionship was found between peak discharge and peak nitrate concentra-tion (R=0.27), due to the peak nitrate concentraconcentra-tion mainly occurring after the peak discharge. During the study period, the Neste canal at the upstream area has very slight nitrate contribution to the main river since the canal water originates from the Piedmont of Pyrenean Mountain with nitrate concentration of approximately 1 mg l−1only.Rusjan et al. (2008)
showed in a study on a 42.1 km2catchment that the nitrate concentration
peaks during all hydrologicalflood events were reached with a certain delay after the occurrence of discharge peaks. However, the strong relationship observed between peak discharge and peak nitrate in that study indicates there is probably a mechanism controlling the temporal
transport of nitrate on catchment level beyond the interactive behaviour of hydrological and biogeochemical settings. In particular, groundwater fluctuation in the riparian zone near the catchment outlet and in a relatively shallower zone may be critical factors contributing to stream-water nitrate (Ohte et al., 2003). Various studies have reported that nutrients areflushed out of the landscape during hydrologically active periods particularly duringflood events, while they are retained in drier periods (Creed et al., 1996; Sickman et al., 2003; Burns, 2005; Rozemeijer and Broers, 2007). However, some authors emphasize the hydrological connectivity (Pringle, 2003), which refers to the spatially and temporally variable hydrological pathways along which matter is transferred from the land surface to the catchment outlet (Haag and Kaupenjohann, 2001; Mitchell, 2001; Weng et al., 2003; Inamdar et al., 2004). Severalfield studies (Band et al., 2001; McHale et al., 2002; Inamdar et al., 2004) have addressed theflushing of nitrate during flood events but the actual mechanisms responsible for the rapid nitrate export duringflood events remain relatively uncertain (Weiler and McDonnell, 2006).
The different sources of nitrate and rainfall distribution in the Save catchment could be key factors determining the nitrate variability in stream water during hydrologicalflood events. Variable source areas that expand and contract laterally during the hydrological events can be ascribed to the topographical framework, as proposed byCreed and Band (1998)and tested on hillslope scale byWeiler and McDonnell (2006). Nutrient concentrations are often found to decrease markedly with depth in the soil profile (Bishop et al., 2004). The rising limb of
theflood is accompanied by lateral expansion of variable source areas (which can also be described as areas of saturated soil profile), intensifying the transport of nitrate from soil horizons.
Although the nitrate concentrations did not vary greatly from one flood event to another in the present study, the nitrate transport during theseflood events varied significantly, from 12 t to 909 t. The maximum quantity of nitrate transport occurred on 27 Jan 2009, when theflood was the largest of all 19 floods observed. Statistical analysis revealed a strong correlation between nitrate transport (Nt) and total precipitation,flood duration discharge, peak discharge and total water yield. These variables could be the main factors controlling nitrate export in water from the Save catchment. The quantity of nitrate transported during the two full hydrological years studied was slightly different (2514 t in 2007 and 3047 t in 2008). As can be seen fromFig. 5, the trend of cumulative nitrate load transport was similar in both years until late spring but differed in late autumn due to increasingflood events in autumn 2008, while autumn 2007 had only one smallflood contributing little nitrate load. In contrast,Oeurng et al. (2010)found that suspended sediment transport within the Save catchment during the same hydrological periods was signi fi-cantly different between 2007 and 2008 (16 614 t in 2007 and 77 960 t in 2008). Additionally, nitrate loads during flood events represented approximately 60% of the annual load in both hydrolog-ical years, whereas sediment load transport represented about 90%. There is therefore a significant difference in the transport behaviour of nitrate and suspended sediment within the same catchment. Nitrate variations could be attributed to the effect of both hydrological and biogeochemical cycles (Martin et al., 2004) but suspended sediment transport is physically dependent of land use practices, hydrological driving force as well as physiographic factors.
The average rate of nitrate exportation during the two-year study (2.5 t km−12y−1) was within the range reported previously for the Garonne river (1–5 tkm−12y−1) (Probst, 1985). In the downstream
area of the Save catchment, where sunflower, winter wheat and corn are grown, the specific yield of nitrate locally can exceed the specific yield of the whole catchment. It can be therefore assumed that nitrate export from the upstream part of the Save catchment, which is mainly dominated by pasture receiving limited amounts of fertilisers and by small forests receiving no fertilisers, is smaller than the nitrate contribution at the downstream where intensive agriculture is mainly adopted. The N fertiliser doses commonly applied to agricultural pastures in the Save catchment (20–100 kg Nha−1) are low compared
with some areas of the world that have application rates of more than 500 kg N ha−1y−1(Chapin et al., 2002). In this case, to have a better understanding of the nitrate source contribution between the down-stream and updown-stream area, another sampling station could be considered in the section which separates these different land use areas. The specific nitrate yield of the Save catchment (2.5 tkm−12y−1)
was much higher than that of a 13000 km2 agriculture-dominated
catchment in south-east Spain (0.88 t km−12y−1) (Lorite-Herrera et al., 2009). This was due to the lower total rainfall in the latter (mean annual value 418 mm) contributing less streamflow than in the Save catchment.
4.2. Nitrate concentrations and discharge relationships
A clockwise pattern indicates that nitrate is rapidly transported to the catchment outlet duringflood events, implying that the nitrate load comes from either within the river channel itself or from catchment sources that are rapidly transported to the catchment outlet (Bowes et al., 2009). It could also indicate a depletion of nitrate supply possibly resulting from a consequence of dilution effect during flood event. However, anticlockwise patterns were mainly found in most seasons within the Save catchment. It can be concluded, as suggested by
Butturini et al. (2006), that the runoff component is not the prevailing contributor to nitrate load and that intensive solutionflushing proceeds
during the recession discharge limbs. The anticlockwise patterns may be associated with limited mobilisation of nitrate in the antecedent dry periods (summer) and therefore low concentrations of nitrate in the stream and accumulation of nitrate during summer periods were hydrologically disconnected in upper soil horizons. The loops (Fig. 6B) became steeper and wider duringfloods in spring due to the high variability of nitrate concentrations. The high concentrations during the spring season can be associated with nutrient availability through fertiliser application from January to April in downstream catchment areas where arable crops are grown (Fig. 1). They can also be attributed to theflood magnitude in the spring season reaching the capacity to mobilise nitrate from deeper soil horizons containing high NO3−
concentrations in the soil solution as a result of crop fertilisation and nitrate leaching in soil with percolating rainfall (Sánchez–Pérez et al., 2003b). The predominantly anticlockwise hysteresis in the Save catchment could be explained by increasing nitrate concentrations at the recessionflood from distant source areas within the catchment and nitrate delivery being slowly mobilised from deep soil horizons to the sampling station. This could occur when the rainfall event takes place in upstream areas since the travel time of water (and its nitrate load) is slow within this long thin catchment. Moreover, the discharge of shallow groundwater could influence nitrate dynamics since various studies (Ohte et al., 2003; Martin et al., 2004; Lapworth et al., 2008) have demonstrated the role of shallow groundwater influencing the stream nitrate variability. Therefore, it could be also the case in the Save catchment where shallow groundwater contributed more nitrate to the streamwater during the recession period offlood events after the rise of the saturation zone towards upper soil layers enriched by the accumulated nitrate pool.
However, identification of the nitrate sources in the Save catchment with spatial variability in land use from the nitrate delivery process using hysteresis patterns is rather unclear, since it is difficult to interpret nitrate sources when the hysteresis shape is mostlyflat with slight variations in nitrate concentration during autumn and winter. The hysteresis study just only provides some basic under-standing of probable nitrate sources referring to the sampling location. Moreover, water sampling was only carried out at the outlet of this long thin catchment and to better understand the nitrate transport process, the dynamics in the river at the mid-point of the catchment should be considered.
5. Conclusions
This study of temporal nitrate transport through hydrological response during floods in a large agricultural catchment showed significant nitrate transport (12–909 t) during flood events, even though the nitrate concentration did not vary significantly with changes in peak discharge. Nitrate transport during flood events amounted to 1600 t (64% of annual load; 16% of annual duration) in 2007 and 1872 t (62% of annual load; 20% of annual duration) in 2008. Annual nitrate transport amounted to 2514 t (2.26 t km−12) in 2007 and 3047 t (2.74 t km−12) in 2008, with average specific yield of 2.5 t km−12y−1. Statistical analysis revealed strong correlations between nitrate transport and total precipitation, flood duration, peak discharge and total water yield, indicating that these four variables may be the main factors controlling nitrate exports from the Save catchment. Therefore, hydrological response duringflood events proved to be important for nitrate load delivery from the catchment. The relationship between nitrate and discharge (hysteresis patterns) investigated throughflood events in this study was mainly dominated by anticlockwise behaviour, with wide and steep patterns in spring due to increasing nitrate concentration variability over the falling limb of theflood hydrograph. The hysteresis pattern during autumn and winter was flat because of low variation in nitrate concentrations. The dominance of anticlockwise hysteresis was attributed to distant source areas within the catchment and the
process of slow mobilisation of nitrate from deeper soil horizons. The interpretation of nitrate sources based on discharge and nitrate concentration relationship is still uncertain because of the difficulty in interpreting nitrate sources when the hysteresis shape is mostlyflat during autumn and winter.
With only 2.5 years of data collection, it is difficult to characterise long-term interannual variability of nitrate transport in a large agricultural catchment like the Save since it is difficult to obtain long-term datasets fromfield work. Additionally, the accurate sources of nitrate cannot be clearly determined without taking into account the spatial variability of the land use and additional spatially explicit sampling locations in such a large catchment with strong variability. However, the data collection with high frequency at the catchment outlet during this study will be necessarily served for future modelling work in order to characterise long-term nitrate variability and to identify the spatial contribution of nitrate sources within this catchment. Acknowledgements
This study was financially supported by a doctoral research scholarship from the French government in cooperation with Cambodia. The work was performed within the framework of the GIS-ECOBAG, Programme P2 Garonne Moyenne and IMAQUES, and supported by funds from CPER and FEDER (grants no OPI2003-768) of the Midi-Pyrenees Region, Zone Atelier Adour Garonne (ZAAG) of PEVS/CNRS347 INSUE and the EU INTEREG SUDOE IVB AguaFlash project (http://www. aguaflash-sudoe.eu/). We sincerely thank the CACG for discharge data and Meteo France for meteorological data. The authors would also like to thank Gael Durbe and Frédéric Julien for access to the site and assistance with monitoring instruments and in laboratory. Great thanks were particularly delivered to two anonymous referees whose comments greatly improve the manuscript.
References
Band LE, Tague CL, Groffman P, Belt K. Forest ecosystem processes at the watershed scale: hydrological and ecological controls of nitrogen export. Hydrol Process 2001;15(10):2013–28.
Bateman IJ, Brouwer R, Davies H, Day BH. Analysing the agricultural costs and non-market benefits of implementing the Water Framework Directive. J Agric Econ 2006;57:221–38.
Bishop K, Seibert J, Kohler S, Laudon H. Resolving the double paradox of rapidly mobilized old water with highly variable responses in runoff chemistry. Hydrol Process 2004;18(1):185–9.
Bowes MJ, House WA, Hodgkinson RA, Leach DV. Phosphorus discharge hysteresis during storm events along a river catchment: the River Swale. UK. Water Res 2005;39(5):751–62.
Bowes MJ, Smith JT, Neal C. The value of high-resolution nutrient monitoring: a case study of the River Frome, Dorset, UK. J Hydrol 2009;378:82–96.
Buda AR, DeWalle DR. Dynamics of stream nitrate sources andflow pathways during stormflows on urban, forest and agricultural watersheds in central Pennsylvania, USA. Hydrol Process 2009;23:3292–305.
Burns D. What do hydrologists mean when they use the termflushing? Invited commentary. Hydrol Process 2005;19:1325–7,doi:10.1002/hyp. 5860. Burt TP. Monitoring change in hydrological systems. Sci Total Environ 2003;310(1–3):
9-16.
Butturini A, Gallart F, Latron J, Vazquez E, Sabater F. Cross-site comparison of variability of DOC and nitrate c–q hysteresis during the autumn–winter period in three Mediterranean headwater streams: a synthetic approach. Biogeochemistry 2006;77:327–49.
Chapin FSI, Matson P, Mooney HA. Principles of terrestrial ecosystem ecology. New York: Springer; 2002. p. 472.
Cirmo CP, McDonnell JJ. Linking the hydrologic and biogeochemical controls of nitrogen transport in near-stream zones of temperate forested catchments: a review. J Hydrol 1997;199:88-120,doi:10.1016/S0022-1694(96)03286-6. Creed IF, Band LE. Export of nitrogen from catchments within a temperate forest:
evidence for a unifying mechanism regulated by variable source area dynamics. Water Resour Res 1998;34:3105–20.
Creed IF, Band LE, Foster NW, Morrison IK, Nicolson JA, Semkin RS, et al. Regulation of nitrate-N release from temperate forests: a test of the Nflushing hypothesis. Water Resour Res 1996;32(11):3337–54,doi:10.1029/96WR02399.
Dawson JC, Billet MF, Neil C, Hill S. A Comparison of particulate, dissolved and gaseous carbon in two contrasting upland streams in the UK. J Hydrol 2002;257:226–46. DECC. Workshop to inform the development of a NSW diffuse source water pollution
strategy. Southern Workshop Report (Batemans Bay). Department of Environment and Climate Change, Sydney; 2007.
Garnier J, Billen G, Coste M. Seasonal succession of diatoms and chlorophycae in the drainage network of the river Seine: observations and modelling. Limnol Oceanogr 1995;40(4):750–65.
Haag D, Kaupenjohann M. Landscape fate of nitratefluxes and emissions in Central Europe — a critical review of concepts, data, and models for transport and retention. Agr Ecosyst Environ 2001;86:1-21,doi:10.1016/S0167-8809(00)00266-8.
Heathwaite AL, Johnes PJ, Peters NE. Trends in nutrients. Hydrol Process 1996;10:263–93. Hope D, Billet MF, Cresser MS. Exports of organic carbon from two river systems in NE
Scotland. J Hydrol 1997;193:61–82.
House WA, Warwick MS. Hysteresis of the solute concentration/discharge relationship in rivers during storms. Water Res 1998;32(8):2279–90.
Inamdar SP, Christopher SF, Mitchell MJ. Export mechanisms for dissolved organic carbon and nitrate during summer storm events in a glaciated forested catchment in New York, USA. Hydrol Process 2004;18(14):2651–61.
Jarvie HP, Neal C, Withers PJA, Wescott C, Acornley RM. Nutrient hydrochemistry for a groundwater-dominated catchment: the Hampshire Avon, UK. Sci Total Environ 2005;344:143–58.
Lapworth D, Shand P, Abesser C, Darling W, Haria A, Evans C, et al. Groundwater nitrogen composition and transformation within a moorland catchment, mid-Wales. Sci Total Environ 2008;390:241–54.
Littlewood IG. Estimating constituent loads in rivers: a review. Wallingford, UK: Institute of Hydrology; 1992. p. 81.
Lorite-Herrera M, Hiscock K, Jiménez-Espinosa R. Distribution of dissolved inorganic and organic nitrogen in river water and groundwater in an agriculturally-dominated catchment, South-East Spain. Water Air Soil Pollut 2009;198:335–46. Macary F, Lavie E, Lucas G, Riglos O. Méthode de changement d'échelle pour
l'estimation du potentiel de contamination des eaux de surface par l'azote. Ingénieries - E A T 2006 ; 46: 35–49.
Martin C, Aquilina L, Gascuel-Odoux C, Molenat J, Faucheux M, Ruiz L. Seasonal and interannual variations of nitrate and chloride in stream waters related to spatial and temporal patterns of groundwater concentrations in agricultural catchments. Hydrol Process 2004;18:1237–54.
McDiffett WF, Beidler AW, Dominick TF, McCrea KD. Nutrient concentration–stream discharge relationships during storm events in a 1st-order stream. Hydrobiologia 1989;179:97-102.
McHale MR, McDonnell JJ, Mitchell MJ, Cirmo CP. Afield-based study of soil water and groundwater nitrate release in an Adirondack forested watershed. Water Resour Res 2002;38:1031–47.
Mitchell MJ. Linkages of nitrate losses in watersheds to hydrological processes. Hydrol Process 2001;15(17):3305–7,doi:10.1002/hyp. 503.
Oeurng C, Sauvage S, Sánchez–Pérez JM. Dynamics of suspended sediment transport and yield in a large agricultural catchment, southwest France. Earth Surf Processes Lanforms 2010;35:1289–301.
Ohte N, Tokuchi N, Katsuyama M, Hobara S, Asano Y, Koba K. Episodic increases in nitrate concentrations in streamwater due to the partial dieback of a pine forest in Japan: runoff generation processes control seasonality. Hydrol Process 2003;17:237–49. Pringle C. What is hydrologic connectivity and why is it ecologically important? Hydrol
Process 2003;17:2685–9,doi:10.1002/hyp. 5145.
Probst JL. Nitrogen and phosphorus exportation in the Garonne basin (France). J Hydrol 1985;76:281–305.
Revel JC, Guiresse M. Erosion due to cultivation of calcareous clay soils on the hillsides of south west France. I. Effect of former farming practices. Soil Tillage Res 1995;35 (3):147–55.
Rozemeijer JC, Broers HP. The groundwater contribution to surface water contamination in a region with intensive agricultural land use (Noord-Brabant, The Netherlands). Environ Pollut 2007;148(3):695–706,doi:10.1016/j.envpol.2007.01.028. Rusjan S, Brilly M, Mikoš M. Flushing of nitrate from a forested watershed: an insight
into hydrological nitrate mobilization mechanisms through seasonal high-frequency stream nitrate dynamics. J Hydrol 2008;354:187–202.
Sánchez–Pérez JM, Vervier P, Garabétian F, Sauvage S, Loubet M, Rols JL, et al. Nitrogen dynamics in the shallow groundwater of a riparian wetland zone of the Garonne, SW France: nitrate inputs, bacterial densities, organic matter supply and denitrification measurements. Hydrol Earth Syst Sci 2003a;7(1):97-107. Sánchez–Pérez JM, Antiguedad I, Arrate I, García-Linares C. The influence of nitrate
leaching through unsaturated soil on groundwater pollution in an agricultural area of the Basque country: a case study. Sci Total Environ 2003b;317:173–87. Sickman JO, Leydecker A, Chang CCY, Kendall C, Melack JM, Lucero DM, et al. Mechanisms
underlying export of N from high elevation catchments during seasonal transitions. Biogeochemistry 2003;64:1-24,doi:10.1023/A:1024928317057.
Stutter MI, Langan SJ, Cooper RJ. Spatial contributions of diffuse inputs and within-channel processes to the form of stream water phosphorus over storm events. J Hydrol 2008;350(3–4):203–14.
Vagstad N, Stälnacke P, Andersen HE, Deelstra J, Jansons V, Kyllmar K, et al. Regional variations in diffuse nitrogen losses from agriculture in the Nordic and Baltic regions. Hydrol Earth Syst Sci 2004;8:651–62.
Walling DE, Webb BW. Estimating the discharge of contaminants to coastal waters by rivers: some cautionary comments. Mar Pollut Bull 1985;16:488–92.
Weiler M, McDonnell JJ. Testing nutrientflushing hypotheses at the hillslope scale: a virtual experiment approach. J Hydrol 2006;319:339–56.
Weng P, Sánchez–Pérez JM, Sauvage S, Vervier P, Giraud F. Assessment of the quantitative and qualitative buffer function of an alluvial wetland: hydrological modelling of a large floodplain (Garonne River, France). Hydrol Process 2003;17:2375–92.
Worrall F, Burt T. Predicting the future DOCflux from upland peat catchments. J Hydrol 2005;300:126–39.
Worrall F, Reed M, Warburton J, Burt TP. Carbon budget for a British upland peat catchment. Sci Total Environ 2003;312:133–46.