To link to this article:
DOI: 10.1016/j.jhazmat.2011.09.012
http://dx.doi.org/10.1016/j.jhazmat.2011.09.012
This is an author-deposited version published in:
http://oatao.univ-toulouse.fr/
Eprints ID: 5435
To cite this version:
Boithias, Laurie and Sauvage, Sabine and Taghavi, Lobat and Merlina, Georges
and Probst, Jean-Luc and Sánchez Pérez, José Miguel Occurrence of
metolachlor and trifluralin losses in the Save river agricultural catchment
during floods. (2011) Journal of Hazardous Materials, vol. 196 . pp. 210-219.
ISSN 0304-3894
O
pen
A
rchive
T
oulouse
A
rchive
O
uverte (
OATAO
)
OATAO is an open access repository that collects the work of Toulouse researchers and
makes it freely available over the web where possible.
Any correspondence concerning this service should be sent to the repository
Occurrence
of
metolachlor
and
trifluralin
losses
in
the
Save
river
agricultural
catchment
during
floods
Laurie
Boithias
a,b,∗,
Sabine
Sauvage
a,b,
Lobat
Taghavi
a,b,1,
Georges
Merlina
a,b,
Jean-Luc
Probst
a,b,
José
Miguel
Sánchez
Pérez
a,b,∗aUniversityofToulouse;INP,UPS;Laboratoired’EcologieFonctionnelleetEnvironnement(EcoLab);ENSAT,Avenuedel’Agrobiopole,31326CastanetTolosanCedex,France bCNRS,EcoLab,31326CastanetTolosanCedex,France
a
r
t
i
c
l
e
i
n
f
o
Keywords: Floods Metolachlor Trifluralin SWATmodel Saverivera
b
s
t
r
a
c
t
Risingpesticidelevelsinstreamsdrainingintensivelymanagedagriculturallandhaveadetrimentaleffect onaquaticecosystemsandrenderwaterunfitforhumanconsumption.TheSoilandWaterAssessment Tool(SWAT)wasappliedtosimulatedailypesticidetransferattheoutletfromanagriculturally inten-sivecatchmentof1110km2(Saveriver,south-westernFrance).SWATreliablysimulatedbothdissolved
andsorbedmetolachlorandtrifluralinloadsandconcentrationsatthecatchmentoutletfrom1998to 2009.Onaverage,17kgofmetolachlorand1kgoftrifluralinwereexportedatoutleteachyear,with annualrainfallvariationsconsidered.Surfacerunoffwasidentifiedasthepreferredpathwayfor pesti-cidetransfer,relatedtothegoodcorrelationbetweensuspendedsedimentexportationandpesticide,in bothsolubleandsorbedphases.Pesticideexportationratesatcatchmentoutletwerelessthan0.1%of theappliedamount.Atoutlet,SWAThindcastedthat(i)61%ofmetolachlorand52%oftrifluralinwere exportedduringhighflowsand(ii)metolachlorandtrifluralinconcentrationsexceededEuropean drink-ingwaterstandardsof0.1gL−1forindividualpesticidesduring149(3.6%)and17(0.4%)daysofthe 1998–2009periodrespectively.SWATwasshowntobeapromisingtoolforassessinglargecatchment rivernetworkpesticidecontaminationintheeventoffloodsbutfurtherusefuldevelopmentsofpesticide transfersandpartitioncoefficientprocesseswouldneedtobeinvestigated.
1. Introduction
Risingpesticidelevels in streamwatersdraining intensively managedagriculturalland have becomea widespread problem throughout Europe in recent decades. Intensive agriculture is knowntohave adetrimentaleffect onsoils,surfacewater and groundwaterquality,leadingtoacuteproblemssuchassoilerosion andwatercontamination[e.g.1–4].Excessiveloadingofpesticides, transferredintotheenvironmentthroughvariouspathways(e.g. surfacerunoff,subsurfaceandgroundwaterflows)eitherin solu-tionorsorbedontoparticles,maybeharmfultoterrestrialand aquaticecosystems[5–8],renderingstreamwaterand groundwa-terunfitforhumanconsumption.
∗ Correspondingauthorsat:UniversityofToulouse,INPT,UPS,Laboratoire Ecolo-gieFonctionnelleetEnvironnement(EcoLab),ENSAT,Avenuedel’Agrobiopole, 31326CastanetTolosanCedex,France.Tel.:+33534323920;
fax:+33534323901.
E-mailaddresses:l.boithias@gmail.com(L.Boithias),sanchez@cict.fr
(J.M.SánchezPérez).
1 Presentaddress:DepartmentofEnvironmentandEnergy,ScienceandResearch Branch,IslamicAzadUniversity,Tehran,Iran.
InEurope,pesticidesareconsideredhazardoussubstancesin accordancewithcurrentdirectivesregardingwater[9,10]. Drink-ing water qualitystandard should not exceed0.1gL−1 foran individualpesticideconcentrationand0.5gL−1 forallpesticide concentration[11].Riverbasinswereadoptedasterritorial man-agementunitsandthescientificcommunitywasaskedtoprovide reliablemodellingtoolstoevaluatepesticidesourcecontributionto waterpollutionandtoquantifypesticideriverloads.Tomodel pes-ticidefateatcatchmentscale,spatiallyvariablelandmanagement andlandscapecharacteristics,temporallyvariableclimatologyand hydrologyaswellasdissipationprocessesintheriverneedtobe takenintoaccount.Therefore,thecombinationofwatershed mod-elsandriverwaterqualitymodelsisneededtocalculatepesticide fluxestotheriverandtransformationprocessesintheriverchannel
[12].
Variousmodelsdescribethepesticidefate,allowinga better understandingof the processesinvolved. Amongthe veryfirst, theChemicalMigrationandRiskAssessment(CMRA)methodology
[13]includedtheAgriculturalRunoffManagement(ARM)[14]and Chemicals,RunoffandErosionfromAgriculturalManagement Sys-tems(CREAMS)[15]models.Itsimulatesthetransportandfateof bothdissolvedandsediment-sorbedcontaminantsandby predict-ingacuteandchronicimpacts,providesriskassessmentonaquatic
biota.Manyone-dimension,riverandcatchmentscalemodels sim-ulatingpesticidefatehavebeenthendeveloped[e.g.16–19].The SoilandWaterAssessmentTool(SWAT,[20])isasemi-distributed modelthatprovideslong-termcontinuouspredictions,including hydrology,plantgrowth,nutrientsandsuspendedsedimentsfrom thefieldtothecatchmentoutletatdailytime-step.Twomain pro-cessesdescribethepesticidetransferinboththesolubleandthe sorbedphases:thepesticideloadgeneratedinthehydrologicalunit andthefateoftheloadintheriver.
Fewworkshavebeenpublishedsofaronpesticidefate mod-ellingusingtheSWATmodel.Moleculesofawiderangeofsolubility weresimulated(e.g.atrazine,metolachlor,trifluralin,diazinonand chlorpyrifos)incatchmentsrangingfrom30to15,000km2[21–24]. Toourknowledge,noworkhasbeenpublishedonpesticide mod-ellinginboththedissolvedandsorbedphasesatflood-eventscale, i.e.duringafewdaysofhighflow.
Thisstudyhadfourobjectives:(i)toassesstheperformanceof theSWATmodelintheSavecatchment(1110km2)intheGascogne region,anagriculturallyintensiveareaofsouth-westernFrance, inpredictingdailypesticideriverloadsandconcentrationsatthe catchmentoutlet;(ii)totest thesensitivity ofSWATlong-term response,intermsofpesticideexportations,tointerannual hydro-logicalconstraintbyusingan11-yearconstantpesticidesupply; (iii)tohindcastearlierpesticidedatainordertomakethemodel reliableforpredictingrivernetworkcontamination(e.g.exceeding drinkingwaterstandards)dependingontheclimaticcontextand possiblefloodevents;(iv)toidentifyfactorscontrolling exporta-tionsandpreferredpathways.
2. Materialandmethods 2.1. Studyarea
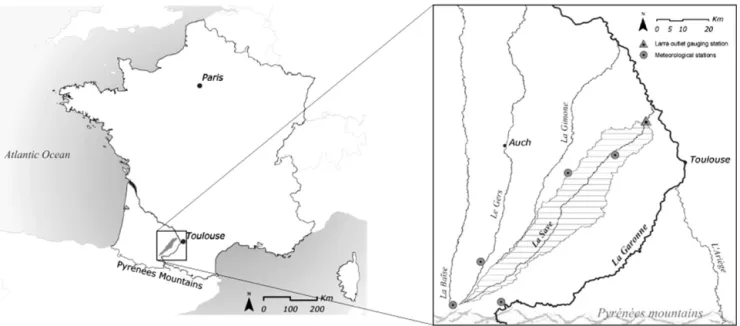
TheRiver Save drainsan areaof 1110km2 which is mostly farmedwithintensiveagriculture.ItislocatedintheCoteauxde Gascogneregion(south-westernFrance)nearToulouse(Fig.1).The RiverSave hasitssourceinthePyreneespiedmont.It joinsthe RiverGaronneaftera140kmcourseata0.4%averageslope. Alti-tudesrangefrom663minthepiedmontto92mattheGaronne confluence.TheLarragaugingstationelevationis114m(Fig.1).
The climate is oceanic. The Save river hydrological regime is mainly pluvial with a maximum discharge in May and low flowsduringthesummer(July–September).Annualprecipitationis 600–900mmandannualevaporationis500–600mm(1998–2008). Thehydrologyiscomplexandsubjecttolargeclimaticvariations: annualaveragerainfallis721mmwitha99mmstandarddeviation. Thecatchmentliesondetritalsediments.Calcicsoilsrepresentover 90%ofthewholecatchmentwithaclaycontentrangingfrom40% to50%.Non-calcicsiltysoilsrepresentlessthan10%ofthesoilin thisarea(50–60%silt)[25].
Becauseofitshighclaycontent,thecatchmentsubstratumis relativelyimpermeable.Riverdischargeisconsequentlysupplied mainlybysurfaceandsubsurfacerunoffandgroundwaterislimited toalluvialandcolluvialphreaticaquifers.Themeaninterannual discharge(1965–2006)fortheRiverSaveis6.1m3s−1.Theannual dischargeof‘dry’yearsis approximately4.1m3s−1 whereas for ‘wet’years itis about8.1m3s−1.Lowwater dischargeis about 1.3m3s−1(datafromtheCompagnied’AménagementdesCoteaux deGascogne(CACG)attheLarragaugingstation).Duringlowflows, riverflowissustainedupstreambytheNestecanal(about1m3s−1). 90%ofthecatchmentareaisusedforagriculture.Theupstream partofthecatchmentisahillyagriculturalareamainlycovered withpasture–a5-yearrotationincludingoneyearofcornand4 yearsofgrazedfescue– andsometimesforest.Thelowerpartis devotedtointensiveagriculturewithmainlya2-yearcroprotation
Table1
Spatialandtemporal3-yearsurveyaveragedmanagementpracticesforsunflower grownontheSavecatchmentincludingmetolachlorandtrifluralinspreading.
Typeofoperation Dateof
operation
Quantity (kgha−1)
Pesticidesspreading:trifluralin 05April 0.874
Fertilizer:15-15-15 05April 193.3
Sowing 10April –
Pesticidesspreading:metolachlor 15April 1.12
Fertilizer:15-15-15 16May 193.3
Harvest 01October –
ofsunflowerand winterwheat.Fertilizersaregenerallyapplied fromlatewintertospring.Averagenitrogenoussupply through-outthecatchmentisapproximately72kgNha−1,i.e.320kgha−1 nitrate-equivalents.About150mmofwaterissuppliedby irriga-tionofcorn.
Variouspesticidesareappliedinthecatchmentthroughoutthe yeardependingonthecrops.Ourstudyfocusesonthemostapplied pesticides: each year, 23tons of metolachlor, a highly soluble chemical(Sw=488mgL−1,logKow=2.9),and18tonsoftrifluralin,
a poorlysoluble chemical (Sw=0.221mgL−1, logKow=4.83),are
appliedonthecatchment.Bothpesticidesareherbicides.Theyare appliedeachyearonsunflowerinearlyApril(Table1).Onaverage, sunflowerfieldscover18.4%ofthecatchment(20,600ha). 2.2. Observeddischargedata
TheRiverSavehasbeenmonitoredfordischargesince1965.At theLarrahydrometricstation,hourlydischarges(Q)wereobtained fromCACG.Thehourlydischargewasplottedbytheratingcurve H(Q)inwhichthewaterlevel(H)wasmeasuredcontinuouslyand thenaveragedforeachday.
2.3. Observedwaterqualitydata
2.3.1. Nitrateandsuspendedsedimentmonitoring
Nitrate loads and suspended sediment concentrations were monitored continuously from January 2007 to March 2009 at theLarra gauging station, both manually and automatically, as describedpreviouslyinOeurngetal.[26–28]:anautomaticwater sampler,connectedtoaprobe,wasprogrammedtoactivate pump-ingwateronthebasisofwaterlevelvariationsrangingfrom10cm (duringlowflows)to30cm(duringhighflows)fortherisingand fallingstages.Grabsamplingwasalsoundertakenneartheprobe positionatweeklyintervals.
2.3.2. Pesticidemonitoring
PesticidesweremonitoredfromMarch2008toMarch2009at theLarrastationwithweeklygrabsamplingduringlowflowand dailygrabsamplingduringfloodevents.Laboratoryanalyseswere performedasdescribedinTaghavietal.[29,30].Additionaldata fromAgencedel’EauAdour-Garonne(AEAG)wereusedfor long-termtotal pesticideconcentrationcomparison (Source:Système d’Informationsurl’EauduBassinAdour-Garonne,dataexportedin 2009).
2.3.3. Loadcalculation
Basedonthehighfrequencyofdatacollection,alinear interpo-lationmethodwasappliedbetweentwoneighbouringsampling pointstoconstructthecontinuousnitrate,suspended sediment andpesticideconcentrationseriesandthuscalculatecontinuous dailyloadsthroughtheproductofconcentrationandwatervolume. Yearlyloadswerecalculatedbytotallingdailyloads.
Fig.1.LocalisationofSavecatchment,Larragaugingstationandmeteorologicalstations.
2.4. Modellingapproach 2.4.1. TheSWATmodel
SWATis a physically basedagro-hydrological model [20]. It operatesatadailytime-stepandwasdesignedtopredicttheimpact of management practices onwater quality in ungauged catch-ments.Itallowstheadditionofflowsbyincludingmeasureddata frompointsources.SWATdiscretisescatchmentsintosub-basins. Sub-basinsarethensubdividedintoHydrologicalResponseUnits (HRUs).HRUsareareasofhomogenouslanduse,soiltypeandslope. HRUsoutputsareinputsfortheconnectedstreamnetwork.One sub-basinisdrainedbyonereach.AuthorsrefertoNeitschetal.
[31]fordetaileddescriptionofthemodel.
2.4.2. ThepesticidecomponentinSWAT
PesticideprocessesinSWATaredividedintothreecomponents: (i)pesticideprocessesinlandareas,(ii)transportofpesticidesfrom landareastothestreamnetwork,and(iii)instreampesticide pro-cesses.
SWATuses algorithms from GLEAMS (Groundwater Loading EffectsonAgriculturalManagementSystems)[16]tomodel pesti-cidemovementandfateinlandareas.Thepartitioningofapesticide between the dissolved and sorbed phases is defined by a soil adsorptioncoefficient.Algorithmsgoverningmovementof solu-bleandsorbedformsofpesticidefromlandareastothestream networkweretakenfromtheEPIC (Erosion-ProductivityImpact Calculator)model [32].The SWATmodelincorporates a simple mass-balancemethod[33]tomodelthetransformationand trans-portof pesticidesin streams. Onlyone pesticidecanberouted throughthestreamnetworkina givensimulation. Thefraction ofpesticideineachphaseisafunctionofthepesticide’spartition coefficientandthereachsegment’ssuspendedsolidconcentration. Degradationisbasedonhalf-life.AuthorsrefertoNeitschetal.[31]
forfurtherdetails.
2.5. SWATdatainputs
Spatialiseddatausedinthisstudywere:
- DigitalElevationModel witha resolutionof25m×25mfrom InstitutGéographiqueNational(IGN)France(BDTOPOR).
-Soildataonthescaleof1:80,000fromCACGanddigitisedby CemagrefdeBordeaux[34]andsoilpropertiesfortheSWATsoil database[35].
-Landusedata[34]fromLandsat2005withassociated manage-mentpractices:spatialandtemporalaverageofplanting/seedling dates,amounts,typeanddateoffertilisation,pesticide applica-tionandirrigation,grazing,tillageandharvestoperationsdates from a 3 year survey (2003–2005) with catchment farmers, appliedforeachyearofsimulation.
-Meteorologicaldatafrom5stations(Fig.1)withdaily precipita-tionfromMétéo-France.Missingdataweregeneratedbylinear regression equationfromdata fromthenearest stations with completemeasurements.Twostationsintheupstreamsection hadacompletesetofmeasurementsofdailyminimumand max-imumairtemperature,windspeed,solarradiationandrelative humiditythatwereusedtosimulatethereference evapotranspi-rationinthemodelbyPenman–Monteith[36,37]method. -Pointsourcedata:theSaverivernetworkisconnectedupstream
totheNestecanal.DailydischargewasgivenbyCACG.Sinceitis waterfromamountainousagriculturalextensivearea, concen-trationsofnitrateandpesticidesweresetconstantandequalto2 and0mgL−1respectively.Sincewaterisderivedbyadamwhere sedimentsaretrapped,suspendedsedimentconcentrationwas setconstantandequalto10mgL−1.
Inthisstudy,version2009.93.3ofArcSWATwasused.The catch-mentwasdiscretisedinto73sub-basinswithaminimalareaof 500ha.1642HRUsweregeneratedintegrating8landusesclasses, 23soilclassesand5slopeclasses(%:0–1,1–3,3–5,5–8and8and over).
WholesimulationwascarriedoutdailyfromJanuary1998to March 2009(excluding 4 years’ warm-upfrom 1994 to1997). Thesensitivityof15parametersgoverningdischarge,nitrateand suspendedsedimentdynamicwastestedusingtheArcSWAT2009 sensitivityanalysistool[38].Calibrationofdischarge,nitrate, sus-pendedsedimentandpesticideatdailytime-stepwasperformed manually.PesticideinputvaluesaregiveninTable2.
2.6. Modelevaluation
The performance of the model was evaluated using the Nash–Sutcliffeefficiency (ENS)index [39] and thecoefficientof
Table2
Manuallycalibratedvaluesofpesticidesparameters:half-lifes,KocandCHPSTKOC anddegradationratesinthechannelwaterandinthesedimentbed(respectively CHPSTREAandSEDPSTREA).
Parameters Inputfile Metolachlor Aclonifen
Soilhalf-lifeMet/Tri(days) pest.dat 90 60
KocMet/Tri(mgkg−1/mgL−1) pest.dat 667 13,196
CHPSTKOCMet/Tri(m3g−1) .swq 0.1 2.6
CHPST/SEDPSTREA(days−1) .swq 0.025 0.025
determination(R2).E
NSrangesfromnegativeinfinityto1whereas
R2rangesbetween0and1.WerefertoKrauseetal.[40]forfurther
discussionontheseevaluationcriteria.
DailyENSandR2wereappliedondailydischargeforlowflows (belowthe 6.1m3s−1 mean annual discharge), high flow (over 6.1m3s−1)andtotal(1998–2006 forcalibrationand2007–2009 forvalidation).Theywerealsocalculatedfornitrateloadsand sus-pendedsedimentconcentrationsforthe2007–2009period.Daily andmonthlyR2werecalculatedfordissolved,sorbedandtotal pes-ticidesconcentrationsforcalibrationperiod(2008–2009).Dueto datalimitation,ENSwasnotcalculatedonpesticideconcentration. InthisstudywedeemedENSsatisfactorywhenhigherthan0.36
[41]andR2satisfactorywhenhigherthan0.5[42]. 2.7. Waterqualitysimulation
2.7.1. Discharge,nitrateandsuspendedsedimentsimulation DailySWATinterpolatedrainfallandsimulatedwateryield(i.e. theamountofwaterflowingdowntheoutlet)weretotalledfor eachyear.Dailysimulatednitrateandsuspendedsedimentloads attheLarraoutletweretotalledforeach yearandforlow flow andhighflow(usingthe6.1m3s−1threshold).Incomingsuspended sedimentinagivenreachisthetotaloftheamountofsuspended sedimentscomingfromtheHRUsrelatedtothereach,addedtothe amountenteringfromtheupstreamreach.
2.7.2. Pesticidesimulation
Dailypesticideloadsweretotalledforeachyear,forAprilflood (11/04/08–30/04/08)andJuneflood(14/05/08–18/06/08),andfor lowflowandhighflow(usingthe6.1m3s−1threshold).Total pesti-cideconcentrationistheconcentrationofpesticideasmeasuredin unfilteredwater.Simulatedtotalconcentrationiscalculatedasthe totalofdissolvedandsorbedpesticideconcentration.The particu-latefractionisthefractionofpesticideinthesorbedphaseandis calculatedasthesorbedpesticideloaddividedbythetotalpesticide load.Theexportationrateiscalculatedastheratiofrompesticide loadexportedatoutletandtheamountofpesticideappliedonthe catchment.Aspesticidetoxicityismorerelevantasconcentration thanas load,long-termsimulation concentrations (1998–2009) werecomparedtoEuropeandrinkingwaterqualitystandardsof 0.1gL−1forasinglepesticideandof0.5gL−1forbothpesticides beingmodelled.
Correlation analyses were performed on 1998–2008 interannual-averaged metolachlor and trifluralin (both dis-solvedandsorbed)loadsfromreachandHRUstorelatethemto reachandHRUsvariablessuchasslope,soilclasses,rainfall,water, suspendedsedimentandnitrateyields.
3. Results
3.1. Discharge,nitrateandsuspendedsedimentsimulation
According to sensitivity analysis, parameters gov-erning discharge and nitrate were mostly parameters governing runoff and groundwater transfer (CN2, RCHRG DP, GWQMN). Parameters governing suspended sediment were
Table3
Goodness-of-fitindicesfordailydischarge,nitrateloadandsuspendedsediment simulation(p<0.05). Periods R2 E NS Discharge–calibration 1998–2006 0.52 0.50 Discharge– validation 2007–2009 0.58 0.56 Lowflow 1998–2009 0.02 0.02 Highflow 1998–2009 0.51 0.54 Nitrateload 2007–2009 0.46 0.37
Suspendedsedimentsconcentration 2007–2009 0.36 0.27
mostlyparametersgoverningrunoff(CN2)andin-streamprocesses (CHN2,SPCON,SPEXP).
Fig.2focusesondischargesimulateddailyfromJanuary2007to March2009.Thegoodness-of-fitindicesfordailydischargewere satisfactoryduringbothcalibrationandvalidationperiod(Table3). Theywerealsosatisfactoryforhighflowbutunsatisfactoryforlow flow(Table3).
Nitrate daily load predictions (Fig. 3(a)) were correlated to observationsfor the2007–2009period(Table3).Observedand simulated cumulated nitrate loads in 2007 were 2514 and 2388tons respectively, they were 3047 and 3018 tons respec-tively in 2008(Fig.3(b) and (c)).Considering daily and annual loadspredictionon2007–2009,themodelwasconsideredto hind-castpastdailyandannualnitrateloadsbackto1998withlittle error.Annualnitrateloadswerecorrelatedtoannualwateryield (R2=0.84,p<0.05).
Daily simulated suspended sediment concentrations fitted observations(Fig.4(a))althoughENSand R2 wereunsatisfactory (Table 3). Observedand simulated annualsuspended sediment loadswere9000and15,000tonsrespectivelyin2007and58,000 and64,000tonsrespectivelyin2008(Fig.4(b)and(c)).Considering concentrationandloadpredictionon2007–2009,themodelwas consideredtoreconstructpastannualloadsbackto1998withlittle error.Annualsuspendedsedimentloadswerecorrelatedtoannual wateryield(R2=0.59,p<0.05).Onaverageacrossthe73reaches, theannualratioofdeposited/incomingsuspendedsedimentinthe reachisof54%.
3.2. Pesticidesimulation
Simulationresultswereshowntobepoorlysensitiveto applica-tiondatechangeforbothmolecules(resultsnotshown)although pesticidelossesareknowntobedeterminedmainlybytheperiod oftimebetweenapplicationandthefirstrainfalleventandbythe applicationdose[43,44].SWATpesticidecomponentparameters, includingthesoiladsorptioncoefficient(Koc),werealsopoorly sen-sitive(resultsnotshown)exceptthechannelpartitioncoefficient betweenwaterandsuspendedsediment(CHPSTKOC).
3.2.1. SWATperformances
Therangeofdailysimulatedconcentrationsofmetolachlorand trifluralinfollowedtherangeofrespectivemeasurementsduring boththecalibration2008–2009period(Fig.5)andthelong-term validation1998–2009period(Fig.6).Duringthecalibrationperiod, simulateddissolvedandsorbedmoleculeconcentrationsduring low flow matched respectiveobservations. Floodconcentration peaks of dissolved metolachlor were predicted although over-estimated duringApril and June flood events. Sorbed pesticide concentrationpeaksduringthesameperiodwereunderestimated. TrifluralinconcentrationpeaksinMaywereskipped.Themodel didnotsimulatethetrifluralinconcentrationpeakinearly2009. Simulatedpartitionbetweensoluble andsorbedphasesof both moleculesroughlyfollowedtheobservedpartition.
Intermsofloads,averagesimulatedannualloadsatoutletwere in therangeof observed annualloads (Table 4).Thesimulated
Fig.2. Observedandsimulateddailydischarge(m3s−1)attheLarragaugingstation(January2007–March2009).
Fig.3.Observedandsimulateddaily(a)nitrateload(tons)attheLarragaugingstation(January2007–March2009),(b)2007accumulation(tons)and(c)2008accumulation (tons).
metolachlorandtrifluralinparticulatefractionsatcatchment out-letfittedtheobservedparticulatefractionsand wereconsistent withthefractions simulated in surface runoff out ofthe HRUs (Table4).Atfloodscale,simulationfollowedthemeasuredrangeof
values(Table5).However,metolachlorloadswereunderestimated whereastrifluralinloadswereoverestimatedduringtheAprilflood and underestimatedduringtheJuneflood. R2 for monthly con-centrationsofmetolachlorandtrifluralinwereover0.38except
Fig.4. Observedandsimulateddaily(a)suspendedsedimentconcentration(mgL−1)attheLarragaugingstation(January2007–March2009),(b)2007accumulation(tons) and(c)2008accumulation(tons).
Fig.5.Observedandsimulateddailypesticideconcentrations(gL−1)attheLarragaugingstation(2008–2009):(a)metolachlorand(b)trifluralin.
Table4
Observed(2008–2009)andsimulated(1998–2008)averageannualloadsofmetolachlorandtrifluralinineachcatchmentcompartment(mgha−1yr−1)andparticulate fractionoutofHRUsandatcatchmentoutlet.
Metolachlor(mgha−1yr−1) Trifluralin(mgha−1yr−1)
Observed Simulated Observed Simulated
HRUs Runoff Dissolved:1653 Sorbed:317 Dissolved:475 Sorbed:1237 Partition:0.16 Partition:0.72
Lateralflow Dissolved:200 Dissolved:10
Outlet
Flowwater Dissolved:204 Dissolved:135 Dissolved:60 Dissolved:2
Sorbed:27 Sorbed:14 Sorbed:195 Sorbed:5
Partition:0.12 Partition:0.09 Partition:0.77 Partition:0.72
Table5
Totalanddissolvedmetolachlorandtrifluralinloads(g)duringAprilandJune2008floodsatLarraoutlet.
Metolachlor Trifluralin
2008floods April(11/04–30/04) June(14/05–18/06) April(11/04–30/04) June(14/05–18/06)
Measuredtotalload(g) 5015 16,692 66 3285
Simulatedtotalload(g) 3588 11,283 92 422
Measureddissolvedload(g) 4591 16,178 13 186
Simulateddissolvedload(g) 3262 10,257 26 117
Table6
DailyandmonthlyR2formetolachlorandtrifluralinconcentration(dissolved,sorbedandtotal)atLarraoutlet(2008–2009).
Metolachlor Trifluralin
Daily Monthly Daily Monthly
Dissolved 0.25 0.43 0.21 0.60
Sorbed 0.01 0.38 0.01 0.15
Fig.6.Observedandsimulateddailypesticidetotalconcentrations(gL−1)attheLarragaugingstation(1998–2009):(a)metolachlorand(b)trifluralin.
forsorbedandtotaltrifluralin.R2fordailyconcentrationsdidnot
exceed0.26(Table6).
3.2.2. Long-termpesticideexportationbalancesatoutlet
During the 1998–2008 period, high flows represented 17% ofthetime consideringthe6.1m3s−1 threshold. 50%of nitrate loadand57%ofsuspendedsedimentloadwereexportedduring highflow. Annualpesticideloads areshownin Fig.7.Thetotal metolachlorloadvariedbetween0.1kgyr−1(2003)and80kgyr−1 (2000), whereas trifluralin varied between 0.01kgyr−1 (2003) and2.3kgyr−1 (2000).Averagetotal metolachlorand trifluralin annualloadswere16.7kg(SD=23kg)and0.8kg(SD=1kg) respec-tively.Thetotalmetolachlorandtrifluralinexportedwerearound 0.072%and0.005%oftheappliedamountrespectively (exporta-tionratewas1%outoftheHRUs forbothmolecules).Atoutlet 61%ofthetotalmetolachlorand52%ofthetotaltrifluralinwere exportedduringhighflows(Table7).Outofthe4108simulated days(1998–2009),metolachloratLarraoutletexceededthe Euro-peanstandardthresholdof0.1gL−1for149daysandtrifluralin exceededthis same threshold for 17 days(3.6 and 0.4% ofthe time period respectively). Maximummetolachlor concentration was5.4mgL−1,predictedinJuly2001whereasmaximum triflu-ralinconcentrationwas0.2mgL−1,predictedinApril1998(Fig.6). Consideringthesumoftotalmetolachlorandtotaltrifluralin con-centrations,thethresholdof0.5gL−1 wasexceededduring24 daysatcatchmentoutlet.
3.2.3. Pesticidetransfercontrollingfactors
Atcatchmentscale,thesimulatedpreferredpathwayof pesti-cidetransferwassurfacerunoff(Table4)withassociatednitrate andsuspendedsedimentexportations.Atsub-basinscale, triflu-ralin and metolachlor in the sorbed phase were correlated to suspendedsedimentloads(R2=0.69and0.64,respectively). Triflu-ralinandmetolachlorinthedissolvedphasewerepoorlycorrelated tonitrateloads(R2=0.21and0.16,respectively).Eventually, triflu-ralinandmetolachlorinthedissolvedphasewerebettercorrelated tosuspendedsedimentloads(R2=0.33and0.67respectively).At HRUscale,thecorrelationanalysisdidnotshowanycorrelation betweensuspended sediment loads,metolachlor and trifluralin loadsinthedissolvedphaseandcatchmentvariables.Metolachlor andtrifluralinloadsinthesorbedphasecorrelatedweaklyto sus-pendedsedimentyields(R2=0.24and0.43respectively).
4. Discussion
4.1. Discharge,nitrateandsuspendedsedimentsimulation
OverallENSandR2fordailydischargewereoverthesatisfactory threshold.However,gapsbetweenobservedandsimulatedvalues areexplainedbyerrorsinobservedandsimulatedvalues.Errors inobservedvaluescanstemfromtheprecisionofthesensorand fromtheuseofaratingcurve.Errorsinsimulatedvaluescanbe attributedto(i)actuallocalrainfallstormsthatwerenotwell rep-resentedbytheSWATrainfalldatainterpolationand(ii)theflow
Fig.7. Simulatedannualdissolvedandsorbedpesticideloads(kgyr−1)atLarraoutlet(1998–2008):(a)metolachlorand(b)trifluralin.
uncertaintyinthedensenetworkofcanalsdivertedfromtheriver networktobringpartofriverflowtomanywatermills.ENSforlow flowwasbelowthesatisfactorythreshold.LowENSduringlowflow hastoberelatedtoitsgenerallypoorperformanceinperiodsoflow flow:withonlyminorsimulationerrorsthedenominatorofthe equationtendstowardszeroandENSapproachesnegative infin-ity.LowENS ishoweverofminorconcernsincepesticideswere showntobemostlyexportedduringfloods.Saveriverdischarge simulationqualityishowevercomparabletoOeurngetal.[45].
Dailynitratepredictionisrelatedtodailydischargeprediction, asitisaverysolublenutrient.Biasisthereforelinkedtothe inac-curacyofdischargepredictionsmentionedabove.Uncertaintyin point-sourcenutrientinputalsoexplainsbias.Inaddition, aver-agedlanduseandassociatedmanagementpracticeinputsmaynot reflectwellenoughtheactualandlocallanduseandmanagement practices.Theyalsocanevolveoverthemodelledperioddepending onagriculturalpolicytrends.
ENSandR2 fordailysuspendedsedimentsconcentrationwere belowthesatisfactorythreshold.Calibrationofsedimentis diffi-cultintheSavecatchmentconsideringthedensenetworkofcanals divertedfromtherivernetwork.Thesuccessionofdamsandgates trapssedimentstilltheirrandomemptyingbacktorivernetwork. Uncertaintyinpoint-sourcesuspendedsedimentsinputmayalso
explainbias.Suspendedsedimentresultswerehoweverconsistent withOeurngetal.[45].
4.2. Pesticidesimulation 4.2.1. SWATperformances
R2ofdailypesticideconcentrationwasbelowthesatisfactory threshold.AshighlightedbyLuoetal.[24]possibletimeshiftsin theprecipitation,agriculturalactivity,andmeasurementsforflow andwaterqualitydatarenderdailypesticidestatisticspoor.Errors inpesticideconcentrationandloadpredictionsmayberelatedto(i) aninadequatecalibrationoftheparametersgoverningflowand sol-uble(e.g.nitrate)andparticulate(e.g.suspendedsediment)phases transportandto(ii)aninadequatecalibrationofpesticide compo-nentparameters.
Sorbedpesticideunderestimationhastoberelatedtothehigh depositionrateof suspended sediment in thechannel. Also, as Kocwas showntobe poorlysensitiveand asCHPSTKOC isset asaconstantvalue,bothpartitioncoefficientsmodelledinHRUs andinreachesvarydependingonsuspendedsediment concen-tration.Theymaynotreflectactualvariations: metolachlorand trifluralin measurementsat outlet showvarious inversions(i.e. [soluble]<[sorbed]formetolachlorand[soluble]>[sorbed]for
tri-Table7
Averagemetolachlorandtrifluralindailyloads(gd−1)duringhighflowandlowflowindissolvedandsorbedphasesandpercentageofpesticideloadexportedduringhigh flowatLarraoutlet(1998–2008).
Dissolved Sorbed
Lowflow(gd−1) Highflow(gd−1) Floodlosses(%) Lowflow(gd−1) Highflow(gd−1) Floodlosses(%)
Metolachlor 19 137,118 61 2 13,712 61
fluralin)ofthepartitioncoefficientKd,asdefinedbyTaghavietal.
[30]atcatchmentoutlet,thatwerenotmodelled.
Regarding agricultural activity, i.e. land use and associated managementpractices,themodeldidnotsimulateanytrifluralin concentrationriseinearly2009.Thelanduseinputmapwasbased ona2005landcoversatelliteimagethatmaynotreflectlong-term actualoperations: e.g.canola,representing1%ofthecatchment landusein2005,hasbeengrownincreasinglyoverthepastfive yearsinthenorthernpartofthecatchment.Upto2009,canola wasmanagedwithanaveragespreadof1kgha−1oftrifluralinin August.ThiswasnottakenintoaccountinthemodelbecauseSWAT landuseapproximationwassettoskiplanduserepresentingless than10%ofthesub-basinarea.Reliablepesticidesupplyinputdata arethereforeanecessaryconditiontoachievesatisfactory simula-tionoutputs.
Alastsourceoferroristhemodelledtransferpathways:SWAT simulatespesticidetransfersthroughsurfacerunoffand subsur-facelateralflowbutnotthroughgroundwaterflow,drainflownor atmosphericdeposition[31].Thismayleadtoadditionalerrorsin solublepesticidesimulationalthoughleachingofpesticidesinto deep groundwater and a possible inputof pesticides into sur-facewatersbyoutflowinggroundwaterisknowntobenegligible
[46,47].Inaddition,nopoint-source,suchasthecleaningofthe equipment,wasmodelledinthisstudy[12,48].
Finally,dailypesticidetotalconcentrationsR2wereinthelower rangeofthevaluesmentionedbyNeitschetal.[21].Theyreported R2 rangingfrom0.41to0.28fordailymetolachlortotal concen-trationandR2rangingfrom0.51to0.02fordailytrifluralintotal concentration.
4.2.2. Long-termpesticideexportationbalanceatoutlet
Simulationshowedthatpesticideswereexportedmainlyduring floodevents.Roleoffloodsinpesticideexportationwaspreviously shownattheSavecatchmentoutlet[29].Asinterannualaverage, exportationratesofbothpesticideshavetoberelatedtotheir appli-cationtime(April)andthemonthofmaximumdischarge(May). However,simulatedvalues ofexportationduringa similarhigh flowperiodwerelessthanmeasuredvaluesinasmallcatchment oratfieldscale[49,50].Thesizeofthedrainedarea,butalsothe soilandthelandusemaymodulatetheexportation.
Pesticideexportationsfromlandtooutlet werelessthan1% ofappliedamount.Suchavaluewasreportedbyvariousstudies onmetolachlorinFrance,SwitzerlandandQuébec[51–53]andon otherpesticides[50,53,54].About93%and99%ofmetolachlorand trifluralinrespectivelyenteringthestreamnetworkdoesnotreach theoutlet,suggestinghighdeposition(discussedabove)and degra-dationinstreamwater.Thelatterwouldbeconsistentwiththe carbonconsumptionbyriverbiotashownbySánchez-Pérezetal.
[55]onasimilarcatchmentofGascogne.
Trifluralin concentration exceeded the 0.1gL−1 maximum permissiblelevellessthanmetolachlorconcentration.Inthemodel, trifluralinwaslessappliedthanmetolachloramongthecatchment, itssoilhalf-lifewas60days(insteadof90daysformetolachlor)and itstransportwasmorelikelydependingonlandandriverbed ero-sion.ItisworthnotingthattheEuropeanstandardof0.5mgL−1 wasexceededbyapoolofonlytwomoleculesduring0.6%ofthe simulationtime.
4.2.3. Pesticidetransfercontrollingfactors
Runoffwasshowntobethepreferredsimulatedpathwayfor pesticideexportation.Luoetal.[24,56]alreadyreportedthe con-trolofrunoffonpesticidetransfersimulation.Intheenvironment, pesticidesmaybesorbedontomineralsuspendedmatter, Partic-ulateOrganicCarbon(POC)andcomplexedbyDissolvedOrganic Carbon(DOC)[29].Bettercorrelationwasfoundbetweendissolved phasesandsuspendedsedimentthanbetweendissolvedphases
andnitrate.Althoughpesticidetransferthroughgroundwateris notyetmodelledinSWAT,contrarilytonitrate,therelationships highlightedacontrolofbothsurfaceandsub-surfacerunoffs dur-ingfloodsondissolvedphaseexportation.Thisisconsistentwith thepesticides’actualabilitytosorbontoDOC,i.e.smallerthanthe 0.45mmeshfilter,anditstransferthroughsub-surfaceflow[29]. 5. Conclusions
TheSWATmodelwasappliedtosimulatepesticidetransferat theoutletofalargeintensiveagriculturalcatchment.Simulation resultsweredeemedtobesatisfactory,takingintoaccountthat themodelledtransferprocessesweresimplifiedanddonot repre-sentallactualtransfers.FurtherimprovementsoftheSWATmodel maybeinvestigated.Thetransferofpesticideinthedissolvedphase fromlandtoriverthroughgroundwatercouldbetestedtoassess possible water-tableeffect. Also, investigating the variationsof thepartitioncoefficientbetweenobserveddissolvedandsorbed phasesduringfloodsinvariouspointsintheriver(areasofrapid, deep,etc.)wouldhelptoassesstheaccuracyoftheSWATmodelled partitionatflood-eventscale.
However,extrapolationtootherchemicalsisconceivableand SWATwasshowntobepromisingforprovidingarobustdecision toolforwaterqualitymanagers.Floodsarequickevents.Suchatool wouldhelp(i)totarget‘whatandwhen’tomonitor,(ii)tohighlight pesticideconcentrationpeakswithoutcost-intensivefield mea-surementsandpredictfuturepeaksand(iii)toevaluateexported loadsascontaminationindicator.Suggestionoflocalised mitiga-tionpracticestoreachwaterpolicyobjectivessuchastheEuropean WaterFrameworkDirectiveismadepossible.
Acknowledgements
ThisworkwasperformedaspartoftheEUInterregSUDOEIVB program(SOE1/P2/F146AguaFlashproject, http://www.aguaflash-sudoe.eu)andfundedbyERDFandtheMidi-PyrénéesRegion.
WesincerelythanktheCACGfordischargedata,Météo-France formeteorologicaldata,AEAGforlong-termpesticide concentra-tion measurements,Arnaud Mansat and Erwan Motte for their data-processingexpertise,andHuguesAlexandreforITsupport. References
[1] C.Soulsby,A.F.Youngson,H.J.Moir,I.A.Malcolm,Finesedimentinfluenceon salmonidspawninghabitatinalowlandagriculturalstream:apreliminary assessment,Sci.TotalEnviron.265(2001)295–307.
[2]G.Zalidis,S.Stamatiadis,V.Takavakoglou,K.Eskridge,N.Misopolinos,Impacts ofagriculturalpracticesonsoilandwaterqualityintheMediterraneanregion andproposedassessmentmethodology,Agric.Ecosyst.Environ.88(2002) 137–146.
[3]M.Probst,N.Berenzen,A.Lentzen-Godding,R.Schulz,M.Liess,Linkinglanduse variablesandinvertebratetaxonrichnessinsmallandmedium-sized agricul-turalstreamsonalandscapelevel,Ecotoxicol.Environ.Safe.60(2005)140–146. [4]M.Zeiger,N.Fohrer,Impactoforganicfarmingsystemsonrunoffformation processes—along-termsequentialrainfallexperiment,SoilTillageRes.102 (2009)45–54.
[5]J.G.M.Cuppen,P.J.VandenBrink,E.Camps,K.F.Uil,T.Brock,Impactofthe fungicidecarbendaziminfreshwatermicrocosms.I.Waterquality,breakdown ofparticulateorganicmatterandresponsesofmacroinvertebrates,Aquat. Tox-icol.48(2000)233–250.
[6]P.J.VandenBrink,J.Hattink,F.Bransen,E.VanDonk,T.Brock,Impactof thefungicidecarbendaziminfreshwatermicrocosms.II.Zooplankton,primary producersandfinalconclusions,Aquat.Toxicol.48(2000)251–264. [7]R.M.Niemi,I.Heiskanen,J.H.Ahtiainen,A.Rahkonen,K.Mäntykoski,L.Welling,
etal.,Microbialtoxicityandimpactsonsoilenzymeactivitiesofpesticidesused inpotatocultivation,Appl.SoilEcol.41(2009)293–304.
[8]A.G.Becker,B.S.Moraes,C.C.Menezes,V.L.Loro,D.R.Santos,J.M.Reichert,etal., Pesticidecontaminationofwateraltersthemetabolismofjuvenile silvercat-fish,Rhamdiaquelen,Ecotoxicol.Environ.Safe.72(2009)1734–1739. [9] EC,Directive2006/11/ECoftheEuropeanParliamentandoftheCouncilof15
February2006onpollutioncausedbycertaindangeroussubstancesdischarged intotheaquaticenvironmentoftheCommunity,2006.
[10]EC,Directive2000/60/ECoftheEuropeanParliamentandoftheCouncilof23 October2000establishingaframeworkforCommunityactioninthefieldof waterpolicy,2000.
[11]EC,Directive98/83/ECof3November1998onthequalityofwaterintended forhumanconsumption,1998.
[12]K.Holvoet,P.Seuntjens,P.A.Vanrolleghem,Monitoringandmodeling pesti-cidefateinsurfacewatersatthecatchmentscale,Ecol.Model.209(2007) 53–64.
[13]Y.Onishi,A.R.Olsen,M.A.Parkhurst,G.Whelan,Computer-based environ-mentalexposureandriskassessmentmethodologyforhazardousmaterials, J.Hazard.Mater.10(1985)389–417.
[14] A.S.Donigian,N.H.Crawford,ModelingPesticidesandNutrientsonAgricultural Lands,EnvironmentalProtectionAgency,Washington,DC,1976.
[15] W.G.Knisel,CREAMS:AField-scaleModelforChemicals,RunoffandErosion fromAgriculturalManagementSystems,Report,U.S.Departmentof Agricul-ture,Washington,DC,1980.
[16]R.A.Leonard,W.G.Knisel,D.A.Still,GLEAMS:GroundwaterLoadingEffectsof AgriculturalManagementSystems,Trans.ASAE30(1987)1403–1918. [17]L.C.Brown,T.O.Barnwell,TheEnhancedWaterQualityModelsQUAL2Eand
QUAL2E-UNCAS:DocumentationandUserManual,1987.
[18] C.D.Brown,J.M.Hollis,SWAT—asemi-empiricalmodeltopredict concentra-tionsofpesticidesenteringsurfacewatersfromagriculturalland,Pestic.Sci. (1996)41–50.
[19]R.Haverkamp,POWERanewapproachofwatershedmodelling,in:Conference InvitedbyGriffinUniversity,Brisbane,Australia,6–12February,2002. [20]J.G.Arnold,R.Srinivasan,R.S.Muttiah,J.R.Williams,Largeareahydrologic
mod-elingandassessment.I.Modeldevelopment,J.Am.WaterResour.Assoc.34 (1998)73–89.
[21]S.L.Neitsch,J.G.Arnold,R.Srinivasan,PesticidesFateandTransportPredicted bytheSoilandWaterAssessmentTool(SWAT)—Atrazine,Metolachlorand TrifluralinintheSugarCreekWatershed,2002.
[22] K.Holvoet,A.vanGriensven,P.Seuntjens,P.A.Vanrolleghem,Sensitivity anal-ysisforhydrologyandpesticidesupplytowardstheriverinSWAT,Phys.Chem. Earth30(2005)518–526.
[23]M.Larose,G.C.Heathman,L.D.Norton,B.Engel,Hydrologicandatrazine sim-ulationoftheCedarCreekwatershedusingtheSWATmodel,J.Environ.Qual. 36(2007)521–531.
[24]Y.Luo,X.Zhang,X.Liu,D.Ficklin,M.Zhang,Dynamicmodelingof organophos-phatepesticideloadinsurfacewaterinthenorthernSan JoaquinValley watershedofCalifornia,Environ.Pollut.156(2008)1171–1181.
[25]J.C.Revel,M.Guiresse,Erosionduetocultivationofcalcareousclaysoilsonthe hillsidesofSouthwestFrance.I.Effectofformerfarmingpractices,SoilTillage Res.35(1995)147–155.
[26] C.Oeurng,S.Sauvage,J.M.Sánchez-Pérez,Dynamicsofsuspendedsediment transportandyieldinalargeagriculturalcatchment,south-westFrance,Earth Surf.Process.Landforms35(2010)1289–1301.
[27]C. Oeurng,S.Sauvage,J.M.Sánchez-Pérez,Temporalvariabilityofnitrate transportthroughhydrologicalresponseduringfloodeventswithinalarge agriculturalcatchmentinsouth-westFrance,Sci.TotalEnviron.409(2010) 140–149.
[28]C.Oeurng,S.Sauvage,A.Coynel,E.Maneux,H.Etcheber,J.-M.Sánchez-Pérez, Fluvialtransportofsuspendedsedimentandorganiccarbonduring flood eventsinalargeagriculturalcatchmentinsouthwestFrance,Hydrol.Process. 25(2011)2365–2378.
[29]L.Taghavi,G.Merlina,J.-L.Probst,Theroleofstormflowsinconcentration ofpesticidesassociatedwithparticulateanddissolvedfractionsasathreat toaquaticecosystems.Casestudy:theagriculturalwatershedofSaveriver (SouthwestofFrance),Knowl.Manage.Aquat.Ecosyst.400(2011)11. [30]L.Taghavi,J.L.Probst,G.Merlina,A.L.Marchand,G.Durbe,A.Probst,Flood
eventimpactonpesticidetransferinasmallagriculturalcatchment (Mon-tousseatAurade,southwestFrance),Int.J.Environ.Anal.Chem.90(2010) 390–405.
[31]S.L.Neitsch,J.G.Arnold,J.R.Kiniry,J.R.Williams,SoilandWaterAssessment ToolTheoreticalDocumentation—Version2005,2005.
[32]J.R.Williams,A.D.Nicks,J.G.Arnold,Simulatorforwaterresourcesinrural basins,J.Hydraul.Eng.111(1985)970–986.
[33]S.C.Chapra,SurfaceWater-QualityModeling,McGrawHill,Boston,USA,1997.
[34]F. Macary,E.Lavie,G.Lucas,O.Riglos,Méthodedechangementd’échelle pourl’estimationdupotentieldecontaminationdeseauxdesurfaceparl’azote, Ingénieries-EAT46(2006)35–49.
[35]J.M.Lescot,P.Bordenave,Adecisionsupporttochoosebetweenchangesof agriculturalpractices:aspatiallydistributedcost-effectivenessassessment framework,in:IntegratedAssessmentofAgricultureandSustainable Develop-ment,SettingtheAgendaforScienceandPolicy,EgmondaanZee,NLD,2009, pp.452–453.
[36]H.L.Penman,Naturalevaporationfromopenwater,baresoil,andgrass,Proc. Roy.Soc.Lond.A193(1948)120–146.
[37]J.L.Monteith,Evaporationandenvironment,in:TheStateandMovementof WaterinLivingOrganisms,CambridgeUniversityPress,Swansea,1965,pp. 205–234.
[38] A.VanGriensven,T.Meixner,S.Grunwald,T.Bishop,M.Diluzio,R.Srinivasan,A globalsensitivityanalysistoolfortheparametersofmulti-variablecatchment models,J.Hydrol.324(2006)10–23.
[39]J.E.Nash,V.Sutcliffe,Riverflowforecastingthroughconceptualmodels.PartI. Adiscussionofprinciples,J.Hydrol.10(1970)282–290.
[40]P.Krause,D.P.Boyle,F.Bäse,Comparisonofdifferentefficiencycriteriafor hydrologicalmodelassessment,Adv.Geosci.5(2005)89–97.
[41] M.W.VanLiew,J.Garbrecht,HydrologicsimulationofthelittleWashitariver experimentalwatershedusingSWAT,J.Am.WaterResour.Assoc.39(2003) 413–426.
[42]C.H.Green,M.D.Tomer,M.DiLuzio,J.G.Arnold,Hydrologicevaluationofthe soilandwaterassessmenttoolforalargetile-drainedwatershedinIowa,Trans. ASABE49(2006)413–422.
[43]J.S.Martins,L.B.Owens,Atrazine,deethylatrazine,anddeisopropylatrazinein surfacerunoffformconservationtilledwatersheds,Environ.Sci.Technol.37 (2003)944–950.
[44]K.Müller,M.Deurer,H.Hartmann,M.Bach,M.Spiteller,H.G.Frede, Hydrologi-calcharacterisationofpesticideloadsusinghydrographseparationatdifferent scalesinaGermancatchment,J.Hydrol.272(2003)1–17.
[45]C.Oeurng,S.Sauvage,J.M.Sanchez-Perez,Assessmentofhydrology,sediment andparticulateorganiccarbonyieldinalargeagriculturalcatchmentusingthe SWATmodel,J.Hydrol.401(2011)145–153.
[46] B.Röpke,M.Bach,H.G.Frede,DRIPS—aDSSforestimatingtheinputquantityof pesticidesforGermanriverbasins,Environ.Model.Soft.19(2004)1021–1028. [47]R.P. Richards,D.B.Baker, Pesticide concentrationpatterns in agricultural drainagenetworksintheLakeErieBasin,Environ.Toxicol.Chem.12(1993) 13–26.
[48]S.Reichenberger,M.Bach,A.Skitschak,H.G.Frede,Mitigationstrategiesto reducepesticideinputsintoground-andsurfacewaterandtheireffectiveness: areview,Sci.TotalEnviron.384(2007)1–35.
[49] X.Louchart,M.Voltz,P.Andrieux,R.Moussa,Herbicidetransporttosurface watersatfieldandwatershedscalesinaMediterraneanvineyardarea,J. Envi-ron.Qual.30(2001)982–991.
[50]M.Rabiet,C.Margoum,V.Gouy,N.Carluer,M.Coquery,Assessingpesticide concentrationsandfluxesinthestreamofasmallvineyardcatchment—effect ofsamplingfrequency,Environ.Pollut.158(2010)737–748.
[51]S.M.Novak,J.M.Portal,M.Schiavon,Effectsofsoiltypeuponmetolachlorlosses insubsurfacedrainage,Chemosphere42(2001)235–244.
[52] C.Leu,H.Singer,C.Stamm,S.R.Muller,R.P.Schwarzenbach,Variabilityof her-bicidelossesfrom13fieldstosurfacewaterwithinasmallcatchmentaftera controlledherbicideapplication,Environ.Sci.Technol.38(2004)3835–3841. [53]L.Poissant,C.Beauvais,P.Lafrance,C.Deblois,Pesticidesinfluvialwetlands
catchments underintensiveagricultural activities,Sci.Total Environ.404 (2008)182–195.
[54]N.Berenzen,A.Lentzen-Godding,M.Probst,H.Schulz,R.Schulz,M.Liess,A comparisonofpredictedandmeasuredlevelsofrunoff-relatedpesticide con-centrationsinsmalllowlandstreamsonalandscapelevel,Chemosphere58 (2005)683–691.
[55]J.M.Sánchez-Pérez,M.Gerino,S.Sauvage,P.Dumas,E.Maneux,F.Julien,etal., Effectsofwastewatertreatmentplantpollutiononin-streamecosystems func-tionsinanagriculturalwatershed,Int.J.Lim.45(2009)79–92.
[56]Y.Luo,M.Zhang,Management-orientedsensitivityanalysisforpesticide trans-portinwatershed-scalewaterqualitymodelingusingSWAT,Environ.Pollut. 157(2009)3370–3378.


![[PDF] Cours général d’initiation à Audacity pour débutant | Formation informatique](data:image/gif;base64,R0lGODlhAQABAIAAAP///wAAACH5BAEAAAAALAAAAAABAAEAAAICRAEAOw==)