DESIGN OF AN AUTOMATIC DEFECT TRACKING AND YIELD REPORTING SYSTEM FOR THE MANUFACTURING FLOOR
by
Edward Matthew Lee
B.S., Mechanical Engineering, GMI Engineering & Management Institute Submitted to the Department of Mechanical Engineering
and to the Sloan School of Management
in Partial Fulfillment of the Requirements for the Degrees of Master of Science in Mechanical Engineering
and
Master of Science in Management at the
Massachusetts Institute of Technology June 1994
C Massachusetts Institute of Technology, 1994
Signature of Author
-f,
Department of Mechanical Engineering Sloan School of Management
-. 1 -May 6, 1994
Certified by
Certified by
Accepted by
Kevin Otto Assistant Professor of Mechanical Engineering Thesis Supervisor
SRoy E. Welsch
Leaders for Manufacturing Professor of Statistics and Management Science .. .. Thesis Supervisor
.A-- A.Sn...
MASSACHU8I4
r.
Te.C;r.
b JSTIT r.
Ik T
" - ,,1
Ain A. Sonin Graduate Officer, Mechanical Engineering Department
I
DESIGN OF AN AUTOMATIC DEFECT TRACKING AND YIELD REPORTING SYSTEM FOR THE MANUFACTURING FLOOR
by
Edward Matthew Lee
Submitted to the Department of Mechanical Engineering and to the Sloan School of Management
on May 6, 1994
in Partial Fulfillment of the Requirements for the Degrees of Master of Science in Mechanical Engineering
and
Master of Science in Management ABSTRACT
A project to design an automatic method for tracking and reporting yields and defects was undertaken at a division of the Hewlett-Packard Company. Before the project began, the company had been manually collecting performance data, and automatically collecting cycle-time information on the production floor for a discreet component manufacturing area. Yield reports were manually constructed from this data. The process of constructing these reports was somewhat tedious, and accuracy issues had surfaced. This situation, combined with a rapidly changing business environment, necessitated the project. All of the materials were provided by the Hewlett-Packard Company.
The new system uses bar-code readers to enter production data into a centrally-located, relational database. A microcomputer-based application program was constructed to extract information from the central database, perform calculations on the data, and report the results to the user in both on-screen and hardcopy formats. The nature of the database searches are defined by the user, and the results are provided real-time. Various performance metrics, including First-Pass Yield and N-Pass Yield, can be returned by the system. New performance metrics were also defined that take advantage of the new reporting system.
These new performance metrics, Root Cause Yield and Average Number of Passes, can also be calculated automatically. In addition, Pareto Charts of defects can be created.
The thesis report is divided into three chapters. In the first chapter, the problem is introduced. In the second chapter, conclusions are given, as are recommendations for further study. In the third chapter, a detailed explanation of the methods used for the investigation are presented.
Supervisors:
Kevin Otto, Assistant Professor of Mechanical Engineering
PREFACE
This thesis was written to fulfill the thesis project requirement for the Master of Science in Mechanical Engineering and the Master of Science in Management Degrees at the Massachusetts Institute of Technology. It is the culmination of two years of work in the Leaders for Manufacturing Program. The program combines academic instruction in the classroom with practical experience in the workplace. The two years were divided between semesters at school and an internship at a company site, providing for a year-round educational process. The investigation and analysis of the problem discussed in this paper took place during a six and one-half month internship at Hewlett-Packard. It should be noted that a project of this scope and scale would have been very difficult, if not impossible, without the combination of managerial and engineering instruction provided by MIT. The author wishes to acknowledge the Leaders for Manufacturing Program and the National Science Foundation for their support of this work. Particular appreciation should also be given to the Medical Products Group of the Hewlett-Packard Company for the opportunity to carry out this investigation.
Several people were instrumental to the completion of this thesis by providing valuable information, assistance, and support. Their help proved to be essential to me throughout various phases of the project. In particular, the following individuals provided significant contributions:
1. Martha Keller, Manager, Component Assembly Department, Hewlett-Packard Company, helped me every step of the way and served as the project advisor at the company site. She helped with the formulation of the investigation, provided guidance throughout the study, supplied critical feedback, and aided in the implementation.
2. Dexter Daniel, Engineer, Wire and Test Department, Hewlett-Packard Company, provided enormous support and information during every phase of the investigation. He laid the groundwork for the
investigation and contributed fully half of the program code for the resulting system. Without Dexter, this thesis project could never have been realized.
3. Kate Stohlman, Manager, Component Manufacturing Section, Hewlett-Packard Company, initiated the project and provided necessary direction for the work. Kate acted as guide, advisor, and mentor.
4. Stu Siegel, Manager, Component Manufacturing Engineering, Hewlett-Packard Company, provided additional guidance, feedback and support. Stu's vision for the system kept the investigation focussed and moving toward the final goal.
5. Kevin Otto, Assistant Professor of Mechanical Engineering,
Massachusetts Institute of Technology, served as my thesis advisor from the engineering school. Kevin provided suggestions that led to new findings and a more well thought out analysis.
6. Roy Welsch, Professor of Management Science, Massachusetts Institute of Technology, served as my thesis advisor from the Sloan School of Management. Roy provided solid feedback on the program's functionality, as well as guidance and suggestions for addressing the organizational issues presented in the project.
7. Cecil Stackpole, Associate Professor of Communication, GMI Engineering and Management Institute, provided guidance for the organization and format of this thesis.
ADDITIONAL COPYRIGHT INFORMATION
References to various copyrighted software packages are made in this document. The appropriate copyright references are made below.
Microsoft® is a registered trademark of Microsoft Corporation WindowsTM is a trademark of Microsoft Corporation
Microsoft AccessTM is a trademark of Microsoft Corporation LANManagerTM is a trademark of Microsoft Corporation
Borland® is a registered trademark of Borland International, Inc. Paradox" is a registered trademark of Borland International, Inc.
Approach® is a registered trademark Approach Software Corporation, a wholly-owned subsidiary of Lotus Development Corporation
TABLE OF CONTENTS
ABSTRACT ... PREFACE ...
ADDITIONAL COPYRIGHT INFORMATION. ... LIST OF ILLUSTRATIONS ...
I. INTRODUCTION ... BACKGROUND ...
The Manufacturing Process ...
The Component Manufacturing Area. ... STATEMENT OF THE PROBLEM ...
Limitations of the Logbooks ... Limitations of the QIC System ... Limitations of the Reporting System ... Summary of the Problem ...
OBJECTIVES OF THE INVESTIGATION ... SIGNIFICANCE OF THE PROBLEM ...
Significance to Hewlett-Packard Company. ... Significance to the Leaders for Manufacturing Program Significance to the Thesis Author ...
SCOPE AND LIMITATIONS OF THE PROJECT ....
OTHER BACKGROUND INFORMATION. ...
METHODS AND MATERIALS FOR INVESTIGATION. PREVIEW OF THE REST OF THE REPORT. ...
. . . .11 . . . .13 . . . .14 . . . .15 . . . .17 . . . .17 . . . .18 . . . .20 . . . .27 . . . ..27 . . . .30 . . . .31 and MIT . ..32 . . . . .. . . .33 . . . .33 . . . .34 . . . .35 . . . .36
II. CONCLUSIONS AND RECOMMENDATIONS . PERFORMANCE METRICS.
First-Pass Yield... What is It? Why Measure It? N-Pass Yield ....
What is it? Why Measure It? Terminate Yield...
What is It? Why Measure It? Root Cause Yield..
What is It? Why Measure It? Average Number of PT
What is It? Why Measure It? Summary of Process 1 . . . .3 8 . . . .39 . . . .42 . . . .4 4 . . . .. .4 7 asses...49 Aetrics . . . .52
THE YIELD AND DEFECT REPORTING SYSTEM ... 52
The Nature of the Data Collection Scheme ... 53
Collection and Reporting Schemes Outside vs. In-House Development Database Infrastructure ... 61
Database Architecture ... 62
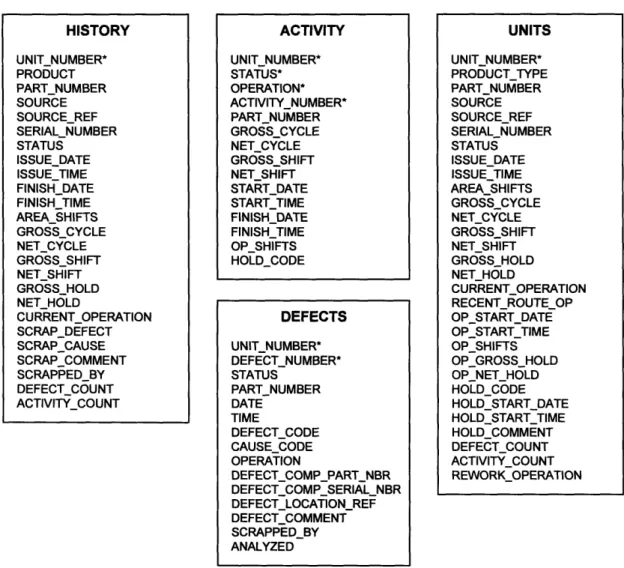
The UNITS Table The ACTIVITY Table The DEFECTS Table The HISTORY Table Use of the System -Entering Data Other Tables The Yield Reporting and Defect Tracking Application. ... 70
RECOMMENDATIONS FOR FURTHER ANALYSIS ... 73
System Ownership ... Database Size ... . . . .73
. . . .74
III. DISCUSSION ...
BACKGROUND OF EXISTING DATA INFRASTRUCTURE. INFORMATION GATHERING ...
Informal Interviews ...
Surveys . . . . Operator Yield Reporting Survey
Engineer Yield Reporting Survey Time Survey Programming Tools ... . . . .75 . . . .76 . . . .78 . . . .79 . . . .80 . . . .84 PROTOTYPE BUILDING ... Refining Customer Needs and Expectations ... Pareto Chart building Definitions of Yield Numbers Root Cause Defect Map Usability Feedback ... Programming Skill Practice... PROTOTYPE REFINEMENT AND SOLUTION GENERATION. Solution Generation ... Implementation ... Final Project Analysis ... BIBLIOGRAPHY ... . . . 10 1 .... 86 . . . .87 .... 92 .... 93 .... 94 .... 94 .... 96 .... 97 ... 100 APPENDICES ...
LIST OF ILLUSTRATIONS FIGURES 1. 2. 3. 4. 5. 6. 7. 8. 9. 10. 11. 12. 13. 14. 15. 16. 17.
Process Flow in the Manufacturing Area . ... 14
Illustration of the Creation of Downstream Defects . ... 19
The Process of Generating the Manual Yield Report. ... 21
Sample Section of the Manual Report . ... 22
Calculations for Terminate and N-Pass Yields . ... 26
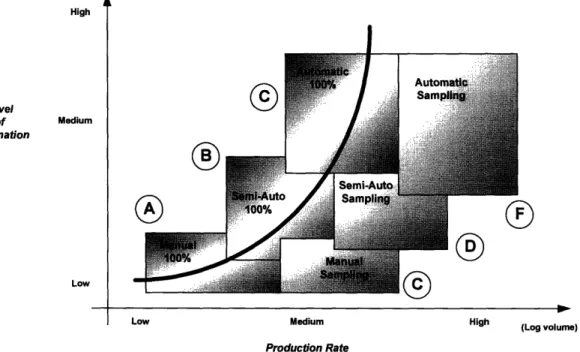
The Division's Information Strategy for the Manufacturing Floor. . ... . . 31
Description of the Flow of this Document . ... 37
Manufacturing Hierarchy ... 55
Manufacturing Information Strategy Matrix . ... 56
Diagram of the Infrastructure of the Information System ... 61
The Four Main Tables in the Yield and Defect Reporting System . . .. 63
Progress of a Unit Through the Manufacturing Process ... 68
Second Half of the Sample Unit's Progress Through the Manufacturing Area . ... 69
Program Manager Screen ... 71
The Opening Screen of the MARS Program . ... 72
The Main Menu for the Mars Program . ... 72
18. Pareto Screen for the MARS System . ... 90
TABLES I. Correct and Incorrect Method for Determining Composite Yield . . . . 24
II. Comparison of Yield Results from Different Reports . ... 28
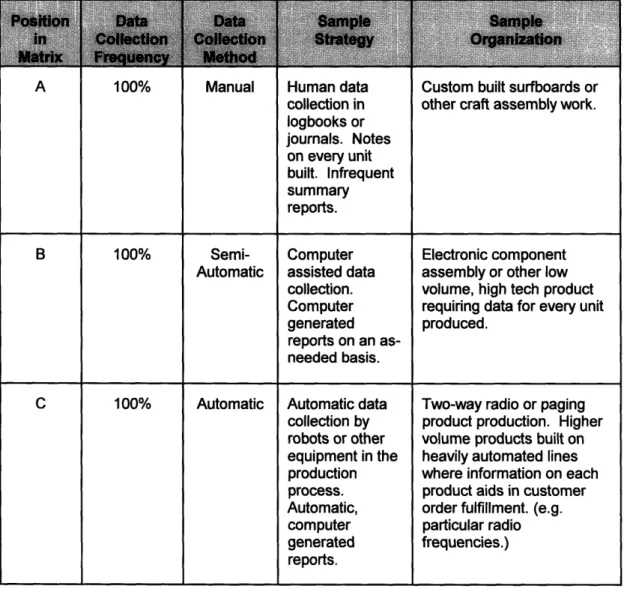
III. Explanation of Information Strategy Matrix . ... 57
IV. Sample Record from the History Table. . ... 64
V. Outline for Investigation ... 76
VI. Questions Regarding Manufacturing Data Collection . ... 80
VII. Top Eight Comments Returned On Technician Yield Reporting Survey ... 81
I. INTRODUCTION
In the manufacturing environment, speed has become a new measure of importance. In order to compete in a global economy, production cycle times have to be reduced, time to market has to be improved, and customer response times must be shortened. If companies don't follow this advice, their speedier competitors will rush past them to greater financial rewards. Much attention has been given to using information technologies to help companies achieve this new level of speed.
However, heavy investments in information technology have delivered disappointing results. In turn, these results have prompted some companies to stop any further investments in information technology. According to managers at these companies, the investment just hasn't been worth it. Michael Hammer, president of Hammer and Co., an independent information technology consulting firm in
Cambridge, MA, believes that this disappointment stems largely from the way the new technology is used. In his view, companies tend to use technology to mechanize the old ways of doing business. They leave the existing processes intact and use computers simply to speed them up.'
But speeding old processes cannot address their inherent fundamental deficiencies. Unfortunately, many of our current job flows, work designs,
'Hammer, Michael, "Re-engineering Work: Don't Automate, Obliterate", Harvard Business
organizational structures, and control mechanisms came of age in a different competitive environment - before the advent of the computer. These processes are
geared toward efficiency and control. Yet the buzzwords of today are innovation and speed, service and quality. Instead of "paving cow paths," by overlaying new
technology on old processes, Hammer suggests that we obliterate our outdated processes and start over. To use a term that he coined, we should "re-engineer" our
business. That is: use the power of modem information technology to radically redesign our business processes in order to receive dramatic improvements in their performance.
A division of Hewlett-Packard Company recognized, last year, that they needed to change the way in which production performance information was collected and distributed to the members of the manufacturing areas. While a solid performer in their field, they faced formidable competition from focussed domestic players, as well as large foreign competitors. The market for medical technology has been changing rapidly, posing new challenges to all areas within the company. HP
understood that faster information flow in the manufacturing area could help them to respond to their changing external environment.
This thesis, "Design of an Automatic Defect Tracking and Yield Reporting System for the Manufacturing Floor," was brought about by the need to re-engineer HP's manufacturing information system. My work at the company site involved understanding the problems that they were having with the current system,
track and report production performance information. Following Hammer's advice, I chose to institute a new system instead of merely automating the old one. I hope that this paper can be used as a guide for those attempting to employ computers to track
manufacturing data, or by others who are trying to re-engineer different processes within their companies.
BACKGROUND
Organizationally, the division is part of the Medical Products Group within Hewlett-Packard. The Medical Products Group builds a wide variety of high-tech medical equipment, primarily for use in hospitals and larger clinics. Their products range from bedside monitors for intensive care units, to hospital-wide information systems, to stethoscopes. The products, like those built by other high-tech companies, are low volume, high mix, high precision devices, constructed of high value-added materials. To accomplish the difficult task of building these products, HP employs a workforce of highly skilled technicians. In addition, HP has a goal to implement self-directed work teams on the manufacturing floor. Accurate, up-to-date information has to be available to everyone on the floor, in rapid fashion, for groups of technicians to be able to function as self-directed teams.
The Manufacturing Process
The manufacturing process at the division is divided into five main parts, as shown in Figure 1 below. The Component Manufacturing Area builds
sub-Figure 1. Process flow in the manufacturing area.
assemblies that are later wired into a completed assemblies. This wiring takes place in the Wire and Test Area. While these products are being built, circuit boards are constructed. At the System Assembly Area, completed electronic components and circuit boards are assembled into finished systems. The systems are then packaged and shipped to customers. The bulk of this paper focusses on the unique problems of the Component Manufacturing Area, although the results and conclusions are
applicable to the entire manufacturing process. Also, because of the proprietary and sensitive nature of the actual manufacturing process at Hewlett-Packard, some of the examples in this paper will use the construction of a toy car to illustrate the various assembly steps in the process.
The Component Manufacturing Area
Before the investigation began, the Component Manufacturing Area tracked three primary types of data on the manufacturing floor. These were the number of
good units produced per day, the defects associated with rejected units, and the cycle times associated with terminated units.2 The number of good units was used to
formulate yield figures. These yield figures, in turn, were used to evaluate the performance of the manufacturing line, while the defect information was used to
direct improvements in the process. HP has a well-established continuous improvement process.
The company had a variety of methods in place to handle the problem of yield and defect tracking and reporting. At every process step, the technicians logged each unit into a logbook as it entered the operation. As the units left the operation, they were logged-out either as good parts or scrap. By dividing the number of good units by the number of total units started, each technician could calculate a "first-pass yield" for the day. This yield number was useful in that it gave the technicians an idea of "how the process went" that day. These logbooks were located at every operation step.
In addition to the logbooks, where a lot of manual data was collected, there was an automatic tracking system called QIC. The QIC (Quality Improvement using
2For the purposes of this investigation, I will use the expression terminated to indicate units that
have exited the manufacturing process, whether as acceptable units or as rejected units. The term scrap will often be used to denote rejected units.
Cycle Times) System was put into place four years prior to help the company report the cycle times of their parts. The system used bar-code readers to scan each unit as it entered and exited the manufacturing area. A line of information was entered into a database when each unit was scanned-in. The units were identified in the database by a unique Unit Number. Each piece of data was then updated with the cycle time when the particular unit was scanned-out. The QIC System was driven by a dedicated PC that calculated the cycle times and managed the transactions. At the end of the month, all of the entries in the database table were averaged by part number, the results of which were printed in a paper report. If a unit was scrapped, the QIC
System stored a "defect code" and a brief description of the defect, along with the unit number, in a separate table in the database. A more detailed description of the QIC
System is given on page 76.
In addition to the logbooks and QIC, a stack of information sheets called the
"fab file" was routed with each unit as it proceeded through the assembly process. The technicians in the manufacturing area had to sign their initials to the fab file at each step, indicating that their particular operation had been successfully completed for each unit. The fab file contained information on the component lot numbers added at each step, test results, and other engineering data. The Food and Drug Administration required much of the information contained in the fab files.
Once a month, several individuals gathered data from the logbooks and the QIC System to form a yield summary for the manufacturing floor. Then, yield reports were generated by breaking down the yields for each part number and operation and
typing the results into a spreadsheet. Pareto Charts of defects were constructed partially by manual counting, and partially through the execution of spreadsheet macros.
STATEMENT OF THE PROBLEM
The manual data collection and semi-automatic report generation served HP for a number of years. The system allowed for the smooth introduction of new products, the successful completion of process improvements, and the reduction of cycle times. Engineers and managers could count on regular reports of process performance. Dedicated line support personnel maintained and improved the system over time. However, there were still a few limitations to the system. Below are some of the more major limitations that sometimes made it difficult to get accurate, timely
information from the system.
Limitations of the Logbooks
The logbooks mentioned in the last section were located at each workcenter at various locations spread-out over the entire manufacturing floor. This meant that the
line support personnel involved in calculating the yields at the end of each month had to spend a large amount of time on the floor collecting data from the different
even more time asking various technicians to "fill in the gaps" in the data. Indeed, due to the increasing complexity of the products, gaps in the logbooks were becoming more and more frequent. The line support personnel sometimes complained that their job was getting tougher as time went on.
Limitations of the QIC System
Units were scanned-out of the QIC System for one of two reasons - either as good units or scrapped units. When a unit was scanned-out as a scrapped unit, the technician also stored a defect code. The four-digit defect codes incorporated a two-digit defect identifier and a two two-digit operation number to help identify the location in the process where the defect occurred. Then, at the end of the month, the person compiling the data would be able to tell which operation had the highest incidence of
scrapped units. But, while storing the operation number where the unit was scrapped was appropriate in most cases, there were many instances where the defect was
discovered at an operation that was different than the operation where the defect was produced. As a result, an operation was often "charged" for a defect which did not
originate at that operation. For example, a defect caused by a faulty part attached at Operation 10 that is later discovered at Operation 20 will be counted as an "Operation 20 defect," instead of an "Operation 10 defect." As a result, Operation 20's yield will be artificially lowered, even though the defect was really attributable to Operation 10's process. Figure 2 on the next page provides an illustration of this point. The
front bumper is attached to the car at Operation 10. Later, while the technician at Operation 20 is attempting to attach the rear bumper, the front bumper falls off, causing the car to be scrapped. The yield for Operation 20 will be lowered, even though the cause of the problem was that the technician at Operation 10, let's assume,
While technician is Technician attaches attaching rear bumpber...
0
...front bumperfalls off.
OPERATION 10 OPERATION 20
First-Pass Yield = 100% First-Pass Yield = 0%
Figure 2. Illustration of the creation of downstream defects.
used an incorrect amount of torque on the screws. Assume, also, that this was a relatively common occurrence at a few of the operations. Not only did this situation lead to inaccurate reporting of yields for Operations 10 and 20, but there was no formal mechanism in place to feed the information about downstream defects back to the originating operation.
Another limitation of the QIC System stemmed from the fact that only two "snapshots" were taken of each unit that passed through the manufacturing area - one at the beginning, and one at the end. As such, QIC didn't allow for the tracking of a unit as it progressed through each operation in the area. To get information for each operation, a person had to manually get the data from the technician's logbooks.
Furthermore, the defect codes that were entered into the system were seldom
more than failure modes, not detailed descriptions of why a unit failed. While many units were torn-down by technicians to determine the root cause of the defect, the QIC
System still only stored the original failure code; even if the root cause analysis unearthed a different reason for the failure. Therefore, any Pareto Charts generated from the QIC System were somewhat inaccurate, in that they didn't contain the most up-to-date data.
Limitations of the Reporting System
Two yield reports were produced each month. One was produced by the line support personnel, who collected yield data from the logbooks. This was known as the manual report. Another report, the semi-automatic report, was produced by an
engineer who had ownership for the QIC System. Her job was to execute some spreadsheet macros that converted the data from Paradox database format into Lotus 1-2-3 spreadsheet format. Each report was distributed to process engineers,
supervisors, and managers, and each report had its own unique limitations.
The manual report was extremely difficult to generate. It required the line support personnel to follow the process outlined in Figure 3 on page 21. The process was very tedious, since the technician's logbooks were scattered throughout the manufacturing floor. Completion of the report took two coordinators approximately two full days to gather the information, check it for completeness and accuracy, and generate the document. A sample of the document is given in
Scan the operator's logbook to determine how many units were started into the particular operation during the month.
Get a "Terminate Report" compiled by the operator responsible for scrapping all of the rejected units during the month.
Subtract the number of terminated units from the total number started into an operation to get an "N-Pass Yield" for each operation.
Break the resulting yield results
down by part number.
V
Type the result into a Lotus 1-2-3
spreadsheet.
Repeat for each operation in the process & generate compound yields for each product Figure 3. The process of generating the manual yield report.
Appendix A on page 102.
Note that the third box from the top of Figure 3 mentions the term "N-Pass Yield." This term was generally understood to indicate the total number of good completed units built during a specific time period, divided by the total number of starts for a time period. This differs from "First Pass Yield" in a number of ways. See the section titled "Performance Metrics" on page 38 for more precise definitions of the yield numbers.
f
!
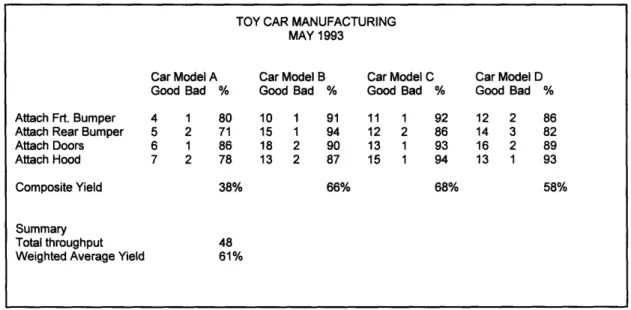
Figure 4. Sample section of the manual report.
Figure 4 above gives a sample section of the report. The section is for four different part numbers of cars. The number of units that were determined to be "good" or "bad" for each operation and part number is given. Note that the yield percent was determined by dividing the number of good units by the number of total units that passed through he particular operation in the process. This is consistent with the definition of N-Pass Yield above.
The Composite Yields in Figure 4 were determined by multiplying the different N-Pass Yield percentages together for each operation. Then, a Weighted Average Yield was determined by multiplying the Composite Yield for each part number by its share of the total throughput for the month. Both the Composite Yield number and the Weighted Average Yield number are misleading, however.
Because it takes considerably less than a month for a unit to pass through the entire process, and because the yield report is simply a monthly snapshot of the
TOY CAR MANUFACTURING MAY 1993
Car Model A Car Model B Car Model C Car Model D Good Bad % Good Bad % Good Bad % Good Bad % Attach Frt. Bumper 4 1 80 10 1 91 11 1 92 12 2 86 Attach Rear Bumper 5 2 71 15 1 94 12 2 86 14 3 82 Attach Doors 6 1 86 18 2 90 13 1 93 16 2 89
Attach Hood 7 2 78 13 2 87 15 1 94 13 1 93
Composite Yield 38% 66% 68% 58%
Summary
Total throughput 48 Weighted Average Yield 61%
process, a lag is introduced between each operation. This may mean, therefore, that the four units that are accounted for in the first operation for Model A in Figure 4 are not necessarily the same four units that are represented in each subsequent operation. For example, while seven units went through "attach doors" on May 15, seven
completely different units passed through "attach hood." Because of this, the term "Composite Yield," as used in this context, is inaccurate. One can only use the term "Composite Yield" when the same group of units is referred to at each operation. An example of this is given in Table I on page 24. Note that the ten units in the first table are followed through the entire process. In the final analysis, there were ten units started into the manufacturing area in May, of which two were successfully shipped to customers. The total Composite Yield was, therefore, 20 percent. However, in the second table, two separate groups of ten units are followed through the process. By this table, ten new units entered the process in May, and two are likewise shipped to customers, but the Composite Yield is calculated as only 14%. This is due to the fact that there were other units (most likely started into the process in April), that
confounded the calculation. This is an illustration of a significant limitation in the manual yield report. Different units, that are started in different months, are included in the Composite Yield calculation for a single month, giving incorrect results.
The phenomenon of the Composite Yield inaccuracy was further disturbing in light of the fact that "Total Process Yield" was included at the bottom of the manual
report that was the product of all of the Composite Yields for each part family.
Table I
Correct and Incorrect Method for Determining Composite Yield
Attach Body Attach Wheels Attach Doors Attach Bumpers 10 9 7 4 7 4 2 2 3 2 TOTAL 10 2 8
Date Operation Total Number Number
Starts Good Bad
5/1 Attach Body 10 9 1
5/10 Attach Wheels 9 7 2
5/1 Attach Doors 10 4 6
5/10 Attach Bumpers 4 2 2
TOTAL
number that was generally understood to represent the overall performance of the manufacturing area, and it was closely followed by upper management. However, as one can see, the Total Process Yield was created by multiplying several inaccurate numbers, namely the various Composite Yields, together.
Furthermore, the monthly snapshot provided by this report was inadequate because it had no way of giving trend information over the course of a month. A monthly yield of 50% for an operation may mean that the process had a 50% yield every day for 30 days, or it may mean that the operation had a yield of 0% every other
5/1 5/10 5/20 5/30 Correct Method Incorrect Method
7:11i
90% 78% 57% 50% 20% Yield 90% 78% 40% 50% 14%I
I
day, and 100% every other day. The engineer responsible for each operation generally knew this day-by-day information, but it wasn't documented in the yield reports. Lastly, the time consumed in generating the manual report made the possibility of obtaining more than one report per month fairly unrealistic.
Earlier, I mentioned the other semi-automatic report that was generated from the QIC data. Like the manual report dissected in the preceding few paragraphs, the
semi-automatic report contained some inadequacies. A copy of this report is given in
Appendix B on page 103.
Like the manual report, it was also tedious to generate, and therefore only produced on a monthly basis. As such, it didn't give insight into daily performance.
The QIC System took information in the form of a "defect code" from technicians whenever a unit had to be scrapped. A Pareto Chart could then be generated from data on the QIC System. However, the format for this Pareto Chart was difficult to read. Note the bottom half of the report in Appendix B on page 103. The Pareto Chart is certainly there, but in a rather difficult and non-conventional format.
Perhaps the most glaring shortcoming of this report was that it didn't give any information for the specific operations in the manufacturing area. This was because the QIC System only obtained two pieces of information about each unit - the starting point and the termination point. Data was not entered into the QIC System for each
operation in-between.
semi-automatic report were known as "Terminate Yields." That is, the yields were
calculated from the units that were terminated3 from the manufacturing process for the
time period of the report. The resulting numbers were very different from the "N-Pass Yields" depicted in the manual report. Figure 5 shows the difference in calculations for the two numbers. Needless to say, the yield numbers contained in the
Terminate Yield = number of good units number of total terminates
number of good units
N-Pass yield =
number of starts
Figure 5. Calculations for Terminate and N-Pass Yields. Note the difference.
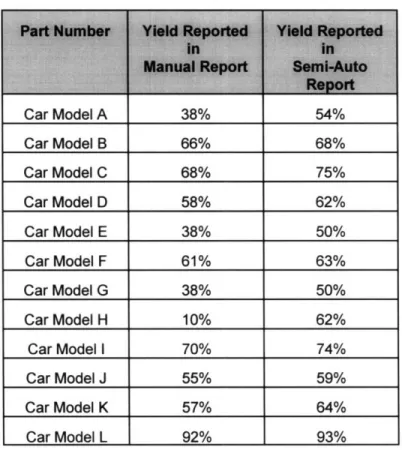
manual report did not match those contained in the semi-automatic report. Table II
on page 28 shows the resulting yield numbers for the month of May, 1993 from the two reports. The numbers represented in the two reports were actually the result of two fundamentally different calculations. The fact that the numbers from the two reports did not agree served to lessen the credibility of both reports. Many engineers calculated their own yield numbers when they needed to have yield information, instead of relying on the reports. When surveyed about how much time engineers spent calculating yield numbers, the average number returned was three hours per week per support engineer.
3
Recall that the term terminated in this context means "exited the system." A terminate may be a successfully shipped "good" unit, or an unsuccessful, scrapped "bad" unit. Within a given time frame, the number of terminates differs from the number of starts by the amount of work in process.
Neither the manual report nor the semi-automatic report contained
information about rework events. When a unit was reworked for a specific defect, the defect description and the outcome of the rework event were only tracked in the fab file, not on QIC or in the logbooks. As a result, assembling a monthly summary report of rework information would require an individual to scan all of the fab files for every unit produced over the month. Since this would be a truly grueling task, it was rarely done.
Summary ofProblem
I have detailed the major problems with the old method of reporting yields and tracking defects on the manufacturing floor at the division. This system, although flawed, served the company for many years. The reader is reminded that the system was entirely adequate until recently, when stronger demands from the market and increases in production volume and mix began to strain its foundation. However, it was clear to many that something needed to be done to change the way in which performance information was collected and reported.
OBJECTIVES OF THE INVESTIGATION
There needed to be a method by which mangers, engineers, and technicians could get up-to-the minute information on the yields and defects for each operation,
TABLE II
Comparison of Yield Results from Different Reports May, 1993 Car Model A Car Model B Car Model C Car Model D Car Model E Car Model F Car Model G Car Model H Car Model I Car Model J Car Model K Car Model L 38% 66% 68% 58% 38% 61% 38% 10% 70% 55% 57% 92% 54% 68% 75% 62% 50% 63% 50% 62% 74% 59% 64% 93% *Numbers have been disguised.
and for the manufacturing area as a whole. The primary purpose of my investigation was to re-engineer the process of obtaining and reporting performance information on the manufacturing floor. As such, I planned to design an information system.
The design of my system had to meet three goals. First, it had to be able to satisfy the needs of the customers; namely the technicians, engineers, and managers in the Component Manufacturing Area. Second, it needed to fit into the overall strategy for information systems at Hewlett-Packard. Third, the project needed to be
completed in the context of my six and one-half month internship.
There were three primary milestones in the progress of the investigation. These milestones served as the objectives of my investigation, and are detailed here.
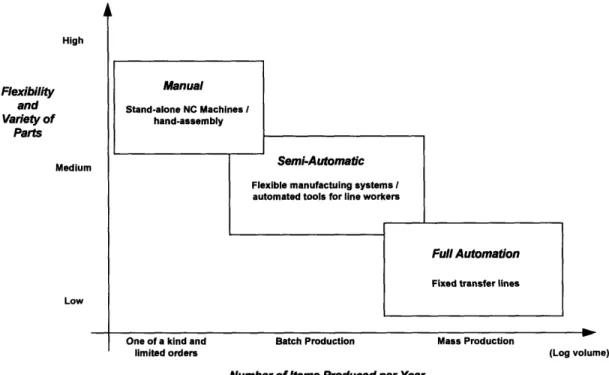
First, I had to determine the appropriateness of an automated data collection scheme. When data is being collected and manipulated in a manufacturing
environment, there should be a good fit of the method to the conditions. In a low-volume environment, or in an environment where reporting is infrequent, manual collection schemes often prove to be adequate, and the expense of automatic, electronic systems is unwarranted. As volumes increase, or the need for more frequent data handling and reporting arises, the time involved in manually preparing reports may eventually outweigh the time needed to develop an automatic collection scheme. With high volume production, tracking each individual part may become unnecessary, and sampling becomes the most efficient way to collect meaningful data. I devoted some time to the investigation of the tradeoffs between the manual,
automatic, and sampling data collection schemes, and the appropriateness of automatic data collection in this particular instance.
Second, as part of the investigation, I had to determine what information was genuinely useful and needed by the various personnel in the area. The process metrics employed had to pass a litmus test of usefulness. The definitions of these metrics also had to be solidified. Any additional metrics that allowed technicians to better monitor themselves, engineers to more easily prioritize work, and mangers to allocate
Lastly, I endeavored to design a PC-based reporting program that would allow information to be retrieved from a central database quickly. When completed, a person seeking information from the database should be able to ask the system to
query the data on a variety of parameters (part numbers, dates). The user should be able to interactively define these parameters, or criteria, for each search. The program should then be able to generate yield snapshots, as well as produce graphs of yield
trends. It should also be able to generate Pareto Charts of defects. Furthermore, a
friendly and efficient user-interface had to be designed to accomplish the task. A system that is difficult to use would not be used. I drew upon knowledge of user-interface design that I gained in coursework at MIT.
Taking these milestones into account, and the goals of re-engineering, the chief objective of my investigation was to develop a new system that shortened the time needed to get information on process performance, while improving the accuracy of the information.
SIGNIFICANCE OF THE PROBLEM
In general, by shortening the time needed to get information about process performance, while improving the accuracy of information presented, it becomes more readily apparent where process improvements can have the greatest impact. Successful resolution of the problems presented can have a positive effect on all the major parties involved in the investigation. The completion of this thesis, therefore,
has significance not only to Hewlett-Packard, but to MIT and others. The extent of this is detailed below.
Significance to Hewlett-Packard Company
In addition to solving the problems outlined in the previous few sections, there are other benefits to the company sponsoring the project. The division has a goal to completely automate and computerize data collection and retrieval on the
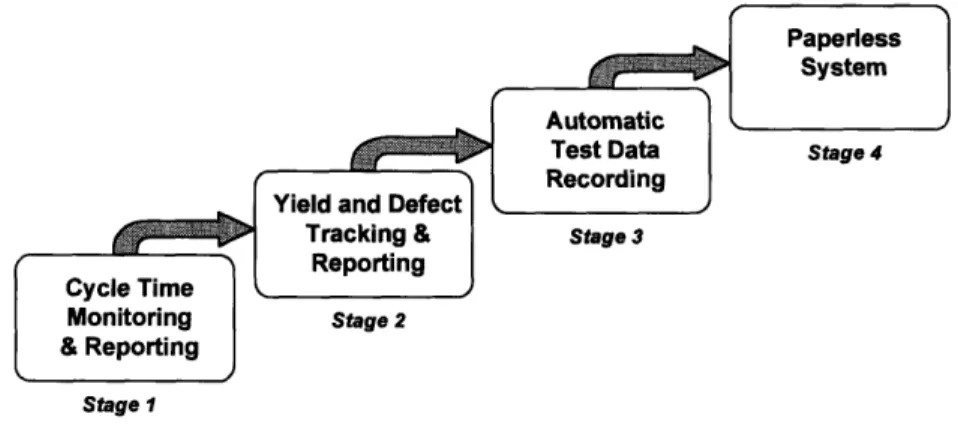
manufacturing floor. The plan for this is outlined in Figure 6 below. The first step, the automatic calculation of cycle times, is already in place with the QIC System. The next step, computer tracking of yields and defects, will hopefully be accomplished by the project presented here. Then, the company can focus on getting all
computer-Stage 1
Figure 6. The division's information strategy for the manufacturing floor. This project embodies Stage 2.
generated test data out of the fab files and into a central electronic database. Lastly, the paper fab file system can be eliminated by having all data entered, stored,
manipulated, and retrieved via computer. This project, as one can see, is a vital step on the road to a paperless system at HP. With improved tools, such as the one proposed here, the company can streamline information flow in the manufacturing area, leading to better management and engineering decisions, and hopefully leading to a cost savings for the company.
Additionally, HP will gain a tool that will help the company to implement self-directed work teams by providing technicians with the ability to measure their own performance.
Significance to the Leaders for Manufacturing Program and MIT
With this project, LFM and MIT can strengthen their alliance with Hewlett-Packard. One way that this project accomplishes this goal is by improving the already
strong relationship between the Medical Products Group and faculty at MIT. Two faculty members assisted in the definition and implementation of this project. Kevin
Otto, Assistant Professor of Mechanical Engineering, provided guidance pertaining to the structure of the program and the construction of the user interface. Roy Welsch, Professor of Management Science at the Sloan School of Management, provided
assistance with regard to data handling and manipulation, as well as guidance into other management issues related to the project. Both professors have guided the production of the actual thesis document.
Manufacturing Program. A successful project that provides an economic return to the company can help to justify Hewlett-Packard's continuing participation in the LFM Program. With HP's help, LFM can potentially be a key force in the strengthening of manufacturing education in America.
Significance to the Thesis Author
This project provided me with the opportunity to gain experience tackling a complex problem in a manufacturing environment. I was given the rare opportunity to implement the ideas and knowledge gained from my classes at MIT in a controlled setting. I also gained new knowledge on database and network management, two fields that are becoming increasingly important in manufacturing.
SCOPE AND LIMITATIONS OF THE PROJECT
The PC application resulting from this project is concerned with yield and defect tracking and reporting. The actual data input tools were developed by other engineers working at HP. I have responsibly documented the contributions that I made to the best of my ability, so that future HP engineers can make the proper
modifications to the work that I have performed as new needs arise.
I have limited the investigation primarily to the Component Assembly Department within the manufacturing area, building off of the QIC System hardware
that was already installed there. All units that pass through this portion of the manufacturing floor have their own "identities" in the form of bar-coded labels, thus
simplifying the tracking effort. I did not specifically address the Parts Fabrication Department, nor did I concern myself with downstream processes. Instead, I
attempted to attach appropriate handles to the program that should allow modules pertaining to these areas to be added later. The six and one-half month time period
allotted for the investigation was the true limiting factor.
OTHER BACKGROUND INFORMATION
In the months before this investigation, I conducted informal interviews with members of the Component Manufacturing Department to help identify problems with the existing yield reporting methods. It was from these interviews that I was able to formulate the project.
The QIC System, in place at the division, stored data in Paradox-formatted database tables located on a network. Because the project was intended to build upon the database connected to the QIC System, I used the Paradox Application Language (PAL) to write the code for the application. (For more information on my selection of Paradox, please see the section titled "Programming Tools" on page 84.) I consulted two books of Paradox and PAL. The first was Mastering Paradox for Windows by
Alan Simpson.4 This book helped me to understand the fundamentals of database
4Simpson, Alan, Mastering Paradox for Windows, (Alameda, CA: Sybex, 1993) 34
construction as well as the structure of Paradox tables. For help on the programming language, I consulted Paradox for Windows Programming by Example, by Diane
Tinney.5 The author of the book does an excellent job of presenting ObjectPAL, the object-oriented version of the PAL language. Without this book, I would not have been able to begin this project.
Much of the investigation, especially the design of the user interface, will be conducted using methods taken from "Concept Engineering," a publication by Gary Burchill of the Center for Quality Management in Massachusetts.6 CQM consults companies on the product development cycle, and Concept Engineering is a technique for taking customer voices and translating them into designs.
METHODS AND MATERIALS FOR INVESTIGATION
In this section, I will give a skeletal overview of the methods that I used to conduct the investigation. A more detailed account can be found in Chapter Three, but I feel as though an overview will help the reader to better understand the conclusions presented in the next chapter. To begin, I conducted interviews and a formal survey at the site. Then, I used to some of the tools of Concept Engineering to further identify and define the needs of the customer, and to formulate a preliminary
'Tinney, Diane, Paradox for Windows Programming by Example, (Carmel, IN: Que, 1993)
6"Concept Engineering", tools for listening to the voice of the customer, available from Gary Burchill, the Center for Quality Management, Massachusetts, 1992, or from the Leaders for
Manufacturing Program at MIT, Cambridge, Massachusetts. 35
design. Concurrent with the construction of the preliminary design, efforts were made to develop and refine the metrics that were to be the output of the program. After reviewing the design with people at HP, refinements were made. The program was then implemented on a trial basis.
All of the materials for this project were furnished by the Hewlett-Packard Company. The investigation took place on-site at the HP division. HP gave me the use of a personal computer, along with all of the software and tools necessary to complete the project.
PREVIEW OF THE REST OF THE REPORT
It is hoped that this introduction has served to give the reader a solid understanding of the nature and significance of the problems faced by Hewlett-Packard. In it, I have tried to answer two questions. First, "What was the problem?" Second, "Why bother to solve it?" Armed with this answers to these questions, the reader should be ready with a third question, namely, "What is the solution?"
Immediately following this section is chapter outlining the conclusions that I reached, along with some recommendations for further study. The chapter is broken down into three main sections. The first section is designed to describe the new metrics that I developed to allow the key groups of customers (technicians, engineers,
and managers) to gauge the performance of the manufacturing area and to pinpoint problems. The second section is designed to provide an overview of the tracking and
reporting system that I developed to deliver the new metrics to the key customer groups. The last section discusses my recommendations for further improvements to the system.
A third chapter, beginning on page 75, discusses the methods used in the investigation in greater detail. The flow of the paper, therefore, will follow Figure 7 below.
II. CONCLUSIONS AND RECOMMENDATIONS
This chapter is divided into three main sections. The first section is designed to describe the new and redefined metrics that I developed to allow key groups of customers (technicians, engineers, and managers) to gauge the performance of the manufacturing area and to pinpoint problems. The second section is designed to provide an overview of the tracking and reporting system that I developed to deliver the new metrics to the key customer groups. The last section outlines a few
recommendations for further investigation.
PERFORMANCE METRICS
There were three yield numbers that were widely used as process metrics in the Component Manufacturing Area. They were the First-Pass Yield, the N-Pass Yield, and the Terminate Yield. Monthly reports of N-Pass Yields and Terminate Yields were provided by manual and semi-automatic methods to key members of the manufacturing area, while the calculation of First-Pass Yields was primarily restricted to the individual technicians' logbooks. One of the goals of my project was to
provide yield numbers automatically.
In order to generate these numbers with a computer program, I wanted to make sure that everyone shared a common interpretation of their definitions. This
was especially important in unique cases relating to rework, and in cases where there were significant time delays. (For example, if a unit starts work at Operation 10 on the last Friday in May, goes on "Hold," and is scrapped at the operation on the first
Monday in June, does the terminate get "charged" against the yield for May or June?) Also, I wanted to be sure that generating these metrics was indeed necessary.
Otherwise, the effort involved in collecting the data to do so would be wasted. Lastly, I wanted to determine exactly what data was needed to successfully calculate the metrics. Once the minimum data requirements were determined, I could suggest ways to eliminate the collection of extraneous data.
In addition, there were two new metrics that were developed. They were the
Root Cause Yield and the Average Number ofPasses. The new metrics were easy to
generate with a computer, and they grew out of input and feedback from Kate Stohlman, the Component Manufacturing Section Manager, Stu Siegel, the
Component Manufacturing Engineering Manager, and Martha Keller, the Component Assembly Production Supervisor.
This section of Chapter Two is intended to define the five metrics (three new ones and two old ones) that were used in the yield reporting system that I built. I will also describe why I chose these particular metrics as being important enough to track.
First-Pass Yield
what it is, then I will try to outline reasons why I felt that it was important enough to measure.
What is it?
For a single operation, First-Pass Yield refers to the outcome of a first run-through of fresh7 units. The figure is composed of a numerator and a denominator such that:
all parts that were good First-Pass Yield = numerator the first time through
denominator units started that day
Successfully reworked units are not counted as "good" in this calculation. Similarly, units that are initially good, but are later scrapped when they are returned to be reworked, are not counted as "bad" in the calculation. (Please see Appendix C on page 103 for an example.) In effect, the First-Pass Yield is saying, "Out of X new units, we successfully completed Y on the first try." In such a case, Y/X would be the First Pass Yield. Below are examples of what the numerator and denominator
components of this number represent.
Numerator: The number of successes resulting from the first time an operation is performed.
includes:
* Good Units
7
"Fresh" indicates that it is the first time that the unit has ever passed through the operation. A unit that is being reworked at an operation is no longer considered to be "fresh."
Numerator (cont...) * Units put on "Hold", but later determined to be acceptable
does not include:
* Units at an operation from a previous day that are successfully reworked
* Units that failed, but were successfully reworked at the operation
* Scrapped units
Denominator: The number of starts for the first run-through for an operation on a particular date
includes:
* All fresh units started at an operation for a given date does not include:
* Units at an operation that are on "Hold" from any previous days
* Any reworks from other operations
* Units held over for unfinished rework from any previous day
Why measure it?
First-Pass Yield is a good indicator of process robustness. A high First-Pass Yield means that the process is good at overcoming the variation in incoming
materials. It may also signify that the technicians aren't making very many mistakes. Conversely, a low number can point to problems with component parts or with the process itself. Further, a string of low First-Pass Yields is an immediate indication of trouble in a process. In many ways, it is the first sign that a process is not performing up to expectations.
N-Pass Yield
Like First-Pass Yield, N-Pass Yields were regularly monitored and reported when I arrived at the division. However, there wasn't a common definition of its meaning or a consensus of the proper method of calculation. Below is the definition that I used to build the reporting system.
What is it?
For a particular operation, the N-Pass Yield reflects the percentage of all units, started at a particular operation, that were passed on to the next operation without being scrapped. The figure is composed of a numerator and a denominator such that:
units started all units scrapped N-Pass Yield = numerator _ that day at that operation
denominator units startedthat day
In effect, the N-Pass Yield number is saying, "Out of X new units, Y eventually were successfully made available for work at the next operation." In such a case, Y/X would be the N-Pass Yield. Likewise, for an entire manufacturing area (i.e.
Component Manufacturing), the N-Pass Yield is the percentage of starts are shipped to the next manufacturing area (i.e. Wire and Test). Note that units scrapped
downstream are not "charged back" to the operation associated with the failing defect code, but are charged against the yield for the operation where they failed.
Numerator: The number of units which eventually successfully exit a particular operation
includes:
* Good units
* Successful reworks of units started that day * Units that go on "Hold" and are later determined to
be acceptable does not include:
* Units held over for unfinished rework from any previous day
* Units at an operation that are on "Hold" from any previous days
Denominator: The number of units started at a particular operation on a particular day
includes:
* All fresh units started at an operation for a given date does not include:
* Units at an operation that are on "Hold" from any previous days
* Any reworks from other operations
* Units held over for unfinished rework from any previous day
Why measure it?
The N-Pass Yield number paints a picture of process capacity. A high N-Pass Yield indicates the that a high percentage of the units passing through the process will eventually be shipped to the customer. While a low First-Pass Yield number is a sign that many units may need to be reworked at an operation before they are shipped, a low N-Pass Yield is a further indication that even rework efforts at an operation are not successful.
supervisors to forecast production capacity or output, and perform production scheduling.
Terminate Yield
The third and final metric in use at the time this investigation started was the Terminate Yield. There was some confusion among various members of the
Component Manufacturing Area between this metric and the N-Pass Yield. Recall from the introduction to this report that the Terminate Yields represented in the
semi-automatic report were sometimes mistakenly used interchangeably with the N-Pass
Yields represented in the manual report. I feel it necessary to define the term so that it could be distinguished from the N-Pass Yield.
What is it?
For a particular operation, the Terminate Yield reflects the percentage of units that leave an operation successfully during a time period. It is easier to calculate and produce because it doesn't take into account the date and time that units enter the operation (or "start"). For this reason, it can be applied to an entire manufacturing area more easily than any of the other metrics described in this section. The time lag introduced between operations is immaterial to the calculation, and the problems associated with the calculation of a Composite N-Pass Yield are avoided. (See the discussion on Composite Yields on page 22.)
The figure is composed of a numerator and a denominator such that:
total number number of
numerator of terminates scrapped units
Terminate Yield = =
denominator total number of terminates
In effect, the Terminate Yield number is saying, "Out of X units that left the operation (for any reason) during the specified time period, Y were successfully shipped as good units to the next operation." In such a case, Y/X would be the Terminate Yield. Likewise, for an entire manufacturing area (i.e. Component Manufacturing), the Terminate Yield is the percentage of all units that left the manufacturing area as good units and were shipped to the next manufacturing area (i.e. Wire and Test). Note that downstream terminates are not "charged back" to the operation associated with the failing defect code.
Numerator: The number of units which eventually successfully exit a particular operation
includes:
* Good units
* Successful reworks
* Units that go on "Hold" and are later determined to be acceptable
does not include:
* Units held over for unfinished rework from any previous day
* Units at an operation that are on "Hold" from any previous days
Denominator: The number of units leaving a particular operation on a particular day includes:
* All terminates, whether good units or scrap does not include:
* Units at an operation that are on "Hold" from any previous days
* Any reworks from other operations
* Units held over for unfinished rework from any previous day
Why Measure It?
Since the practice of calculating an accurate Composite N-Pass Yield is so difficult, the Terminate Yield is the only realistic alternative metric for establishing an overall process yield. However, there two key difficulties inherent in this number:
1.) The number is not a true "yield" number in that it doesn't account for the number of "starts" into a process in a particular time period. It only measures "finishes."
2.) Because the throughput time of a component is long, many of the units accounted for in any given month's Terminate Yield may have entered the process the month before. This introduces a time lag into the metric. For this reason, its usefulness is limited to some higher multiple of the
throughput time. In other words, it loses its meaning in yield calculations that are representative of times shorter than one month.
Because of these limitations, I was very hesitant to include this metric in the yield reporting system designed as part of this project. I will caution that its only real usefulness is as an alternative to the traditional calculation of Composite N-Pass Yield. While, as a metric, it isn't as good a as the other four discussed here, it is somewhat more accurate for reporting actual process performance than the Composite
Yield used in the manual report.
Root Cause Yield
In addition to the three metrics in place at the division before the project began, I found it necessary in the course of my investigation to develop two new performance measures to include in the tracking and reporting system. With the help of several key players in the division, the first one I developed is called Root Cause
Yield.
Root Cause Yield grew out of the problem of assigning responsibility for defects. Technicians at Operation 10, or some other early operation, desired a formal method of knowing whether or not the units that they built on a given day were ultimately shipped to customers as "good" units. Alternatively, technicians at any operation desired a way of knowing the quantity and nature of defects discovered at downstream operations that might have inadvertently been introduced in their own processes. Similarly, technicians at downstream operations were often "charged" for defects that were actually due to problems at upstream operations, resulting in the lowering of their yields. The Root Cause Yield is part of the solution to these problems.
What is it?
operation that were scrapped, at that operation or a downstream operation, for a defect code associated with that operation. The figure is composed of a numerator and a denominator such that:
numerator R C Yield = numerator denominator
all units scrapped units started at that operation that day for defects associated
with that operation
all units scrapped at downstream operations
for defects associated with that operation
In effect, the Root Cause Yield number is saying, "Out of X new units started at my operation today, Y eventually went on to be shipped to the Wire and Test Area without being scrapped by someone for a defect related to my operation". In such a case, Y/X would be the Root Cause Yield.
Numerator: The number of units that eventually successfully get shipped to the next manufacturing area without being scrapped for a defect code related to the particular operation
includes:
* Good units
* Successful reworks of parts started that day
* Units that go on "Hold" and are later determined to be acceptable
* Units that are scrapped at the operation for defects that are related to a different operation
does not include:
* Units held over for unfinished rework from any previous day
* Units at an operation that are on "Hold" from any previous days
* Units that are scrapped at an operation for generic defects.
Denominator: The number of units started at an operation on a particular day includes:
* All fresh units started at an operation for a given date units started that day
Denominator (continued...) does not include:
* Units at an operation that are on "Hold" from any previous days
* Any reworks from other operations
* Units held over for unfinished rework from any previous day
Why measure it?
Today, the average technician has no immediate method for determining whether his or her units are making it through the whole process successfully. Most technicians are informed when a large number of units that they built fail at
downstream operations. However, the communication channels are only informal. When surveyed, a number of the technicians commented that they didn't frequently get feedback on downstream defects until the number of occurrences was at crisis stage, and that they would rather get earlier, regular feedback.
Also, this metric is a true measure of process robustness. For example, if products leave Operation 10 successfully, only to be scrapped the next day for a defect related to Operation 10, Operation 10 isn't really successful. While scrapped units contributing to N-Pass Yields are not "charged-back" to the originating process, scrapped units contributing to Root Cause Yield are charged back. Taken in
combination, the N-Pass and Root Cause Yield metrics provide a lot of information.
Average Number of Passes
to successfully complete an operation is a new metric that I chose to define and include in the system. The need for it grew out of the fact that some units were believed to be living in "infinite rework loops" at particular operations. As such, there needed to be some method for capturing this information. The figure is
composed of a numerator and a denominator such that:
total number of passes a unit(s) makes numerator through an operation before being terminated
Average Number of Passes =
denominator units started that day
What is it?
This metric refers to the number of successive attempts that are required for a unit to complete an operation. To illustrate, assume that two units are started on a particular day. One unit takes three tries to pass the operation, while the other is deemed acceptable on the first try. The Average Number of Passes, therefore, is two.
Numerator: The number of times a unit (or units) passes through an operation before successfully being completed or scrapped
includes:
* All first-time passes, whether resulting in a rework event, good part, or scrap event
* Each successive rework attempt, whether it happens the same date or a subsequent date, and whether the result is a another rework event, good part, or scrap event does not include:
* Units at an operation that are on "Hold" from any previous days
* Any reworks from other operations