Appetite 163 (2021) 105216
Available online 27 March 2021
0195-6663/© 2021 The Author(s). Published by Elsevier Ltd. This is an open access article under the CC BY license (http://creativecommons.org/licenses/by/4.0/).
Analysis of the main determinants of away-from-home consumption of
fishery and aquaculture products in the EU28
Javier Cantillo
*
, Juan Carlos Martín, Concepci´on Rom´an
Institute of Tourism and Sustainable Economic Development, Universidad de Las Palmas de Gran Canaria, Las Palmas de Gran Canaria, Spain
A R T I C L E I N F O Keywords:
Heteroscedastic ordered probit model Marginal effects
Fishery and aquaculture products Residents’ away-from-home consumption behaviour
Frequency of consumption
A B S T R A C T
The European Union (EU) is the largest market in nominal terms for fishery and aquaculture products (FAPs), partly due to the away-from-home consumption of these products in restaurants and food outlets. In view of this, it is necessary to identify the main determinants of the away-from-home consumption patterns in order to propose strategies that could increase the consumption of FAPs. Following this, ordered probit models were estimated alongside their marginal effects to identify the most relevant factors determining the frequency of away-from-home consumption of FAPs in the EU28, using a representative sample of 27732 EU residents. We found that those in the highest classes of society are most likely to consume FAPs away-from-home more frequently. Also, the most important reasons for consuming FAPs away-from-home more frequently are that they are less expensive than other foods, taste good, and are healthy and easy to digest. In addition, among the different nationalities, British consumers are more likely to consume FAPs away-from-home. We also found that there is a higher frequency of away-from-home consumption of FAPs for consumers between the ages of 25 and 54, who do not live in rural areas, who prefer wild-caught and local and marine products, and that are very satisfied with their lives. The study contributes to the literature with the analysis of FAPs away-from-home consumption by using a large representative sample of EU28 consumers. The study is also relevant with respect to the extensive list of determinants that include factors related to the attitudes of respondents to FAPs and socio-demographic characteristics.
1. Introduction
Fishery and Aquaculture products (FAPs) consumption is an
impor-tant component of the human diet, as it accounts for around 17% of the
intake of animal protein in the global population (
FAO, 2018
).
Con-sumption of FAPs offers health benefits, due to the presence of high
biological value proteins, unsaturated fatty acids, vitamins and minerals
(
Sidhu, 2003
), while it has also been associated with a low risk of heart
disease (
Zarrazquin et al., 2014
). In addition,
Maciel et al. (2016
,
2019)
found that regular fish consumers had a better perception of the quality
of life and were more physically active; suggesting that they were
healthier people.
The average consumption of seafood by European residents is 24,33
kg per capita (
European Union, 2018b
), which is considerably higher
than the 20,3 kg per capita of global consumption (
FAO, 2018
). This is
not surprising given that the European Union (EU) is the largest trader in
nominal terms of FAPs in the world (
FAO, 2018
). Part of the
consump-tion is spent away-from-home, in places such as restaurants and food
outlets, where 32% of European residents consume FAPs at least once a
month and 11% at least once a week (
European Union, 2018a
).
Considering that consumers who purchase seafood more regularly
are more likely to pay higher prices for seafood than those who purchase
them less (
Quagrainie, 2006
), it is important to better understand the
patterns of consumption of FAPs in the EU. According to our best
knowledge, besides the numerous studies that analyse the preferences of
consumers and frequency of consumption of FAPs, only a small part of
them focuses on the identification of particular determinants of
away-from-home consumption. The limited number of studies (
Almeida
et al., 2015
;
Baptista et al., 2020
;
Herrmann et al., 1994
;
Hori et al.,
2020
) usually involves a particular country, region and/or fish species,
and the set of determinants is also limited in number and scope. Thus,
the obtained results are not easily generalizable and the value for
pol-icies that could involve supranational entities such as the EU is also
narrow.
The present investigation analyses the main determinants that
explain the frequency of away-from-home consumption of FAPs by
* Corresponding author.E-mail addresses: javier.cantillo101@alu.ulpgc.es (J. Cantillo), jcarlos.martin@ulpgc.es (J.C. Martín), concepcion.roman@ulpgc.es (C. Rom´an).
Contents lists available at
ScienceDirect
Appetite
journal homepage:
www.elsevier.com/locate/appet
https://doi.org/10.1016/j.appet.2021.105216
European residents using for the first time a heteroscedastic ordered
probit model. Ordered Probit models are a proper analytical framework
when the responses of a survey are ordinal (
Kumar et al., 2008
;
Thong &
Solgaard, 2017
). In addition, the heteroscedastic model does not assume
that error variances are constant or homoscedastic across observations,
and the issue of biased parameter estimates as well as miss-specified
standard errors is consistently handled. Our research extends the
pre-vious literature in two important aspects: (1) we use a large
represen-tative sample of consumers of the EU28, and (2) the list of determinants
is very extensive and includes factors related to the attitudes of
re-spondents to seafood and socio-demographic characteristics. We
esti-mate the marginal effects of the different determinants to obtain the key
factors that are likely to increase the likelihood of consuming FAPs
away-from-home more frequently. The findings provide very important
insights that are especially relevant for restaurant owners and the rest of
the stakeholders of the supply chain in order to design and implement
commercial strategies that enhance the FAPs logistic value. In addition,
the results of the marginal effects may also be useful in drawing policy
lessons or in guiding the extent of future investigations for researchers
and authorities.
The rest of the paper presents the literature review and hypotheses
(section
2
), the data and methodology used for the analysis (section
3
),
the results (section
4
), the discussion (section
5
), and the conclusions
(section
6
).
2. Literature review and hypotheses
Higher demand for away-from-home food consumption in recent
decades, especially in developed countries, has been attributed to
different aspects, such as increased incomes (
Binkley, 2006
;
G¨al et al.,
2007
;
Ham et al., 2004
;
Ma et al., 2006
) and increased pursuit of
con-venience through time savings (
Binkley, 2006
;
G¨al et al., 2007
;
Mutlu &
Gracia, 2004
). Increased participation of women in the labour market
has also favoured a tendency to spend more on leisure activities (
Bink-ley, 2006
;
G¨al et al., 2007
;
Mutlu & Gracia, 2004
). In addition, the
growth in urbanization gives families greater access to restaurants that
facilitates away-from-home food consumption (
Ma et al., 2006
;
Mutlu &
Gracia, 2004
). According to
Rezende and Avelar (2012)
, a variety of
practices are related to the consumption of food away-from-home, such
as the consumption of food products in food-specialized establishments,
such as restaurants and snack bars, or in places where food is part of the
service offered, such as hotel and in-flight meals, as well as the
con-sumption of non-commercial substitutes, such as family meals.
There is a large number of studies assessing the consumption of fish
and seafood. In general, according to
Carlucci et al. (2015)
, the main
drivers for fish consumption are the sensory liking (taste, smell and
texture) of fish, perceived health benefits and fish-eating habits, while
the main barriers are the sensory disliking of fish, health risk concerns,
high price perception, lack of convenience, lack of availability of the
preferred products, and lack of knowledge in selecting and preparing the
product. Moreover,
Olsen (2004)
argues that the consumption of
sea-food varies considerably across individuals, families, cultures and
countries. In addition, the species consumed may be associated with
cultural traditions that are also changing over time (
Apostolidis &
Stergiou, 2012
).
The consumption of FAPs is usually studied in the literature by
analysing the choices of consumers or the frequency of consumption.
Regarding the determinants of the frequency of consumption of seafood
products, different quantitative approaches have been used according to
the literature reviewed (see
Appendix A
). The most common methods
used range from basic statistical analysis such as ANOVA or descriptive
analysis to multinomial regressions and more sophisticated methods
such as Probit and logit models.
The independent variables used for these models are usually related
to socioeconomic variables and factors related to consumer attitudes
towards seafood. As far as socioeconomic variables are concerned, the
studies consulted have shown that there are no absolute trends for this
type of attributes, as it depends on the characteristics of the sample
within the context of the study or aspects related to the products, such as
the species. However, the majority of the investigations indicate that
female (
Can et al., 2015
;
Cavaliere et al., 2019
;
Thong & Solgaard,
2017
), elderly people (
Herrmann et al., 1994
;
Murray et al., 2017
;
Myrland et al., 2000
;
Thong & Solgaard, 2017
), highly educated people
(
Can et al., 2015
;
Cavaliere et al., 2019
;
Islam et al., 2018
;
Myrland
et al., 2000
), people with higher incomes (
Can et al., 2015
;
Cavaliere
et al., 2019
;
Herrmann et al., 1994
;
Lee & Nam, 2019
;
Thong & Solgaard,
2017
;
Yousuf et al., 2019
) and living with a partner (
Cavaliere et al.,
2019
;
Kumar et al., 2008
;
Thong & Solgaard, 2017
), usually have a
higher frequency of consumption of different seafood products.
Moreover, other factors are related to the lifestyle of the respondent.
It has been found that consumers tend to consume seafood products
more frequently when: they are used to eat seafood products (
Yousuf
et al., 2019
); they frequently consumed seafood when they were young
(
Murray et al., 2017
); they engage in regular physical activity (
Myrland
et al., 2000
); and they engage in recreational fishing activities (
Herr-mann et al., 1994
).
As shown in
Table 3
(
Appendix A
), most of the studies analysed the
general frequency of consumption, and only a limited number carried
out separate analyses for home consumption or away-from-home
con-sumption, or both. This is an important point to consider given that some
studies have found that the main determinants of home and away-from-
home FAPs consumption differ (
Almeida et al., 2015
;
Herrmann et al.,
1994
). In addition,
Almeida et al. (2015)
concluded that the
self-reported frequency of consumption of seafood differs from the
fre-quency of consumption calculated as the sum of the frefre-quency of
con-sumption of seafood on different occasions (at-home or
away-from-home, at lunch or dinner), being the self-reported
fre-quency of consumption of around 3 times a week, while the estimated
consumption from summing up the various occasions is approximately 5
times a week. The difference might be due to the fact that the
re-spondents could be more accurate when their consumption response is
based on occasions, as it might be easier for them to take into account
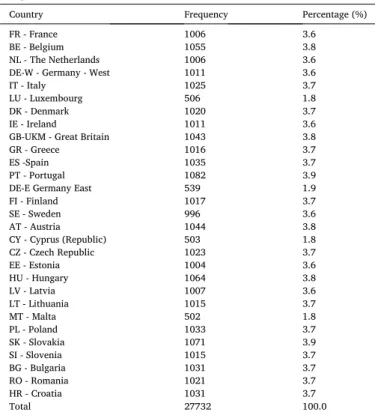
Table 1
Sample features.
Country Frequency Percentage (%)
FR - France 1006 3.6
BE - Belgium 1055 3.8
NL - The Netherlands 1006 3.6
DE-W - Germany - West 1011 3.6
IT - Italy 1025 3.7
LU - Luxembourg 506 1.8
DK - Denmark 1020 3.7
IE - Ireland 1011 3.6
GB-UKM - Great Britain 1043 3.8
GR - Greece 1016 3.7
ES -Spain 1035 3.7
PT - Portugal 1082 3.9
DE-E Germany East 539 1.9
FI - Finland 1017 3.7 SE - Sweden 996 3.6 AT - Austria 1044 3.8 CY - Cyprus (Republic) 503 1.8 CZ - Czech Republic 1023 3.7 EE - Estonia 1004 3.6 HU - Hungary 1064 3.8 LV - Latvia 1007 3.6 LT - Lithuania 1015 3.7 MT - Malta 502 1.8 PL - Poland 1033 3.7 SK - Slovakia 1071 3.9 SI - Slovenia 1015 3.7 BG - Bulgaria 1031 3.7 RO - Romania 1021 3.7 HR - Croatia 1031 3.7 Total 27732 100.0
the seafood consumed as a supplement, such as an intake included in a
sandwich, rather than just considering the seafood consumed as a main
meal dish. The authors, therefore, concluded that it would be better to
ask for more detailed information on consumption as the general answer
tends to underestimate the frequency of consumption.
Focusing now on the studies that have assessed the frequency of
away-from-home consumption separately,
Almeida et al. (2015)
found
that the frequency of at-home consumption was far higher than the
frequency of away-from-home consumption. The authors also found that
consumers with a higher knowledge of seafood (in terms of the amount
of information they know about the characteristics, the preparation and
the assessment of the quality of fish and other seafood) had a higher
frequency of consumption of seafood and were more interested in
in-formation on seafood products. In another study,
Hori et al. (2020)
found that eco-friendliness was a significant positive reason for the more
frequent consumption of seafood away-from-home, while freshness,
price, quality and taste and the expiry date were significant reasons for
not consuming seafood more frequently away-from-home. The country
of origin and food safety were not significantly linked to the frequency of
away-from-home consumption.
2.1. Attitudinal factors
Attitudinal factors present a general pattern of preference. Several
studies have shown that there is a higher frequency of consumption for
consumers who: prefer fresh products over other presentations
(
Almendarez-Hern´andez et al., 2017
;
Can et al., 2015
;
Kumar et al.,
2008
;
Yousuf et al., 2019
); have a positive attitude towards seafood
products (
Kumar et al., 2008
;
Lee & Nam, 2019
); care about eco-labels
and the environment (
Almendarez-Hern´andez et al., 2017
); care about
health issues of the products (
Can et al., 2015
;
Murray et al., 2017
;
Thong & Solgaard, 2017
); and consider important that the seafood
products have low calories and fat (
Thong & Solgaard, 2017
). On the
other hand, certain attitudes that favour a lower frequency of
con-sumption of seafood products are: being uncomfortable cooking or
preparing seafood (
Murray et al., 2017
;
Thong & Solgaard, 2017
); not
purchasing wild seafood (
Murray et al., 2017
); or finding the products
with higher prices (
Hall & Amberg, 2013
;
Lee & Nam, 2019
;
Thong &
Solgaard, 2017
). Based on the previous findings, we have proposed the
following first hypothesis:
H1. Attitudinal factors towards the characteristics of FAPs are important
determinants of the frequency of away-from-home consumption of FAPs.
2.2. Psychological factors
Other factors are related to life conditions and life satisfaction. For
general fish consumption,
Maciel et al. (2016
,
2019)
found that those
who consume fish often had a better perception of the quality of life and
were more physically active. They concluded that they were healthier
people. As a result, we can establish the following hypothesis:
H2. Psychological factors are relevant determinants of the frequency of
away-from-home consumption of FAPs.
2.3. Sociodemographic and economic factors
Sociodemographic and economic factors are also important
de-terminants of away-from-home consumption.
Baptista et al. (2020)
found that consumers who were born between 1961 and 1997, who have
Table 2
Definitions of the independent variables.
Variable Definition
Attitudes towards characteristics of the product 6 dummy variables regarding the main reasons for
buying or eating FAPs Healthy Taste good
Are products for special occasions
Contain little fat Easy to digest
Less expensive than other food
1 wild products preference dummy variable Wild products preference 1 sea products preference dummy variable Sea products preference 1 locals products preference dummy variable Preference for local and
national products Psychological factors related to life conditions and life satisfaction
4 dummy variables regarding life satisfaction Very satisfied Fairly satisfied Not very satisfied Not at all satisfied (BASE) 4 Dummy variables regarding the expectations of life
conditions in 5 years Better The same/no change Worse (BASE) NA Sociodemographic factors
29 country dummy variables FR - France BE - Belgium NL - The Netherlands DE-W - Germany - West IT - Italy
LU - Luxembourg DK - Denmark IE - Ireland
GB-UKM - Great Britain GR - Greece ES -Spain PT - Portugal DE-E Germany East FI - Finland SE - Sweden AT - Austria CY - Cyprus (Republic) CZ - Czech Republic EE - Estonia HU – Hungary (BASE) LV - Latvia LT - Lithuania MT - Malta PL - Poland SK - Slovakia SI - Slovenia BG - Bulgaria RO - Romania HR - Croatia 7 age generations dummy variables 15–24 years (BASE)
25–34 years 35–44 years 45–54 years 55–64 years 65–74 years 75 years and older 4 dummy variables according to household size Household size (1) (BASE)
Household size (2) Household size (3) Household size (4 or more) 3 dummy variables related to the place of living Rural area (BASE)
Towns and suburbs/small urban area
Cities/large urban area Economic factors
3 dummy variables related to difficulties in paying
the bills at the end of the month in the last year Most of the time (BASE) From time to time Almost never/never 6 dummy variables related to the class of society The working class (BASE)
The lower middle class The middle class
Table 2 (continued)
Variable Definition
The upper-middle class The higher class NA
high incomes, postgraduate education and families without children are
more likely to eat seafood products in restaurants than to eat them
at-home.
Herrmann et al. (1994)
found that consumers associated with
frequent purchases at restaurants are likely to be those with the highest
income, white-collar occupations, recreational fishing activities and
living in households with children aged 10 or under. They also
deter-mined that the attitudinal variables show less correlation with the
fre-quency of purchases at restaurants than with the frefre-quency of at-home
consumption. Based on the previous investigations, we have established
the following two hypotheses:
H3. There are differences in the frequency of away-from-home
consump-tion of FAPs depending on sociodemographic factors.
H4. There are differences in the frequency of away-from-home
consump-tion of FAPs depending on factors that are related to the economic status of
consumers.
3. Data and methodology
We used the Special Eurobarometer survey 2018 (
European Union,
2018a
) as the main dataset for our study. This dataset has already been
used by the study (
Cantillo et al., 2020
) as it has a lot of potentials to
analyse FAPs consumption issues in the EU due to its representativeness.
The survey includes a series of questions that analyse the internal market
of FAPs in the EU28 and was conducted at the request of the European
Commission between June and July 2018. The surveys were conducted
face to face in the 28 countries of the EU, using the native language of
the country of residence of the individuals. The final sample consisted of
27734 EU residents and the sample description can be found in
Table 1
,
including information on the number of respondents per country and the
frequency of the total sample.
In the present study, the frequency of away-from-home consumption
of FAPs is the dependent variable, while the independent variables are
associated with attitudes about the consumption of FAPs and
socio-demographic characteristics of the individuals. The Eurobarometer
survey addressed the frequency of away-from-home consumption of
FAPs with the following question: “How frequently do you eat fishery or
aquaculture products at restaurants and other food outlets (canteens,
bars, market stands etc.)?”. Respondents must choose only one of the
following options: “at least once a week”, “at least once a month but less
than once a week”, “several times a year but less than once a month”,
“less than once a year”, “never” and “don’t know”. Those who replied
with the “don’t know” option were insignificant and as a result, not
considered in the present investigation. According to the Eurobarometer
survey, in the EU, 11% of the respondents reported consuming FAPs
away-from-home at least once a week, 21% at least once a month but
less than once a week, 28% several times a year but less than once a
month, 14% less than once a year and 26% never (
European Union,
2018a
).
With regard to the independent variables, the attitudes towards the
reasons for buying or eating FAPs were measured in the Eurobarometer
survey by displaying a list of possible options that allowed respondents
to select up to three of them, while the preferences for certain product
attributes such as the method of harvesting (farmed vs wild), local
preference and sea-product preference were assessed through multiple
choice questions with a unique answer.
A description of the independent explanatory variables is provided in
Table 2
. Variables that were fixed to 0 for the estimation of the model are
accompanied by the word ‘base’ between brackets. The independent
variables were organized according to the following broad categories to
facilitate the description and discussion of the results:
•
Category 1: Attitudes towards characteristics of the product
•
Category 2: Psychological factors related to life conditions and life
satisfaction.
•
Category 3: Sociodemographic factors.
•
Category 4: Economic factors.
3.1. Methodology
The present investigation uses a heteroscedastic ordered probit
model to analyse the determinants of away-from-home consumption of
FAPs. The ordered probit model approach was selected considering that
the responses given by consumers regarding the frequency of away-
from-home consumption were ordinal (
Kumar et al., 2008
;
Thong &
Solgaard, 2017
). Probit models have been previously selected as an
approach to assess fish consumption behaviour in the investigations of
Almendarez-Hern´andez et al. (2017)
,
Kumar et al. (2008)
,
Lee and Nam
(2019)
,
Myrland et al. (2000)
,
Terin (2019)
and
Thong and Solgaard
(2017)
. We selected the form of a heteroscedastic model, which allows
the standard deviation of the error term to vary, offering more trustable
and less unbiased results than homoscedastic models.
The model has a utility function that relies on a latent dependent
variable Y
i, which depends on a linear combination of an independent
variable vector X
iand a vector parameter θ
i, and an error term
ε
ias
shown in equation
(1)
. The vector parameter is to be estimated, while
the error term allows obtaining unobserved factors of individual i.
Y
i=
∑
K k=1θ
iX
ik+
ε
i(1)
The dependent variable Y
ion Equation
(1)
cannot be observed but
can be measured by a set of y
iindicators representing the different levels
or categories of the frequency of away-from-home consumption, which
in our case consist of five different consumption levels (Equation 2).
From this equation, the threshold category parameters (μ
1, μ
2, μ
3, μ
4)
indicate the points of variation for the level of consumption given a high
change in the latent preference and are to be estimated taking into
ac-count that μ
1<
μ
2<
μ
3<
μ
4.
•
1st level – Never: y
i=
1 if Y
i≤
μ
1•
2nd level: Less than once a year: y
i=
2 if μ
1<
Y
i≤
μ
2•
3rd level: Several times a year but less than once a month: y
i=
3 if
μ
2<
Y
i≤
μ
3•
4th level: At least once a month but less than once a week: y
i=
4 if
μ
3<
Y
i≤
μ
4•
5th level: At least once a week: y
i=
5 if μ
4<
Y
i(2)
Moreover, the model assumes that the independent variables (which
explain the behaviour of the dependent variable) are a set of
socioeco-nomic characteristics of individuals as well as particular attitudes
to-wards FAPs. The selection criteria for the independent variables were
based on our expertise and the literature review (
Table 3
). We tried to
cover all the factors analysed in other studies, with the limitation that
the variables were included in the questions answered in the
Euro-barometer survey. The model allows estimating the probabilities for
each frequency of consumption level according to a variation in the
different attributes incorporated.
The heteroscedastic model allows the standard deviation of the error
term to vary according to the following equation: σ
i=
exp(δZ
i)
, where Z
iis a vector of variables that explain the level of variance and δ is a vector
of parameters to be estimated. The parameters are estimated by
max-imising the log-likelihood function.
Moreover, we estimated the marginal effects for the different
attri-butes, which indicate the change in the probability of away-from-home
consumption of FAPs for each level of consumption when there is a
change in the value of an independent variable.
Among the limitations of the use of traditional ordered probit
models, it should be clarified that these models do not account for
un-observed heterogeneity and therefore assume that the estimated
pa-rameters are considered to be fixed. However, the specification of a
simpler model that does not account for unobserved heterogeneity
fa-vours the interpretation of the results, which may be more meaningful
for policy analysis.
4. Results
Homoscedastic and heteroscedastic ordered probit models were
estimated (see
Appendix B
for full results). We also estimated the
mar-ginal effects on different away-from-home consumption patterns of
FAPs. In several cases, the results of the heteroscedastic model indicated
that the standard deviations of the factors were significant, suggesting
that assuming homoscedasticity could lead to biased results for some of
the coefficients of the parameters in the homoscedastic model. In
addition, the likelihood ratio test showed that the heteroscedastic model
was superior to the homoscedastic, thus the results of the investigation
will be based on the outcomes of this superior model.
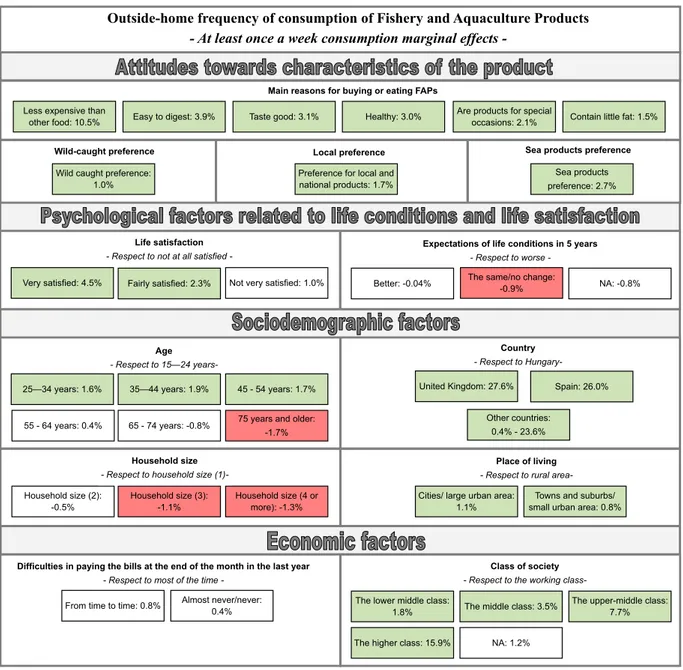
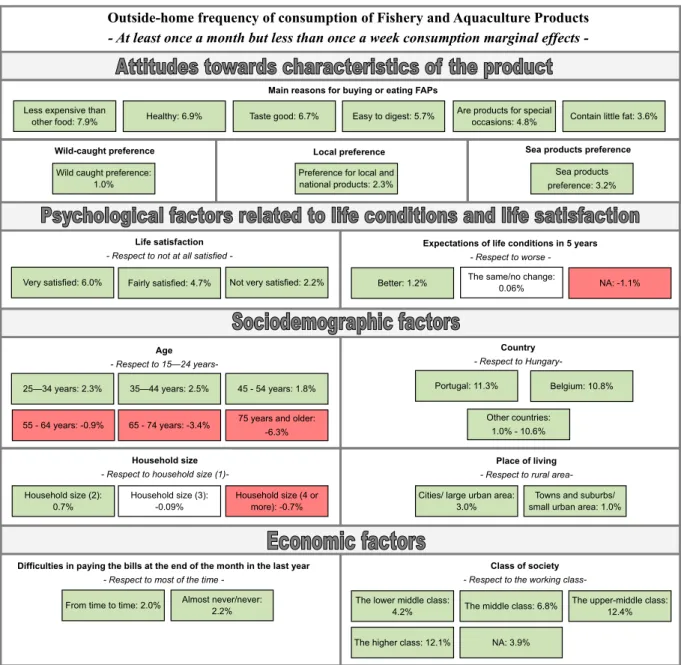
The marginal effects on the away-from-home consumption of FAPs at
least once a week are shown in
Fig. 1
, while those related to the
fre-quency of consumption at least once a month but less than once a week
are shown in
Fig. 2
. In these figures, the green colour elements are
significant drivers of the frequency of consumption, the red elements are
significant drawbacks, and the white elements are non-significant
fac-tors. The description of the results is organized according to the
cate-gories presented in the previous section.
4.1. Attitudes towards the main reasons to eat or buy FAPs
We confirmed that attitudes towards the main reasons for eating or
buying FAPs are important determinants of the frequency of away-from-
home consumption of FAPs. It was found that the attitude associated
with the highest probability to consume FAPs away-from-home more
frequently is to consider them as less expensive than other foods, while
other important attitudes that increase their consumption is to eat or buy
them because they are “easy to digest, healthy, taste good” are products
for special occasions or because they contain little fat.
Consumers who consider that one of the main reasons for consuming
FAPs is because they are less expensive than other foods, have a higher
probability of around 10.5% and 7.9% to consume them at least once a
week and at least once a month, respectively. For other reasons, the
probability ranges from 1.5% (contain little fat) to 3.9% (easy to digest)
for the level of consumption of at least once a week, and from 3.6%
(contains little fat) to 6.9% (healthy) for the level of consumption of at
least once a month but less than once a week.
Moreover, the preference for marine products over freshwater
products, local versus foreign products, and wild-caught versus farmed
products are significant drivers of higher consumption rates, for both at
least once a week and at least once a month levels of consumption.
Among these, the preference for marine products was the most
impor-tant aspect for both levels of consumption, increasing the likelihood of
consumption at least once a week by 2.7% and of at least once a month
by 3.2%.
4.2. Psychological factors related to life conditions and life satisfaction
Life satisfaction was also a positive driver of higher consumption
rates. In fact, those with the highest level of satisfaction had a higher
probability of 4.5% of consuming the products at least once a week and
of 6.0% of consuming the products at least once a month compared to
those individuals who were not at all satisfied with their lives. With
regard to life conditions expectations, it was found that those who
consider that their life conditions in five years would be the same have a
lower probability of around 0.9% of consuming the products at least
once a week, compared to those that are in the endpoints (worse or
better life conditions); however, those than consider that they will be
better, have a higher probability of 1.2% to consume the products at
least once a month but less than once a week than those that expect their
conditions to be worse.
4.3. Sociodemographic factors
The results show that the frequency of away-from-home
consump-tion of FAPs varies between countries, with British consumers having the
highest probability of consumption for the at least once a week level and
Portuguese consumers for the at least once a month but less than once a
week level.
Figs. 3 and 4
show the probabilities of eating FAPs at least
once a week and at least once a month away-from-home for the
coun-tries, respectively, indicating in general terms, that the residents of the
countries located on the western part of the EU28 tend to have a higher
probability of consuming FAPs away-from-home more frequently than
those located in countries on the eastern part of Europe.
According to the age, the results show that consumers between 25
and 54 years of age are more likely to consume FAPs away-from-home at
least once a week of around 1.6%–1.9%, compared to those between 15
and 24 years; while those over 75 years of age were less likely to
consume them at least once a week than the youngest group at around
1.7%. Similar results were found for the consumption level of a least
once a month but less than once a week, with residents between 25 and
54 years of age having a higher probability of 1.8%–2.5% to consume
FAPs away-from-home compared to the youngest generation, while
those older than 55 had a lower probability of consuming FAPs at least
once a month but less than once a week than the youngest generation
ranging from 0.9% to 6.3%.
Furthermore, the results show a tendency of a lower frequency of
away-from-home consumption of FAPs for larger household sizes, while
there is a higher frequency of consumption for residents living in cities,
towns and suburbs compared to those living in rural areas.
4.4. Economic factors
The class of society attribute showed the highest marginal effects and
indicated that those in the higher classes have a higher probability to
consume FAPS away-from-home more frequently, reaching up to 15.9%
for the higher class in the consumption level of at least once a week.
The variable related to the difficulty of paying bills at the end of the
month in the last year was not correlated to the frequency of
con-sumption of at least once a week, while for the frequency of
consump-tion of at least once a month, showed a higher frequency of consumpconsump-tion
for those with less or no difficulties, compared to those with difficulties
most of the time.
5. Discussion
5.1. The impact of generational differences on away-from-home fish
consumption
We found that consumers between 25 and 54 years of age (born
between 1964 and 1993) are more likely to consume FAPs away-from-
home. Similar results have been found by
Baptista et al. (2020)
in
Brazil, who have determined that consumers born between 1961 and
1997 are more likely to eat seafood products in restaurants than to eat
them at-home. This can be explained by the fact that this group is the
largest active labour force, which means that they generally have higher
incomes, allowing them to spend more money on leisure activities such
as eating at restaurants or food outlets. In addition, since this group also
tends to have the busiest schedules, it may be more convenient for them
to save time by avoiding cooking at home more regularly.
Meanwhile, those over 75 years of age had the lowest probability of
consuming FAPs away-from-home more frequently. This may be due to a
number of reasons, such as the preference and availability of more time
to cook their own meals, as this group of people usually do not work; and
it may also be related to dietary restrictions that make it difficult for
them to find suitable products that could be consumed away-from-
home. In view of this, the strategy that can be implemented is to
high-light the importance of the nutritional and health benefits that FAPs can
offer.
5.2. Away-from-home fish consumption: a luxury meal or an affordable
food choice?
In our results, the largest marginal effects were related to the social
class of the residents, indicating that there is a higher frequency of away-
from-home consumption of FAPs for high-class residents. Similar results
were found in the investigations of
Baptista et al. (2020)
and
Herrmann
et al. (1994)
. Both studies found a higher frequency of restaurant
pur-chases of seafood products for consumers with higher incomes. This
finding and the fact that those who consider that “FAPs are products for
special occasions” are more likely to consume these products more
frequently, suggest that seafood could probably be perceived as a luxury
food to be eaten away-from-home. However, our findings also indicated
that the most important attitude that contributes to consuming more
frequently away-from-home FAPs was to consider them to be less
expensive than other foods.
This apparent contradiction can be explained considering different
aspects. First, it is important to point out that those higher-income
consumers usually eat more often in restaurants, regardless of the
product they consume, so the higher frequency of consumption for this
group may be the result of a higher presence in restaurants. For this
reason, it is important that future studies compare the actual propensity
of people with higher incomes to choose fish instead of other food
products at restaurants. Some investigations have already shown that
affluent consumers usually consume more frequently fish than meat
products (
Cavaliere et al., 2019
;
Islam et al., 2018
), but the results
cannot be generalized to the away-from-home context.
It is also important to consider that there is a wide range of prices
that can be found in the European restaurants and food outlets,
depending on the type of fishery and aquaculture product consumed and
the type of restaurant. Products can therefore be cheaper than other
foods if cheap species (such as hake, cod, pangasius and tilapia) are
considered in affordable restaurants compared to other protein sources,
but at the same time products can be considered as luxury if species such
as lobster, salmon, bluefin tuna or caviar are consumed in places
specialized in high-income segments. In addition, given the
heteroge-neity of the sample, the discrepancies may be due to different cultural
and social factors regarding the status of fish in each country.
5.3. The role of health on away-from-home fish consumption
Other important reasons that increase the frequency of away-from-
home consumption of FAPs are to eat or buy them because they are
easy to digest, healthy or low-fat products. These attitudes evidence that
consumers attach great importance to the health and nutritional benefits
of FAPs. This is not surprising given the high recognition of seafood
products as healthy and nutritious for benefits such as high content of
Omega 3 and low-fat content (
Birch & Lawley, 2012
;
Verbeke, Vermeir,
&
Brunsø, 2007
). Other important nutrients found in FAPs include
vi-tamins A and D3, digestible proteins, and minerals such as iodine and
selenium (
Ramalho Ribeiro et al., 2019
).
5.4. The role of products attributes on away-from-home fish consumption
In addition, the findings indicate a higher frequency of away-from-
home consumption of FAPs for consumers who prefer wild-caught to
farmed products, local to foreign products and sea to freshwater
prod-ucts. Consumers may obtain indirect information on the harvest method
and the origin of the FAPs when they eat in restaurants located near a
water body (beach or river) and expect that the products are fresh and
wild. For example, consumers may choose restaurants located near a
beach or a marine, expecting that their products wild, local and recently
caught, because of their proximity to that water source. In this sense, a
sort of endogeneity issue might be present in a way that these locations
could be indirectly favouring these specific fish attributes in consumers’
preferences. The fact that there is a higher frequency of consumption for
those who prefer wild-caught products is consistent with many
in-vestigations in the literature, in which consumers describe farmed
products as being of lower quality and less healthy when compared to
wild-caught (
Claret et al., 2014
;
Verbeke, Sioen, et al., 2007
). Thus, this
finding reaffirms that aquaculture producers, authorities and promoters
should continue to work on planned programs to change the negative
image that aquaculture products currently have (
Bronnmann &
Hoff-mann, 2018
). Moreover, the fact that those who prefer local products
have a higher frequency of away-from-home consumption was expected,
given that many investigations have found similar results, for reasons
such as greater trust in local products or the ethnocentrism of consumers
(
Luomala, 2007
;
Verlegh & Steenkamp, 1999
) or even because of health
and food safety issues (
Hinkes & Schulze-Ehlers, 2018
). Also, the higher
frequency of away-from-home consumption of FAPs for those who
prefer sea products to freshwater products, indicates that freshwater
producers must encourage trust in their products by promoting the
quality of their products through marketing campaigns.
5.5. Consumers’ psychological factors and their relationship with the
away-from-home consumption
According to our results, favourable psychological attitudes such as
optimism and positiveness in life satisfaction and future living
condi-tions, contribute to increased away-from-home consumption of FAPs.
This can be explained considering that, probably due to their current
and future good living conditions, consumers are willing to spend more
money on eating food away from home on a more frequent basis. Similar
results were found in the investigations of
Maciel et al. (2016
,
2019)
who determined that those who consume fish regularly had a better
quality of life perception and were more physically active. However, the
literature is very scarce on the relationship between FAPs consumption
and quality of life, as only the two studies mentioned assess this issue,
and they refer to fish consumption in general, and not particularly to the
away-from-home consumption.
5.6. Home vs away-from-home consumption
In a similar study, using the same Eurobarometer survey but focusing
on at-home consumption,
Cantillo et al. (2021)
found similar trends in
some of the variables, as well as opposite results in others. With regard
to similarities, it was found that consumers who prefer wild-caught
products, who are very satisfied with their lives, who are part of the
higher classes of society and never or rarely have any difficulty paying
bills, have a higher frequency of at-home consumption of FAPs. In
addition, there is a similar trend towards higher consumption of FAPs at
home and away from home for countries located on the western side of
Europe. Similarly, as in the present study,
Cantillo et al. (2021)
found
that selecting as important any of the reasons listed for eating or buying
the products would result in a higher probability of consuming FAPs
more frequently, except for the reason “are products for special
sions”, which suggest that FAPs are usually consumed at special
occa-sions that are celebrated away-from-home, rather than at those
celebrated at-home, in which they probably preferred other food
op-tions. With respect to the opposite results,
Cantillo et al. (2021)
found
that consumers over 55 years of age tend to eat FAPs more frequently
at-home, which implies that the generational effect is a relevant factor in
distinguishing between groups consuming more at-home or
away-from-home. It seems evident that the generational effect might
depend on the health and cultural reasons. Older consumers usually
have more dietary restrictions that restrict them from getting
appro-priate seafood at restaurants and food outlets, while they can cook the
products the way they need at-home. Moreover, the fact that older
people were born is a less globalized world, in which at-home
con-sumption was more frequent when they were younger, could also have
an impact on their preference to consume more these products at-home.
Furthermore, the results of
Cantillo et al. (2021)
also differed from the
current study with respect to the place of living. They found that those
living in cities and large urban areas have a lower frequency of at-home
consumption of FAPs. This might be in part explained because
con-sumers living in these areas have better access to restaurants and food
outlets, and as a result, they consume FAPs more frequently
away-from-home. Similarly, the results for those who live in rural areas
can be explained analogously. Finally, another interesting difference to
highlight is related to the household size, as
Cantillo et al. (2021)
found
that those living in households with 3 or more people tend to consume
FAPs at-home more often, suggesting that FAPs are more regarded as a
family meal when eating at home, while in restaurants and food outlets,
they are more popular with couples and single consumers.
6. Conclusions
The findings of this investigation present very important and useful
insights for restaurant owners and the rest of the stakeholders of the
supply chain who obviously could benefit from an increase in the
fre-quency of away-from-home consumption of FAPs. The information can
be used to enhance the marketing campaigns of the products and to look
for better strategies that increase the consumption of the products in the
EU. In addition, we highlight that the use of a proper representative
sample increases the strength and reliability of the results.
We have proved the four hypotheses formulated. For the first
hy-pothesis, we found that certain attitudes that increase the frequency of
consumption of FAPs are to consider important the following reasons to
buy or eat them: less expensive than other foods, easy to digest, healthy,
tasty, low-fat and for special occasions. Also, we found that consumers
who prefer wild, local and marine products consume FAPs away-from-
home more frequently, which could be an indirect consequence of
choosing a restaurant near a water body, as they expect certain fish
characteristics based on the selected location. For the second hypothesis,
we found that those who are more satisfied with life and optimistic
about future living conditions have a higher probability to consume
FAPs more frequently away-from-home. With regard to the third and
fourth hypotheses, we determined that consumers between 25 and 54
years of age, who live in smaller households not located in rural areas,
belonging to the higher class of society and who have fewer financial
difficulties are more likely to consume FAPs away-from-home.
The main limitation of this study is that it is based on a survey that is
not specific to the consumption of seafood away-from-home but the
consumption of seafood in general. As a result, there may be some lack of
precision in the results to represent reality, particularly in the attitudes
towards the main reasons for the consumption of seafood, as the
valu-ation and preference for attitudes may vary in the differentivalu-ation
between home and away-from-home consumption. Additionally,
another limitation is that the attitudes assessed in the current study
describe only beneficial attributes of fish, and therefore those who eat
fish will probably find FAPs in a more positive way. The results of this
investigation are therefore limited and restricted to the available data,
which is a good starting point but requires improvement for more
relevant and accurate results. Future research should consider the design
of a specific survey, in which the respondents are advised that all the
issues addressed fall within the context of away-from-home
consumption.
Future studies should focus on similar analyses for particular species
in order to obtain clearer results, especially those species that are
important for away-from-home consumption should be further
ana-lysed. Also, separate analyses are required for fish species and other
categories of seafood. Furthermore, it may be relevant to consider the
spatial locations of the respondents, to know whether the low away-
from-home consumption of FAPs may be due to a lack of specialized
seafood restaurants in the area, rather than to consumer preferences.
Moreover, future research should also include the spatial location of the
consumer, as one possible important driver is how close the consumer
lives from a sea coast or a lake.
Author contributions
All of the authors contributed significantly to the research. The
contributions according to the CRediT taxonomy are:
Javier Cantillo: conceptualization, methodology, modelling,
anal-ysis, writing—original draft; Juan Carlos Martin: conceptualization,
methodology, analysis, writing—review and editing, validation,
super-vision; Concepci´on Rom´an: conceptualization, methodology, analysis,
writing—review and editing, validation, supervision.
Ethical review
Not applicable.
Funding
This work is part of a project that has received funding from the
European Union’s Horizon 2020 research and innovation programme
under the Marie Skłodowska-Curie grant agreement No. 766347.
Declaration of interest
The authors declare no conflict of interest. The funders had no role in
the design of the study; in the collection, analyses, or interpretation of
data; in the writing of the manuscript, or in the decision to publish the
results.
Data availability statement
The data can be publicly accessed at
https://doi.org/10.4232/1.13
212
.
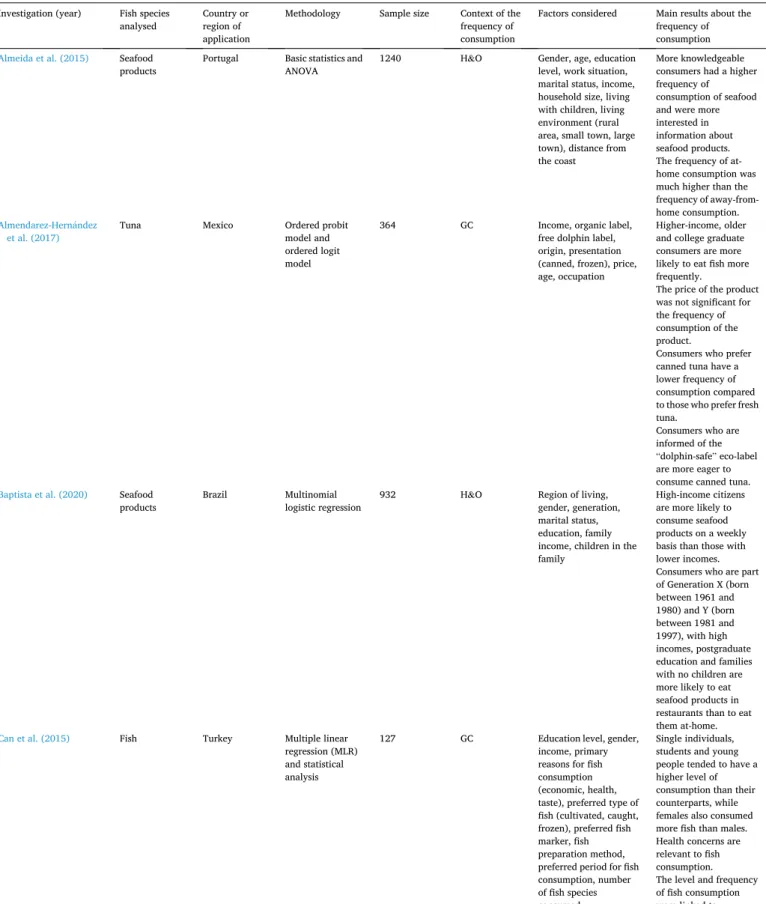
Appendix A. Literature review
Table 3
presents a review of the main studies which analyse the frequency of consumption of seafood products using a quantitative approach. The
table includes the authors, the year of publication, the species analysed, the country or region of application, the methodology, the size of the sample,
the context in which the frequency of consumption is studied (general, at-home or away-from-home), the factors considered and the main results.
Appendix B. Homoscedastic and Heteroscedastic ordered probit models
Table 4
presents the complete results of the homoscedastic and heteroscedastic ordered probit models. The values that are in bold letters have a
minimum level of significance of 0.05, while those in italics have a minimum level of significance of 0.1.
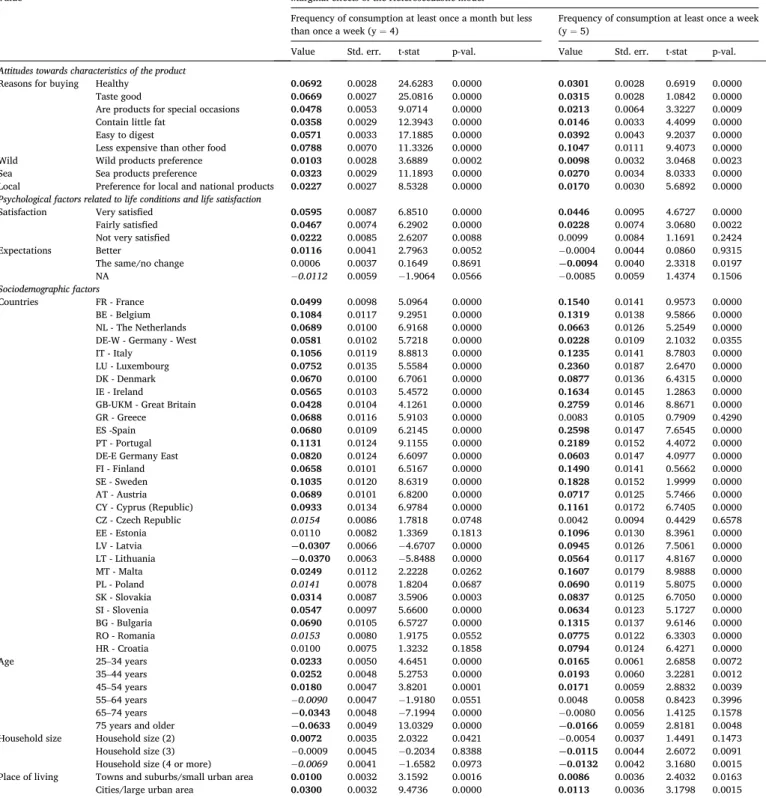
Table 5
presents the results of the marginal effects of the heteroscedastic model on the frequency of consumption at least once a month but less than
once a week (y = 4) and at least once a week (y = 5).
Table 3
Investigations that analyse the frequency of consumption using a quantitative approach. Investigation (year) Fish species
analysed Country or region of application
Methodology Sample size Context of the frequency of consumption
Factors considered Main results about the frequency of consumption
Almeida et al. (2015) Seafood
products Portugal Basic statistics and ANOVA 1240 H&O Gender, age, education level, work situation, marital status, income, household size, living with children, living environment (rural area, small town, large town), distance from the coast
More knowledgeable consumers had a higher frequency of consumption of seafood and were more interested in information about seafood products. The frequency of at- home consumption was much higher than the frequency of away-from- home consumption.
Almendarez-Hern´andez
et al. (2017) Tuna Mexico Ordered probit model and
ordered logit model
364 GC Income, organic label, free dolphin label, origin, presentation (canned, frozen), price, age, occupation
Higher-income, older and college graduate consumers are more likely to eat fish more frequently.
The price of the product was not significant for the frequency of consumption of the product.
Consumers who prefer canned tuna have a lower frequency of consumption compared to those who prefer fresh tuna.
Consumers who are informed of the “dolphin-safe” eco-label are more eager to consume canned tuna.
Baptista et al. (2020) Seafood
products Brazil Multinomial logistic regression 932 H&O Region of living, gender, generation, marital status, education, family income, children in the family
High-income citizens are more likely to consume seafood products on a weekly basis than those with lower incomes. Consumers who are part of Generation X (born between 1961 and 1980) and Y (born between 1981 and 1997), with high incomes, postgraduate education and families with no children are more likely to eat seafood products in restaurants than to eat them at-home.
Can et al. (2015) Fish Turkey Multiple linear
regression (MLR) and statistical analysis
127 GC Education level, gender, income, primary reasons for fish consumption (economic, health, taste), preferred type of fish (cultivated, caught, frozen), preferred fish marker, fish preparation method, preferred period for fish consumption, number of fish species consumed
Single individuals, students and young people tended to have a higher level of consumption than their counterparts, while females also consumed more fish than males. Health concerns are relevant to fish consumption. The level and frequency of fish consumption were linked to education, total meat
Table 3 (continued)
Investigation (year) Fish species
analysed Country or region of application
Methodology Sample size Context of the frequency of consumption
Factors considered Main results about the frequency of consumption consumption and income, while the total number of fish species consumed by consumers and their age are significant predictors of fish consumption. Fresh fish is preferred over processed fish
Cavaliere et al. (2019) Different food
categories, including one for fish
Italy Ordinary Least Squares (OLS) regression
36032 GC Education, income, age, gender, household size, marital status
Both socio-economic and demographic factors have an impact on the frequency of fish consumption. Individuals with higher education, higher incomes, young, female, and living with a partner are more likely to consume fish more often.
Hall and Amberg (2013) Farmed species
grouped in uncommon species, common species, and farmed bivalves
US Factor analysis 1159 GC Education, age, income,
gender, price, seafood health beliefs, aquaculture problems, aquaculture benefits, wild quality, familiarity, fish concerns, freshness, positive media recall, negative media recall
Price, freshness, and familiarity were the most important factors in the choice of seafood, but they did not predict the consumption of specific classes of farmed species or the overall preference for wild fish rather than farmed products. Beliefs about the benefits of aquaculture were positively linked to increased consumption of aquaculture products, but beliefs about environmental and health-related aquaculture problems did not predict specific choices for
consumption. The socio-demographic factors have little or no relation to the consumption of all species.
In the case of common fish, education was positively linked to the frequency of consumption of these species.
Hermida and Costa
(2020) Fish and seafood
products Madeira and Porto Santo islands (Portugal) Generalized linear
models (GLM) 465 GC Age, gender, education level, job, area of residence, job, likes the fish taste, healthy eating, fishing activity
The most important preference and lifestyle factor determining the frequency of consumption of fish and seafood was the taste of fish followed by the activity of fishing. Healthy eating, on the other hand, had no impact on the frequency of consumption. Age had a negative effect on the consumption of seafood (including octopus, shrimp, and limpets additionally from fish)
Table 3 (continued)
Investigation (year) Fish species
analysed Country or region of application
Methodology Sample size Context of the frequency of consumption
Factors considered Main results about the frequency of consumption but not on the consumption of fish. Women were more likely to consume both fish and seafood products more frequently. People employed in basic occupations, professionals and technicians had a high level of consumption of fish and seafood, while people outside the workforce had the lowest levels of consumption.
Herrmann et al. (1994) Finfish and
shellfish US Logistic regression model and cluster analysis.
1200 H&O Age, race of the respondent, presence of young children, residence of the respondent, occupation, annual household income, region, recreation fishing by family members, perception variables for fish (readily available, inexpensive compared to other meat, high quality, attractive appearance and packaging, undesirable fish odour, delicate flavour, nutritional value, easy to prepare at-home, has few bones)
Seafood purchases depend on attitudes towards fish, especially on the frequency of purchases at-home. The main drivers of home purchases were white-collar occupation, older age, urban/ suburban residence, New England location and recreational fishing participation. Consumers associated with frequent restaurant purchases are likely to be those with the highest income, white- collar occupations, recreational fishing activities and living in households with children aged 10 or under.
Attitudinal variables show less correlation with the frequency of purchases at a restaurant than with the frequency of eating at- home.
Higuchi et al. (2017) Fish Peru Probit model 159 GC Price, age, number of
children, family members, education, district, gender. In predicting the frequency of fish consumption, socio- economic factors have little explanatory power.
Hori et al. (2020) Seafood
products Japan Multiple regression analysis
6000 H&O Reasons (quality and taste, freshness, expiration date, country of origin, food safety, price, eco-friendliness)
In terms of the frequency of consumption of seafood at-home, quality and taste, freshness, country of origin, eco- friendliness and food safety were significant positive reasons for more frequent consumption of seafood, while the price was a negative reason. The expiry date was not significantly related to the frequency of at- home consumption. As regards the frequency of consumption of seafood away-from- home, eco-friendliness
Table 3 (continued)
Investigation (year) Fish species
analysed Country or region of application
Methodology Sample size Context of the frequency of consumption
Factors considered Main results about the frequency of consumption has been a significant positive reason for the more frequent consumption of seafood, while freshness, price, quality and taste and the expiry date have been significant reasons for not consuming seafood more frequently. The country of origin and food safety were not significantly linked to the frequency of away- from-home consumption.
Islam et al. (2018) Different food
categories, including one for fish
Bangladesh Frequency distribution, factor, and cluster analysis
676 GC Gender, age, marital
status, family size, education, occupation, religion social class, place of living, price preferences (low, high, medium), preference parameters (my family involved in cooking and preparing the meal, quality food with the lowest price, organic food, likeness of shopping food for the family, fresh food, food without preservatives, food nutrition is more important than taste, likeness to go to restaurants, preference to keep fish in the meal, fish over meat, likeness to cook new recipes, likeness to buy new food items)
Fish was mostly consumed by groups related to restaurant consumers and those characterized by a high level of awareness of the quality and price ratio and freshness of food and a high level of concern for the food and cuisine of other family members.
The average
consumption of fish was higher for men, the upper-middle and upper social classes, living in households with fewer family members, and secondary and higher education levels.
Kumar et al. (2008) Farm-raised
catfish US Ordered probit model 1194 GC Form of purchase, method of preparation, method of serving (main, side dish), place of purchase, freshness, expiration date, origin of the product, USDA labelling, price, packaging preferences, opinion of catfish, ethnicity, marital status, age, household size
Fresh catfish buyers, married couples, Caucasians, and African Americans were more likely to buy catfish more frequently. Also, the positive opinions of catfish, origin labels and vacuum-sealed packaging have had a positive and significant impact on the frequency of purchases.
Lee and Nam (2019) Live fish South Korea Ordered probit
model 766 GC Residential area, occupation of the respondents, marital status of the respondent, number of family members, household income, preference for live fish, favourable fish species (black rockfish and red seabream), importance of the price, importance of wild-caught products, satisfaction for the safety of live fish.
Respondents with low- priced demand elasticity are likely to consume live fish more frequently.
Although the preference for wild-caught fish is relevant to the consumer’s choice, it is insignificant for their frequency of consumption. Consumers with higher consumption frequencies usually consider safety to be more relevant than price.
Murray et al. (2017) Seafood
products Canada Mixed methods approach 315 GC Important factors when buying seafood (taste, There was a significant but small correlation (continued on next page)
Table 3 (continued)
Investigation (year) Fish species
analysed Country or region of application
Methodology Sample size Context of the frequency of consumption
Factors considered Main results about the frequency of consumption (qualitative semi- structured interviews and quantitative survey); Spearman’s correlation
smell and appearance, cultural or religious reasons, wild vs farmed, health benefits and nutritional value, uncomfortable cooking or preparing seafood, price, origin of the product, sustainability of the species, health risks)
between childhood and adult consumption frequencies. Age was positively correlated with the frequency of adult purchases, while income and gender were not the same.
Adult purchase frequency has been positively affected by consumers who have purchased seafood due to its health benefits and nutritional value. The most important factors affecting the decision to purchase seafood were those related to sensory qualities (taste, smell, and appearance). The second most important factor was the price, while other important factors were the distinction between farmed and wild and the origin of seafood and the health benefits.
Myrland et al. (2000) Three major
seafood categories (fat, lean and processed seafood) Norway Maximum likelihood probit models and ordered probit models 4014 (Only Norwegian women from 30 to 44 years involved in a medical study) GC Age, education, household size, kids in the household, income, region of location, rating level of physical activity, wine consumption, reasons why not to eat more fish (price, too few choices, supply varies too much, quality varies, shortage on prepared dishes, smell during preparation, difficult to prepare, taste, family do not like fish), consumption of other meats and dishes, preference for seafood.
Product attributes are perceived as more important barriers to consumption than price beliefs.
The presence and location of school-aged children are relevant factors for the type of seafood consumed, while overall consumption is increased when people are older, have higher education or have a larger household size. Income does not appear to have a direct role to play in the frequency of consumption of seafood. The relationship between the lifestyle and the consumption of fish was assessed on the basis of the level of physical activity and the consumption of wine, the first being a direct relationship to the consumption of fat and lean seafood dishes, probably because they are perceived as healthy dishes; although it could not be possible to attribute a role to wine consumption.
Terin (2019) Fish Turkey Ordered logit
model 260 GC Income, child number, household head, gender, wife of the house working, other seafood consumption, residence in a rental
Households with higher incomes and a higher number of children, where the householder works and consumes seafood products other