HAL Id: hal-00328262
https://hal.archives-ouvertes.fr/hal-00328262
Submitted on 10 Oct 2008HAL is a multi-disciplinary open access
archive for the deposit and dissemination of sci-entific research documents, whether they are pub-lished or not. The documents may come from teaching and research institutions in France or abroad, or from public or private research centers.
L’archive ouverte pluridisciplinaire HAL, est destinée au dépôt et à la diffusion de documents scientifiques de niveau recherche, publiés ou non, émanant des établissements d’enseignement et de recherche français ou étrangers, des laboratoires publics ou privés.
The influence of natural and anthropogenic secondary
sources on the glyoxal global distribution
S. Myriokefalitakis, M. Vrekoussis, K. Tsigaridis, F. Wittrock, A. Richter, C.
Brühl, R. Volkamer, J. P. Burrows, M. Kanakidou
To cite this version:
S. Myriokefalitakis, M. Vrekoussis, K. Tsigaridis, F. Wittrock, A. Richter, et al.. The influence of nat-ural and anthropogenic secondary sources on the glyoxal global distribution. Atmospheric Chemistry and Physics Discussions, European Geosciences Union, 2008, 8 (1), pp.1673-1708. �hal-00328262�
ACPD
8, 1673–1708, 2008 Secondary sources and distribution of glyoxal S. Myriokefalitakis et al. Title Page Abstract Introduction Conclusions References Tables Figures ◭ ◮ ◭ ◮ Back CloseFull Screen / Esc
Printer-friendly Version
Interactive Discussion
Atmos. Chem. Phys. Discuss., 8, 1673–1708, 2008 www.atmos-chem-phys-discuss.net/8/1673/2008/ © Author(s) 2008. This work is licensed
under a Creative Commons License.
Atmospheric Chemistry and Physics Discussions
The influence of natural and
anthropogenic secondary sources on the
glyoxal global distribution
S. Myriokefalitakis1, M. Vrekoussis2, K. Tsigaridis3, F. Wittrock2, A. Richter2, C. Br ¨uhl4, R. Volkamer5, J. P. Burrows2, and M. Kanakidou1
1
Environmental Chemical Processes Laboratory, Department of Chemistry, University of Crete, Voutes Campus, P.O. Box 2208, 71003 Heraklion, Greece
2
Institute of Environmental Physics and Remote Sensing, IUP, University of Bremen, Germany 3
Laboratoire des Sciences du Climat et de l’Environnement (LSCE), CNRS-CEA, 91191 Gif-sur-Yvette, France
4
Max Planck Institute, Atmospheric Chemistry Division, Mainz, Germany 5
Department of Chemistry and Biochemistry, University of Colorado, Boulder, Colorado, USA Received: 4 December 2007 – Accepted: 16 December 2007 – Published: 31 January 2008 Correspondence to: M. Kanakidou (mariak@chemistry.uoc.gr)
ACPD
8, 1673–1708, 2008 Secondary sources and distribution of glyoxal S. Myriokefalitakis et al. Title Page Abstract Introduction Conclusions References Tables Figures ◭ ◮ ◭ ◮ Back CloseFull Screen / Esc
Printer-friendly Version
Interactive Discussion
EGU
Abstract
Glyoxal, the smallest dicarbonyl, which has recently been observed from space, is ex-pected to provide indications on VOC oxidation and secondary aerosol formation in the troposphere. Glyoxal is known to be mostly of natural origin and is produced during bio-genic VOC oxidation. However, a number of anthropobio-genically emitted hydrocarbons,
5
like acetylene and aromatics, have been positively identified as glyoxal precursors. The present study investigates the contribution of pollution emissions to the glyoxal levels by taking into account only the secondary chemical formation of glyoxal from precursors emitted from biogenic, anthropogenic and biomass burning sources. For this purpose, a global 3-dimensional chemistry transport model of the troposphere (TM4) able to
10
simulate the gas phase chemistry coupled with all major aerosol components is used. The model results are compared with satellite observations of glyoxal columns over hot spot areas. According to TM4 model results, the anthropogenic contribution to the glyoxal columns is found to reach 70% in the industrialized areas of the northern hemisphere and up to 20% in the tropics. It is on average three times larger than the
15
secondary production of glyoxal from biomass burning sources. The chemical produc-tion of glyoxal is calculated to equal about 56 Tg y−1with 70% produced from biogenic hydrocarbons oxidation, 17% from acetylene, 11% from aromatic chemistry, and 2% from ethene and propene. Glyoxal is destroyed by reactions mainly with OH radicals (22%) and by photolysis (65%), but it is also removed from the atmosphere through wet
20
(11%) and dry deposition (6%). Secondary organic aerosol potential formation through glyoxal losses on/in aerosols and clouds was neglected here due to the significant un-certainties associated with the underlying chemistry. The global annual mean glyoxal burden and lifetime in the model domain are estimated at 0.02 Tg and 3 h, respectively.
ACPD
8, 1673–1708, 2008 Secondary sources and distribution of glyoxal S. Myriokefalitakis et al. Title Page Abstract Introduction Conclusions References Tables Figures ◭ ◮ ◭ ◮ Back CloseFull Screen / Esc
Printer-friendly Version
Interactive Discussion 1 Introduction
In the presence of nitrogen oxides (NOx), the photochemical degradation of volatile organic compounds (VOCs) leads to secondary gaseous and particulate products, like ozone (O3) and secondary organic aerosols (SOA) that are important contributors to the ‘photochemical smog’ (Poisson et al., 2000; Kanakidou et al., 2005). Air pollution
5
has severe negative effects on human health (Evans et al., 2002; Pope and Dock-ery, 2006), ecosystem (Gregg et al., 2003) and regional climate (Ramanathan and Crutzen, 2003). The improvement of air quality in urban areas requires a detailed sur-vey of pollutants like VOCs. Due to the large number of VOC compounds and their complex chemical degradation in the troposphere, significant effort is being put into
10
the assignment of indicators of VOC chemistry that are relatively small molecules, like formaldehyde (HCHO). These gases are affected by both anthropogenic and natural emissions and can be measured in the troposphere.
Recent studies have shown that glyoxal (CHOCHO), the simplest alpha dicarbonyl organic compound, is one of the most prevalent dicarbonyls in the atmosphere. Glyoxal
15
has primary sources from biofuel burning (Hays et al., 2002) and vehicle emissions (Kean et al., 2001; Grosjean et al., 2001) that are highly uncertain due to the large variability of emission factors and the scarcity of the available observations. During burning of biofuels, glyoxal emission rates 3 to 5 times higher than those of formalde-hyde have been reported (Hays et al., 2002). During the MCMA-2003 campaign in
20
Mexico City, highly time-resolved direct glyoxal observations showed no accumulation of glyoxal during rush-hour, but a fast rise in glyoxal concentrations after the onset of photochemical activity, indicating that ambient glyoxal is dominated by VOC photo-chemical sources. It was concluded that glyoxal is a suitable indicator molecule for VOC oxidation processes (Volkamer et al., 2005b).
25
Glyoxal is produced via the oxidation of numerous hydrocarbons (Calvert et al., 2000, 2002) that are emitted from anthropogenic, biogenic and biomass burning sources. It is a first generation product of acetylene oxidation by OH and is produced from the
ACPD
8, 1673–1708, 2008 Secondary sources and distribution of glyoxal S. Myriokefalitakis et al. Title Page Abstract Introduction Conclusions References Tables Figures ◭ ◮ ◭ ◮ Back CloseFull Screen / Esc
Printer-friendly Version
Interactive Discussion
EGU oxidation of a number of other unsaturated VOCs by O3 and OH, including ethene
and isoprene (for a compilation of glyoxal precursor VOCs see Volkamer et al., 2005a and Volkamer et al., 2007). Glyoxal has been identified as first generation product of the aromatic ring-opening routes during the hydroxyl (OH) radical initiated oxidation of aromatic hydrocarbon (Volkamer et al., 2001). The secondary production of glyoxal
5
from the atmospheric degradation of furanones, unsaturated γ-dicarbonyls and phe-nols has been observed to be negligible (Volkamer et al., 2001; Bloss et al., 2005). The glyoxal formation from isoprene, globally the largest source for secondary glyoxal, mostly proceeds via the further oxidation of the intermediates like glycolaldehyde and hydroxyacetone (Saunders et al., 2003).
10
Glyoxal has also been detected in atmospheric aerosols (Kawamura et al., 1996; Matsunaga et al., 2003; Liggio and McLaren, 2003; Garcia-Alonso et al., 2006). It was suggested that glyoxal is strongly involved in the formation of SOA in the troposphere by participating in heterogeneous reactions that form organic sulfate compounds (Lig-gio et al., 2005a). Glyoxal is more reactive with respect to hydration, polymerization
15
and acetal/hemiacetal formation in the presence of alcohols than most other aldehy-des (Jang and Kammens, 2001). Based on kinetic studies by Liggio et al. (2005b), the amount of SOA potentially formed by glyoxal could be large enough to account for a significant part of the missing SOA in the low and free troposphere currently not reproduced by models (Heald et al., 2005; Volkamer et al., 2006a). Laboratory
20
measurements consistently find evidence for SOA formation from glyoxal (Liggio et al., 2005a, b; Kroll et al., 2005) but are inconclusive as to the atmospheric relevance as a SOA source. Recent first field evidence of a missing glyoxal sink is consistent with the upper values of SOA formation from glyoxal (Volkamer et al., 2007) and suggests the atmospheric relevance of this process.
25
Glyoxal is absorbing in the UV and visible spectral range between 200 and 470 nm with two main absorption bands: a broad UV band between 220 and 350 nm and a more structured band between 350 and 470 nm (Atkinson et al., 2006 and references therein). The spectrum between 425 and 457 nm includes a sharp peak of glyoxal at
ACPD
8, 1673–1708, 2008 Secondary sources and distribution of glyoxal S. Myriokefalitakis et al. Title Page Abstract Introduction Conclusions References Tables Figures ◭ ◮ ◭ ◮ Back CloseFull Screen / Esc
Printer-friendly Version
Interactive Discussion
455 nm (Volkamer et al., 2005c). This band has enabled the recent direct detection of glyoxal on local (Volkamer et al., 2005b; Sinreich et al., 2007) and global scales (Wittrock et al., 2006), i.e., by the SCIAMACHY satellite instrument, using the well established Differential Optical Absorption Spectroscopy (DOAS) technique.
Simultaneous observations of HCHO, CHOCHO, carbon monoxide (CO) and
nitro-5
gen dioxide (NO2) have been proposed to provide insight to the contribution of pho-tochemistry versus that of primary sources to the building up of pollutants in the tro-posphere (Garcia-Alonso et al., 2006). In particular, HCHO is used as indicator of VOC oxidation (Palmer et al., 2003; Wittrock et al., 2006). However, over urban hot spot areas, HCHO is affected by direct emissions and photochemical sources. The
10
ambient levels of CHOCHO are about 10 times less affected by primary sources than HCHO (as argued in Volkamer et al., 2005b). CHOCHO is therefore a better indicator of VOC processes (Volkamer et al., 2005b) and particularly of fast photochemistry of anthropogenic VOCs (Spaulding et al., 2003). Carbon monoxide is a tracer of primary anthropogenic emissions (Garcia-Alonso et al., 2006). Garcia et al. (2006) used the
15
CHOCHO-CO tracer pair for source apportionment of ambient HCHO, and found that 40–70% (depending on the time of day) of the ambient HCHO was emission-related in Mexico City. Furthermore, the ratio of CHOCHO to NO2provides insight to the photo-chemical age of the studied air mass since it is increasing with aging of air masses and conversion of NO2to nitric acid that is further removed from the atmosphere (Volkamer
20
et al., 2005b; Sinreich et al. 2007).
In the present study, we applied the global 3-dimensional chemistry transport model of the troposphere TM4 in order to investigate glyoxal formation from biogenic, biomass burning and anthropogenic precursors and its seasonal variability. The model results are constrained by satellite observations from the SCIAMACHY instrument taken in
25
2005. The potential utility of synergistic use of glyoxal and other short-lived trace gases observations from space to distinguish between the impact of anthropogenic and of natural emissions on tropospheric chemistry is also examined.
ACPD
8, 1673–1708, 2008 Secondary sources and distribution of glyoxal S. Myriokefalitakis et al. Title Page Abstract Introduction Conclusions References Tables Figures ◭ ◮ ◭ ◮ Back CloseFull Screen / Esc
Printer-friendly Version
Interactive Discussion
EGU
2 Model description
The model used for the present study is the well documented off-line chemical model TM4 (van Noije et al., 2004, 2006). TM4 has been evaluated in the frame of some intercomparison exercises (Shindell et al., 2006; Stevenson et al., 2006). It has 31 vertical hybrid layers from the surface to 10 hPa and can run in two different horizontal
5
resolutions, the low resolution of 6◦×4◦in longitude and latitude and the high resolution of 3◦
×2◦. For the present study the low resolution version of the model has been mainly used for the source apportionment analysis. The model’s input meteorology comes from the ECMWF operational data for 2005 and is updated every 6 h.
2.1 Emissions
10
The adopted emissions of primary particles (carbonaceous aerosols, dust, sea-salt, small fraction of sulfate) in TM4 are presented in detail by Tsigaridis et al. (2006) and Tsigaridis and Kanakidou (2007). For the biogenic VOC emissions TM4 uses the 1◦×1◦ gridded emission distribution from the POET database (Granier et al., 2005) that is based on the GEIA (Guenther et al., 1995) inventory. For the anthropogenic VOC,
15
NOx and CO emissions, TM4 also uses the POET emission database. This corre-sponds to the year 2000 that is the most recent year with complete information avail-able. The POET dataset is issued from the Emission Database for Global Atmospheric Research (EDGAR) version 3 inventories for the anthropogenic emissions for the year 1995 with appropriate modifications to refer to recent years (Olivier et al., 2003; Granier
20
et al., 2005). Due to differences in the representation of the volatile organic compound (VOC) chemistry in TM4 compared to the earlier studies by Tsigaridis and coworkers, TM4 uses a different speciation in the VOC emissions. Thus, the present study consid-ers annual biogenic emissions of VOC of 501 Tg of isoprene (1 Tg from the oceans), 244 Tg of monoterpenes and Other Reactive Volatile Organic Compounds (ORVOC)
25
that are able to produce aerosols (like sesquiterpenes, terpenoid alcohols etc, as dis-cussed in Griffin et al., 1999, and incorporated in the model as explained in Kanakidou
ACPD
8, 1673–1708, 2008 Secondary sources and distribution of glyoxal S. Myriokefalitakis et al. Title Page Abstract Introduction Conclusions References Tables Figures ◭ ◮ ◭ ◮ Back CloseFull Screen / Esc
Printer-friendly Version
Interactive Discussion
et al., 2000). Additional biogenic emissions of oxygenated organics not considered as aerosol precursors are those of acetone, methanol, acetaldehyde and other light car-bonyls (27 Tg yr−1, 243 Tg yr−1, 2 Tg yr−1 and 14 Tg yr−1, respectively), which are also taken into account in the model. Formaldehyde emissions from biomass burning and anthropogenic activities of 2.5 Tg y−1and 1.3 Tg y−1, respectively, are also considered
5
(POET database). The adopted emissions of aromatic hydrocarbons (POET dataset) total 33 Tg y−1with about 7% emitted from biomass burning, and consist of 7 Tg y−1 of benzene, 14 Tg y−1of toluene and 12 Tg y−1of xylene. Among the other compounds of interest for the present study, ethene, propene and acetylene emissions from the same database account for 17 Tg y−1, 7 Tg y−1and 7 Tg y−1, respectively.
10
2.2 Chemistry
The model considers sulphur, ammonia and C1-C5 hydrocarbons chemistry including isoprene, as well as highly simplified terpenes and aromatics chemistry. It uses an updated version of the Kanakidou and Crutzen (1999) and Poisson et al. (2000) chem-ical mechanism suitable to simulate the chemistry of the global troposphere.
Gas-15
phase chemistry and secondary aerosol formation are coupled and computed on-line together with all other major aerosol components (sulphate, nitrate, ammonium, car-bonaceous, dust, salt, aerosol water). For the present simulations, dust and sea-salt components have been neglected in order to save computing time. The VOC scheme explicitly considers methane, ethane, ethene, acetylene, propane, propene,
20
butane and isoprene. Reactions of monoterpenes and aromatics are affecting both gas-phase chemistry and aerosol production as described in Tsigaridis and Kanakidou (2003, 2007). Monoterpenes and ORVOC are represented by α- and β- pinene, while aromatic compounds are represented by benzene, toluene and xylene. The α- and
β-pinene oxidation by hydroxyl (OH) and nitrate (NO3) radicals and ozone are
consid-25
ered to form semi-volatile organics, which are the precursors of SOA, and C5 peroxy radicals, like the first generation peroxy radicals from isoprene oxidation. The reac-tions of all peroxy radicals with hydrogen peroxide (HO ) and methyl peroxide (CH O )
ACPD
8, 1673–1708, 2008 Secondary sources and distribution of glyoxal S. Myriokefalitakis et al. Title Page Abstract Introduction Conclusions References Tables Figures ◭ ◮ ◭ ◮ Back CloseFull Screen / Esc
Printer-friendly Version
Interactive Discussion
EGU are taken into account as indicated in Vrekoussis et al. (2004) with updated
kinet-ics based on Atkinson et al. (2006). NO3 radical reactions with aldehydes, alcohols, dimethylsulfide, butane and unsaturated hydrocarbons are considered. Aromatics are considered to react with OH, O3and NO3, with the reaction of OH being the dominant removal process accounting for 100, 99.9, 99.8% of the removal of benzene, toluene
5
and xylene, respectively. The reactions of aromatics with OH are considered to pro-duce glyoxal as first generation product and peroxy radicals that can further react to form gaseous and aerosol products. For simplicity purposes their gaseous products are treated in the model as butyloperoxy radicals; attention is paid to preserve the carbon balance. SOA production by VOC oxidation is parameterized as detailed in Tsigaridis
10
and Kanakidou (2003). The full list of chemical reactions and reaction rates adopted in TM4 is given in the Supplementary material (http://www.atmos-chem-phys-discuss. net/8/1673/2008/acpd-8-1673-2008-supplement.pdf).
In particular for glyoxal, the TM4 model considers primary formation during the ox-idation of isoprene, acetylene, aromatic hydrocarbons (Volkamer et al., 2005a) and
15
ozonolysis of ethene and propene as well as secondary formation (via glycolaldehyde – HOCH2CHO) from the oxidation of ethene and from peroxy radicals produced dur-ing the oxidation of isoprene (Table 1). Other biogenic hydrocarbons, like terpenes, and other reactive organics, like sesquiterpenes and terpenoid alcohols, also produce glyoxal (as secondary product) in TM4, since their chemistry is lumped on the first
20
generation peroxy radicals of isoprene (as parameterized in Tsigaridis and Kanaki-dou, 2003). Glyoxal is destroyed by photolysis (Atkinson et al., 2006; Volkamer et al., 2005c; Tadic et al., 2006), reaction with OH (Feierabend et al., 2008) and to a lesser extent with NO3, and via wet and dry deposition. For the dry deposition of glyoxal as for the other gaseous species, the Ganzeveld and Lelieveld (1995) resistance
anal-25
ogy scheme has been used, which is based on the formulation developed by Wesely (1989). For the wet deposition, both large scale and convective precipitation are con-sidered and the in-cloud and below cloud scavenging are parameterised in the model TM4 as described in detail by Jeuken et al. (2001). In-cloud scavenging of glyoxal is
ACPD
8, 1673–1708, 2008 Secondary sources and distribution of glyoxal S. Myriokefalitakis et al. Title Page Abstract Introduction Conclusions References Tables Figures ◭ ◮ ◭ ◮ Back CloseFull Screen / Esc
Printer-friendly Version
Interactive Discussion
parameterized based on the Henry law coefficient of KH=2.6×10 7
M/atm (Kroll et al., 2005) that is 2 orders of magnitude higher than the Henry Law coefficient suggested by Lim et al. (2005). The in-cloud loss of glyoxal has been suggested to be a signifi-cant sink for glyoxal leading to SOA formation (Liggio et al., 2005; Loeffler et al., 2006; Sorooshian et al., 2007). The importance of this process for SOA budget in the global
5
troposphere is under investigation by additional 3-dimensional simulations and will be the subject of a forthcoming publication.
2.3 The simulations
In order to investigate the influence of natural and anthropogenic emissions of hydro-carbons on glyoxal distribution and its global budget, three different glyoxal-chemistry
10
scenarios have been considered. Any potential primary emissions of glyoxal are ne-glected in the present study due to the large variability and uncertainty in glyoxal emis-sion factors. The first simulation (S1) is considering glyoxal production only from the oxidation of the naturally emitted VOCs. S1 also considers in-cloud loss of glyoxal as explained in Sect. 2.2. The second simulation (S2) is as S1 but also takes into account
15
the contribution of biomass burning emissions of ethene, propene, acetylene and aro-matics to the chemical production of glyoxal. The third simulation (S3) is as (S2) but considers in addition the contribution of anthropogenic emissions of ethene, propene, acetylene and aromatics to glyoxal formation, i.e. accounts for all known photochemical sources of glyoxal. This simulation has been also performed at the high horizontal
reso-20
lution of TM4 (S3-H). The difference between the simulations (S2) and (S1) is attributed to the secondary production of glyoxal from the biomass burning VOCs; whereas that between (S3) and (S2) is attributed to the production of glyoxal from anthropogenic VOC. Primary emissions of glyoxal have been neglected in the present study due to the large uncertainty in their intensity resulting form the significant variability in the
25
emission factors and the scarcity of available data.
ACPD
8, 1673–1708, 2008 Secondary sources and distribution of glyoxal S. Myriokefalitakis et al. Title Page Abstract Introduction Conclusions References Tables Figures ◭ ◮ ◭ ◮ Back CloseFull Screen / Esc
Printer-friendly Version
Interactive Discussion
EGU i) uses updated anthropogenic and biomass burning emission inventories based on
the POET database for the year 2000 and about 20% higher isoprene emissions of 500 Tg yr−1 that is within the range of the present-day estimates by Guenther et al. (2006), ii) takes into account formation of glyoxal also from ethene, propene, acety-lene and aromatics that are predominantly of anthropogenic origin but have also a
5
minor natural component, iii) considers the temperature dependence of the reaction of glyoxal with OH radicals (Feierabend et al., 2008), iv) calculates on line as de-scribed by Landgraf and Crutzen (1998) and Lelieveld et al. (2002) the photolysis rates of glyoxal based on the IUPAC and JPL recommendations (Atkinson et al., 2006 and references therein; Sander et al., 2006). Moreover, Wittrock et al. (2006) used
diur-10
nal mean glyoxal columns to compare with the satellite observations whereas in the present study the columns calculated for the satellite overpass time have been used (10:00–11:00 a.m. local time).
3 Satellite observations
3.1 The instrument
15
The sensor SCIAMACHY (SCanning Imaging Absorption spectroMeter for Atmo-spheric CartograpHY) is mounted on the ESA ENVISAT satellite. It is designed to measure sunlight, transmitted, reflected and scattered by the earth’s atmosphere or surface in the ultraviolet, visible and near infrared (Burrows et al., 1995; Bovensmann et al., 1999). The sun-synchronous, near polar orbit of the satellite has a local equator
20
crossing time of 10:00 a.m. in the descending node. The alternative measurements of nadir and limb viewing geometries (Gottwald et al., 2006) are coupled with a swath width of 960 km and global coverage is achieved within six days. The ground pixel size used in this study is 30 km along track by 60 km across track.
ACPD
8, 1673–1708, 2008 Secondary sources and distribution of glyoxal S. Myriokefalitakis et al. Title Page Abstract Introduction Conclusions References Tables Figures ◭ ◮ ◭ ◮ Back CloseFull Screen / Esc
Printer-friendly Version
Interactive Discussion
3.2 The retrieval technique and glyoxal algorithm
The retrieval approach adopted for the vertical columns of CHOCHO is based on the well established DOAS technique. Briefly, DOAS is used for the determination of the Slant Column densities (SCD) of the respective absorbers in a given spectral window (436–457 nm for the present study). Only ground scenes having less than 20 percent
5
cloud cover are considered. The SCD is then converted to Vertical Column Densi-ties (VCD) by applying the air mass factor (AMF), which is defined as the ratio of the SCD/VCD. This accounts for the path of light through the atmosphere and considers the vertical profiles of scattering and absorbing species (Wittrock et al., 2004). The absorption cross sections of CHOCHO (Volkamer et al., 2005c), O3, NO2, H2O, O4,
10
chlorophyll (Bracher and Tilzer, 2001; Vountas et al., 2007), a ring spectrum, which ac-counts for both rotational and vibrational Raman scattering, and a quadratic polynomial are included in the fitting procedure.
Prior conversion to vertical columns, the retrieved slant columns were normalised by assuming a mean value of 0.5×10¹³molecules cm−2for CHOCHO over the Pacific
15
in latitudes (30◦N–30◦S) in the region between 165◦E and 165◦W. This normalisation is necessary for many GOME and SCIAMACHY products to compensate for offsets introduced by the solar reference measurements and interference from other absorbers (Richter and Burrows, 2002).
4 Results and discussion
20
4.1 Comparison against glyoxal surface observations
Even at its high spatial resolution of 2◦ latitude and 3◦ longitude, TM4 has a rather coarse grid that at around 45◦N corresponds to about 220 km in latitude × 230 km in longitude. Therefore, it is expected that as most global models, TM4 underestimates short lived species concentrations over hot spot areas. This is because these hot spot
ACPD
8, 1673–1708, 2008 Secondary sources and distribution of glyoxal S. Myriokefalitakis et al. Title Page Abstract Introduction Conclusions References Tables Figures ◭ ◮ ◭ ◮ Back CloseFull Screen / Esc
Printer-friendly Version
Interactive Discussion
EGU areas extend only over a small fraction of the surface of the model grid boxes and thus
in these model grids the short lived species are artificially diluted over hot spot areas by instantaneous mixing with cleaner air from the surrounding locations in the same grid boxes. Keeping in mind these limitations, the results of the high resolution TM4 simulation (S3-H) are evaluated against ground based observations reported in the
5
literature for different places of the world (Table 2). An overall reasonable agreement is seen between the TM4 S3-H simulated boundary layer glyoxal concentrations and the surface observations. The model reproduces remarkably well the observations by Sinreich et al. (2007) at coastal oceanic areas on board the RV Ron Brown. In contrast, it misses the extremely high values observed inside the urban core of Hong Kong by
10
Ho and Yu (2002).
In addition to the above mentioned spatial effects that contribute to the differences between model results and observations, uncertainties in oxidant fields, VOC loadings and particulate matter levels are also at the origin of differences illustrated in Table 2. In addition, potentially existent primary glyoxal sources that have been neglected in TM4
15
(as discussed in Sect. 2.3) could be a reason for an underestimate of glyoxal levels by the model. On the opposite, a potentially strong missing sink of glyoxal could explain an overestimate of glyoxal in the model. Such sink of glyoxal on aerosols has been suggested by Volkamer et al. (2007a) to reconcile glyoxal observations in Mexico City with results of a box model that was very well experimentally constrained.
20
It has to be stressed that there is a clear need for more ground based glyoxal obser-vations available for model and satellite evaluations, in particular over oceanic areas since most of the glyoxal observations are restricted to continental anthropogenically influenced locations.
4.2 Annual mean glyoxal columns
25
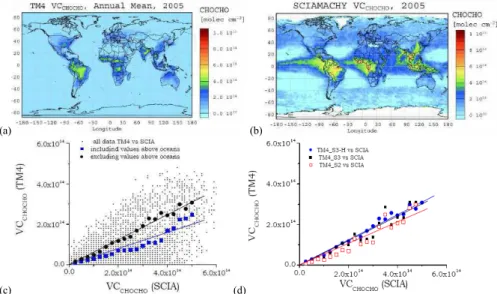
Focusing on the global annual mean CHOCHO column distribution for the year 2005, the S3-H simulations are compared with the columns retrieved from SCIAMACHY mea-surements in Fig. 1a. The model captures high columns of CHOCHO in the tropics
as-ACPD
8, 1673–1708, 2008 Secondary sources and distribution of glyoxal S. Myriokefalitakis et al. Title Page Abstract Introduction Conclusions References Tables Figures ◭ ◮ ◭ ◮ Back CloseFull Screen / Esc
Printer-friendly Version
Interactive Discussion
sociated mainly with biogenic and biomass burning emissions as has been observed by SCIAMACHY (Fig. 1b), although the model underestimates the observations.
As seen in the figures, TM4 misses the significant CHOCHO levels observed by SCIAMACHY over the tropical oceans and close to upwelling areas. This statement is also supported by the correlations shown in Fig. 1c. In this figure the simulated
5
annual mean glyoxal vertical columns have been plotted against the SCIAMACHY an-nual mean observations in 2005. The points correspond to all 2◦×3◦ grid boxes with SCIAMACHY observations. To better visualize the highly scattered data the modeled CHOCHO columns were grouped per 2.5×10¹³molecules cm−2 of SCIAMACHY val-ues. Thus, the binned data shown as solid blue squares have been derived and the
10
blue line corresponds to the linear fit of these data that indicates a slope of 0.43 and a correlation coefficient r of 0.95. When neglecting the observations and the simulated values over the oceans the solid black circles have been derived that correspond to bet-ter correlation (r=0.99) and slope of 0.62 that is closer to unity than when considering the oceanic values.
15
This may indicate the existence of primary or secondary tropical sources of glyoxal over the oceans that are neglected or underestimated by the model, although some outflow from the continents (Sinreich et al., 2007) and slight enhancement over the tropical oceans and the north Atlantic is currently simulated by TM4 compared to the earlier simulations by Wittrock et al. (2006). These patterns will be investigated further
20
in a forthcoming paper.
Focusing on the model results over the continents, in Fig. 1d the binned data derived as above explained are plotted against the SCIAMACHY annual mean observations for both the high (S3-H) and the low (S3) resolution simulations considering all photochem-ical sources of glyoxal as well as for the S2 simulation that neglects the anthropogenic
25
contribution to this source. From this comparison it can be seen that the S3-H high res-olution simulation performs the best (slope=0.62, r=0.99) when compared to the lower resolution S3 simulations (slope=0.60, r=0.95) and the S2 simulation that neglects the anthropogenic contribution (slope=0.53, r=0.95). These comparisons suggest i) that
ACPD
8, 1673–1708, 2008 Secondary sources and distribution of glyoxal S. Myriokefalitakis et al. Title Page Abstract Introduction Conclusions References Tables Figures ◭ ◮ ◭ ◮ Back CloseFull Screen / Esc
Printer-friendly Version
Interactive Discussion
EGU TM4 underestimates the annual mean glyoxal columns observed by SCIAMACHY in
2005, ii) that accounting for the anthropogenic contribution to the photochemical for-mation of glyoxal, TM4 results compare better with the observations.
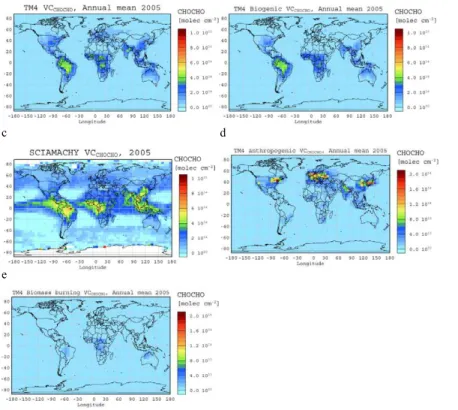
Figure 2a depicts the global annual mean CHOCHO column distribution for the year 2005, computed by the S3 simulation to be compared with Fig. 2c that shows the
5
SCIAMACHY observations at the same spatial resolution (4◦×6◦). Figure 2b depicts the calculated annual mean column of glyoxal produced from biogenic VOC oxidation (simulation S1). Most of the annual mean column of glyoxal over the tropics that max-imizes at about 5×10¹⁴molecules cm−2 is attributed to the oxidation of biogenic VOC. Annual mean columns smaller than 3×10¹⁴molecules cm−2 are computed over
north-10
ern hemisphere mid-latitude continental regions. Note that these biogenically derived glyoxal columns are slightly smaller than the earlier simulations in Wittrock et al. (2006) that did not account for the wet removal of glyoxal in-clouds and used slower photolysis rate of glyoxal than the present study.
As mentioned in Sect. 2.3, biomass burning primary emissions of glyoxal in the
trop-15
ics (and elsewhere) have been neglected in the present study since they are highly uncertain, although they might be of importance for glyoxal columns in this region. However, the secondary biomass burning source of glyoxal from the oxidation of VOC is taken into account in the simulations (S2 and S3). Its contribution to the glyoxal col-umn is quantified as the difference between the simulations S2 and S1 and is depicted
20
in Fig. 2e (annual mean column) and Fig. 3i, j (seasonally mean columns). According to our calculations the secondary source of glyoxal from biomass burning contributes about 3 Tg yr−1to the global chemical production of glyoxal and therefore increases its global annual mean burden by about 5%, adding at most 2×10¹⁴molecules cm−2 to the glyoxal column over tropical biomass burning areas.
25
Simulation S3 calculates significant glyoxal columns of about 2 to 4×10¹⁴molecules cm−2 over the anthropogenic hot spot areas of USA, Europe, India and China (Fig. 2a) that are also detectable from space (Fig. 2c) but are not reproduced in simulations S1 and S2. Figure 2d depicts the increase in the annual
ACPD
8, 1673–1708, 2008 Secondary sources and distribution of glyoxal S. Myriokefalitakis et al. Title Page Abstract Introduction Conclusions References Tables Figures ◭ ◮ ◭ ◮ Back CloseFull Screen / Esc
Printer-friendly Version
Interactive Discussion
mean column of glyoxal due to the consideration of glyoxal production during the oxi-dation of anthropogenically emitted VOC (difference between simulations S3 and S2). According to our calculations, the secondary source of glyoxal from anthropogenic emissions contributes about 10 Tg yr−1 to the global chemical production of glyoxal, i.e., that is about 18% of the overall chemical production. It is interesting to note that
5
the glyoxal global annual mean burden issued from the anthropogenic emissions is about 32% of the total; this fraction is larger than the corresponding fraction of the chemical production. This reflects the fact that the anthropogenic source is located mostly in the extratropics where the destruction of glyoxal by photolysis and reaction with OH radical is moderate and thus glyoxal lifetime is longer than its global mean
10
value.
On the contrary, the biogenically derived burden of glyoxal is 63% of the total glyoxal burden whereas the corresponding chemical production is higher, about 77% of the total. This increased chemical production is compensated by a shorter lifetime of gly-oxal in the tropics. Thus, the computed global lifetime of glygly-oxal averaged year-around
15
increases from 2.4 h when only biogenic sources are taken into account (S1) and 2.5 h when biomass burning sources are also considered (S2) to 3 h when all sources are taken into account (S3).
Our simulations indicate that the global mean lifetime of glyoxal critically depends on the location of its sources. In particular, the anthropogenic sources of glyoxal are
20
more effective in increasing its burden since they are located mostly in the mid latitudes where the photochemical sink of glyoxal is moderate and thus its lifetime longer than in the tropics.
4.3 Seasonal variation
It is worth comparing the seasonal pattern of the calculated and observed glyoxal
25
columns. Figure 3 depicts the NH winter and NH summer column distributions of gly-oxal as observed by SCIAMACHY (panels 3a and b, respectively) and as calculated by TM4 S3 simulation (panels 3c and d, respectively). In the NH, TM4 simulations
ACPD
8, 1673–1708, 2008 Secondary sources and distribution of glyoxal S. Myriokefalitakis et al. Title Page Abstract Introduction Conclusions References Tables Figures ◭ ◮ ◭ ◮ Back CloseFull Screen / Esc
Printer-friendly Version
Interactive Discussion
EGU show higher glyoxal columns during summer than during winter in agreement with the
satellite observations, reflecting the photochemical origin of glyoxal and the important contribution of the biogenic VOC oxidation to glyoxal chemical production (Fig. 3e and f). It is also remarkable that during NH summer the model overestimates the CHOCHO over the Amazon, but not over the African tropical forests. Biomass burning
emis-5
sions occurring mostly in the tropics present also a strong seasonality with significantly different geographical patterns from one season to another that are reflected in gly-oxal distribution as depicted in Fig. 3i and j. However, their contribution to the glygly-oxal columns is minor compared to that from the biogenic VOC oxidation (Fig. 3e and f). Therefore, most probably the model overestimate of glyoxal columns is related to the
10
biogenic VOC emission inventory adopted in our model.
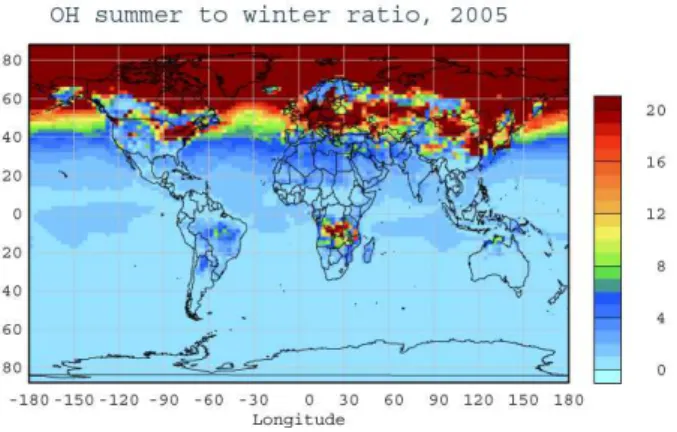
Biogenic VOC emissions are enhanced under warm and sunny conditions (Guen-ther et al., 2006). In particular, biogenic VOC emissions between 30 N and 60 N are about 50 times higher during summer than during winter. On the contrary, the anthro-pogenic VOC emissions present a much weaker seasonality. In our model simulations
15
this seasonality has been neglected, since the EDGAR and POET emissions database do not provide information on the seasonal variability of the anthropogenic VOC emis-sions. The calculated hydroxyl radical concentration, the main tropospheric oxidant responsible for glyoxal formation, shows a strong seasonality, with a summer-to-winter ratio that varies near the surface in the northern troposphere mid-latitudes from about
20
2 to more than 20, as presented in Fig. 4. The strong seasonality in oxidant levels and biogenic emissions leads to about 25% higher global production of glyoxal during the NH summer than during the NH winter (Fig. 3g and h). In parallel, the losses of glyoxal are also about 25% higher during summer as a result of increased losses of glyoxal by photodissociation (20%), by OH radical (40%) and by deposition (25%). The
25
overall result is an almost 10% enhancement of the glyoxal column during NH summer (global burden 0.019 Tg) compared to NH winter (global burden 0.017 Tg). Note that in the present study, a potential aerosol sink of glyoxal that could be of relevance for atmospheric conditions is neglected.
ACPD
8, 1673–1708, 2008 Secondary sources and distribution of glyoxal S. Myriokefalitakis et al. Title Page Abstract Introduction Conclusions References Tables Figures ◭ ◮ ◭ ◮ Back CloseFull Screen / Esc
Printer-friendly Version
Interactive Discussion
4.4 Ratios of trace gases columns
Due to the strong anthropogenic signal in the glyoxal column, it is expected that syn-ergistic use of glyoxal and formaldehyde observations from space could provide a powerful tool to evaluate VOC emissions and impact on tropospheric chemistry as a function of source region and type. This is further investigated by examining the
5
computed ratios of CHOCHO to HCHO over the tropics and over the hot-spot north-ern hemisphere areas. The satellite observations of CHOCHO and HCHO molecules were used to compute the respective ratio above the 30 most populated areas of the world (http://www.infoplease.com/ipa/A0884418.html). The mean value of the ratio of CHOCHO/HCHO above these regions was 0.037±0.014. This mean ratio is in
excel-10
lent agreement with the value of 0.025 observed in Mexico City based on the data provided by Garcia et al. (2006), and taking into account the diurnal profile of these carbonyls to match the satellite overpass time. The same model analysis performed aloft biogenic sources gave a slightly enhanced average value equal to 0.050±0.025. This latter number is in good agreement with the range of values 0.04–0.06 reported
15
by Munger et al. (1995) and Spaulding et al. (2003). These values are contrasted with those computed by the TM4 model (Fig. 5a): the model calculated ratios, derived from the 10-11 am local time simulations, are in reasonable agreement with the satellite data (not shown) over the selected regions with intense anthropogenic emissions, namely Europe, China, India and the United States. Figure 5b illustrates the same ratio when
20
the anthropogenically produced glyoxal is not taken into account (simulation S2). As expected, the major impact of this photochemical source of glyoxal is seen above the northern hemisphere areas.
The differences in the CHOCHO/HCHO ratio between simulations S3 and S2 that is attributed to the photochemical source of glyoxal from human activities is shown in
25
ACPD
8, 1673–1708, 2008 Secondary sources and distribution of glyoxal S. Myriokefalitakis et al. Title Page Abstract Introduction Conclusions References Tables Figures ◭ ◮ ◭ ◮ Back CloseFull Screen / Esc
Printer-friendly Version
Interactive Discussion
EGU 4.5 Glyoxal annual global budget
According to the TM4 simulations, CHOCHO global annual chemical production to-tals 56 Tg CHOCHO y−1. This results by 70% from the oxidation of biogenics, iso-prene and terpenes, among which the predominant portion is formed via formation of glycolaldehyde and hydroxyacetone and subsequent degradation. To a smaller
ex-5
tent CHOCHO is formed from AVOCs, i.e. 17% from acetylene, 11% from aromat-ics, and 2% from ethene and propene. According to the TM4 model simulations, the contribution of anthropogenic VOC oxidation to CHOCHO column is limited to 3–20% over the tropics and maximizes over the urban-influenced areas in the Northern Hemi-sphere where it reaches 20–70%; however, the glyoxal column is relatively low (∼2 to
10
∼4×10¹⁴molecules cm−2) in the anthropogenic influenced regions. This is consistent with findings in Mexico City, where aromatics make some 70–80% of the glyoxal pro-duction rate. A direct comparison of the relative contribution of individual VOC sources and glyoxal sinks is possible for Mexico City (data from Table 1 of Volkamer et al., 2007a) and the Pearl River Delta (Volkamer et al., 2007a), in good agreement with the
15
model results in this study.
Glyoxal is destroyed by photolysis (60%), and OH radical reactions (23%), but it is also removed from the atmosphere through wet deposition (11%) and dry deposition (6%). As a result, the glyoxal global burden equals 0.02 Tg and its global mean lifetime 3 h.
20
It is also remarkable that on an annual basis according to our model simulations, about 5 Tg of glyoxal are removed from the atmosphere via wet deposition processes. This amount has the potential to form secondary organic aerosol as the result of cloud processing of glyoxal, and has to be considered an upper limit for glyoxal contribution to SOA formation from cloud processing in the troposphere. Glyoxal related SOA
for-25
mation in the absence of clouds as recently indicated may however add further SOA (Volkamer et al., 2007a). This topic requires further investigation and refinement.
ACPD
8, 1673–1708, 2008 Secondary sources and distribution of glyoxal S. Myriokefalitakis et al. Title Page Abstract Introduction Conclusions References Tables Figures ◭ ◮ ◭ ◮ Back CloseFull Screen / Esc
Printer-friendly Version
Interactive Discussion
5 Conclusions
The global 3-dimensional chemistry/transport model TM4 has been applied to simu-late the temporal and spatial distribution of CHOCHO column in the global troposphere with focus on the anthropogenic contribution to the CHOCHO levels and seasonality. Aromatic and other anthropogenic hydrocarbons can play an important role for glyoxal
5
columns. Wittrock et al. (2006) showed significant amounts of glyoxal above highly populated regions using measurements by the SCIAMACHY sensor. The enhanced CHOCHO columns above regions with high anthropogenic emissions are confirmed by the latest SCIAMACHY measurements, and ground-based satellite validation efforts in Mexico City, and the Pearl River Delta, China (Volkamer et al., 2006b). The global
10
annual chemical production of CHOCHO has been calculated by the TM4 model to equal 56 Tg CHOCHO y−1. Anthropogenic compounds account for about 30% of the total chemical production with acetylene producing about 17% and aromatic hydrocar-bons (toluene, xylene and benzene) about 11%. According to TM4 model calculations, the contribution of anthropogenic VOC to the CHOCHO column is limited to 3–20%
15
over the tropics and maximizes over urban-influenced areas in the Northern Hemi-sphere where it reaches 70%. The improvement in the computed glyoxal total column compared to the earlier study by Wittrock et al. (2006) resulted in better agreement between the model results and the glyoxal observations in the mid latitudes. However, the model does not capture the enhancement of CHOCHO columns over the tropical
20
ocean seen by SCIAMACHY. This may indicate the existence of primary or secondary tropical and/or oceanic sources of CHOCHO that are neglected or underestimated by the model. Our model simulations yield 5 Tg yr−1 as the upper limit of glyoxal poten-tial contribution to the SOA formation via multiphase chemistry in clouds. This first estimate deserves careful and further refinement. The role of oceans, clouds and
pos-25
sibly aerosols are areas of major uncertainties for glyoxal modeling and deserve further studies.
ex-ACPD
8, 1673–1708, 2008 Secondary sources and distribution of glyoxal S. Myriokefalitakis et al. Title Page Abstract Introduction Conclusions References Tables Figures ◭ ◮ ◭ ◮ Back CloseFull Screen / Esc
Printer-friendly Version
Interactive Discussion
EGU
cellence. S. Myriokefalitakis acknowledges support by a PENED 03ED373 grant co-financed by EU-European Social Fund (75%) and the Greek Ministry of Development – GSRT (25%). M. Vrekoussis acknowledges consecutive supporting fellowships by the A. v. Humbolt Foun-dation and the EU (Marie Curie – Intra European Fellowships). We thank K. Feierabend and J. Burkholder for communication of their results prior publication.
5
References
Atkinson, R., Baulch, D. L., Cox, R., A., Crowley, J., N., Hampson, R., F., Hynes, R., G., Jenkin, M., E., Rossi, M., J., Troe, J., and IUPAC Subcommittee: Evaluated kinetic and photochemical data for atmospheric chemistry: Volume II – gas phase reactions of organic species, Atmos. Chem. Phys., 6, 3625–4055, 2006,
10
http://www.atmos-chem-phys.net/6/3625/2006/.
Bloss, C., Wagner, V., Jenkin, M. E., Volkamer, R., Bloss, W. J., Lee, J. D., Heard, D. E., Wirtz, K., Martin-Reviejo, M., Rea, G., Wenger, J. C., and Pilling, M. J.: Development of a detailed chemical mechanism (MCMv3.1) for the atmospheric oxidation of aromatic hydrocarbons, Atmos. Chem. Phys., 5, 641–664, 2005,
15
http://www.atmos-chem-phys.net/5/641/2005/.
Bovensmann, H., Burrows, J. P, Buchwitz, M, Frerick, J., Noel, S., Rozanov, V. V. Chance, K. V, and Goede, A. P. H.: SCIAMACHY: Mission objectives and measurement modes, J. Atmos. Sci., 56, 127–150, 1999.
Borrego, C., Gomes, P., Barros, N., and Miranda, A. I.: Importance of handling organic
atmo-20
spheric pollutants for assessing air quality, J. Chromatogr. A, 889, 271-279, 2000.
Bracher, A., and Tilzer, M.: Underwater light field and phytoplankton absorbance in different surface water masses of the Atlantic Sector of the Southern Ocean, Pol. Biol., 24, 687–696, 2001.
Burrows, J. P., H ¨olzle, E., Goede, A. P. H., Visser, H., and Fricke, W.: SCIAMACHY –
Scan-25
ning Imaging Absorption Spectrometer for Atmospheric Chartography, Acta Astronaut., 35, 5 445–451, 1995.
Calvert, J. G., Atkinson, R., Kerr, J. A., Madronich, S., Moortgat, G. K., Wallington, T. J., and Yarwood, G.: The Mechanisms of Atmospheric Oxidation of the Alkenes, Oxford University Press, New York, 2000.
ACPD
8, 1673–1708, 2008 Secondary sources and distribution of glyoxal S. Myriokefalitakis et al. Title Page Abstract Introduction Conclusions References Tables Figures ◭ ◮ ◭ ◮ Back CloseFull Screen / Esc
Printer-friendly Version
Interactive Discussion
Calvert, J. G., Atkinson, R., Becker, K. H., Kamens, R. M., Seinfeld, J. H., Wallington, T. J., and Yarwood, G.: The Mechanisms of Atmospheric Oxidation of Aromatic Hydrocarbons, Oxford University Press, Oxford, 2002.
Evans, J., Levy, J., Hammitt, J., Santos-Burgoa, C., Castille-Jos, M., Caballero-Ramirez, M., Hernandez-Avila, M., Riojas-Rodriguez, H., Rojas-Bracho, L., Serrano-Trespalacios, P.,
5
Spengler, J. D., and Suh, H.: Health benefits of air pollution control, in: Air Quality in the Mexico Megacities: An Integrated Assessment, edited by: Molina, L. T. and Molina, M. J., Kluwer Academic Publishers, 103–136, 2002.
Feierabend, K., Zhu, L., Talukdar, R. K., and Burkholder, J. B.: Rate coefficients for the OH + HC(O)C(O)H (Glyoxal) reaction between 210 and 390 K, J. Phys. Chem. A, 112(1), 73–82,
10
doi:10.1021/jp0768571, 2008.
Ganzeveld, L. and Lelieveld, J.: Dry deposition parameterization in a chemistry general circu-lation model and its influence on the distribution of reactive trace gases, J. Geophys. Res., 100, 20 999–21 012, 1995.
Garc´ıa-Alonso, S., P ´erez-Pastor, R., and Sevillano-Casta ˜no, M. L.: Determination of glyoxal
15
and methylglyoxal in atmospheric particulate matter by 2,4-dinitrophenylhydrazine derivati-sation, Toxicol. Environ. Chem., 88(3), 445–452, doi:10.1080/02772240600796837, 2006. Garcia, A. R., Volkamer, R., Molina, L. T., Molina, M. J., Samuelsson, J., Mellqvist, J., Galle,
B., Herndon, S., and Kolb, C. E.: Separation of emitted and photochemical formaldehyde in Mexico City using a statistical analysis and a new pair of gas-phase tracers, Atmos. Chem.
20
Phys., 6, 4545–4557, 2006,
http://www.atmos-chem-phys.net/6/4545/2006/.
Gottwald, M., Bovensmann, H., Lichtenberg, G., Noel, S., von Bargen, A., Slijkhuis, S., Piters, A., Hoogeveen, R., von Savigny, C., Buchwitz, M., Kokhanovsky, A., Richter, A., Rozanov, A., Holzer-Popp, T., Bramstedt, K., Lambert, J.-C., Skupin, J., Wittrock, F., Schrijver, H.,
25
and Burrows, J.P.: SCIAMACHY, Monitoring the Changing Earth’s Atmosphere, Published by DLR, 2006.
Gregg, J. W., Jones, C. G., and Dawson, T. E.: Urbanization, air pollution and tree growth in the vicinity of New York City, Nature, 424, 183–187, 2003.
Granier C., Guenther, A., Lamarque, J.F., Mieville, A., Muller, J. F., Olivier, J., Orlando, J.,
30
Peters, J., Petron, G., Tyndall, G., and Wallens, S.: POET, a database of surface emissions of ozone precursors, available on the internet at:http://www.aero.jussieu.fr/project/ACCENT/
ACPD
8, 1673–1708, 2008 Secondary sources and distribution of glyoxal S. Myriokefalitakis et al. Title Page Abstract Introduction Conclusions References Tables Figures ◭ ◮ ◭ ◮ Back CloseFull Screen / Esc
Printer-friendly Version
Interactive Discussion
EGU
Griffin, R. J., Cocker III, D. R., Flagan, R. C., and Seinfeld, J. H.: Organic aerosol formation from oxidation of biogenic hydrocarbons, J. Geophys. Res., 104, 3555–3567, 1999a
Griffin, R. J., Cocker III, D. R., Seinfeld, J. H., and Dabdub, D.: Estimate of global atmospheric organic aerosol from oxidation of biogenic hydrocarbons, Geophys. Res. Lett. 26, 2721– 2724, 1999b
5
Grosjean, E., DeAndrade, J. B., and Grosjean, D.: Carbonyl products of the gas-phase reaction of ozone with simple alkenes, Environ. Sci. Technol., 30, 975–983, 1996a.
Grosjean, E. and Grosjean, D.: The Reaction of Unsaturated Aliphatic Oxygenates with Ozone, J. Atmos. Chem., 32, 205–232, 1999.
Grosjean, D., Grosjean, E., and Gertler, A. W.: On-Road Emissions of Carbonyls from
Light-10
Duty and Heavy-Duty Vehicles, Environ. Sci. Technol., 35, 45–53, 2001.
Guenther, A., Hewitt, C. N., Erickson, D., Fall, R., Geron, C., Graedel, T., Harley, P., Klinger, L., Lerdau, M., McKay, W. A., Pierce, T., Scholes, B., Steinbrecher, R., Tallamraju, R., Taylor, J., and Zimmerman, P.: A global model of natural volatile organic compound emissions, J. Geophys. Res., 100, 8873–8892, 1995.
15
Guenther, A., Karl, T., Harley, P.,Wiedinmyer, C., Palmer, P. I., and Geron, C.: Estimates of global terrestrial isoprene emissions using MEGAN (Model of Emissions of Gases and Aerosols from Nature), Atmos. Chem. Phys., 6, 3181–3210, 2006,
http://www.atmos-chem-phys.net/6/3181/2006/.
Hays, D. M., Geron, D. C., Linna, J. K., Smith, D. M., and Schauer, J. J.: Speciation of
Gas-20
Phase and Fine particle emissions from burning of foliar fuels, Environ. Sci. Technol., 36(11), 2281–2295, doi:10.1021/es0111683, 2002.
Heald, C. L., Jacob, D. J., Park, R. J., Russell, L. M., Huebert, B. J., Seinfeld, J. H., Liao, H., and Weber, R. J.: A large organic aerosol source in the free troposphere missing from current models, J. Geophys. Res., 32, L18809, doi:10.1029/2005GL023831, 2005.
25
Ho, S. S. H. and Yu, J. Z.: Feasibility of collection and analysis of airborne carbonyls by on-sorbent derivatization and thermal desorption, Anal. Chem., 74 1232–1240, 2002.
IUPAC Subcommittee on Gas Kinetic Data Evaluation for Atmospheric Chemistry, Summary of Evaluated Kinetic and Photochemical Data for Atmospheric Chemistry, Web Version Febru-ary,http://www.iupac-kinetic.ch.cam.ac.uk/summary/IUPACsumm web Feb2006.pdf, 2006.
30
Jeuken, A., Veefkind, J. P., Dentener, F., Metzger, S., and Gonzalez, C. R.: Simulation of the aerosol optical depth over Europe for August 1997 and a comparison with observations, J. Geophys. Res., 106, 28 295–28 311, 2001.
ACPD
8, 1673–1708, 2008 Secondary sources and distribution of glyoxal S. Myriokefalitakis et al. Title Page Abstract Introduction Conclusions References Tables Figures ◭ ◮ ◭ ◮ Back CloseFull Screen / Esc
Printer-friendly Version
Interactive Discussion
Jang, M. and Kamens, R. M.: Atmospheric secondary aerosol formation by heterogeneous reactions of aldehydes in the presence of a sulfuric acid aerosol catalyst, Environ. Sci. Tech-nol., 35, 24, 4758–4766, 2001.
Jing, L. H., Steinberg, S. M., and Johnson, B. J.: Aldehyde and monocyclic aromatic hydrocar-bon mixing ratios at an urban site in Las Vegas, Nevada, J. Air Waste Manage., 51 1359–
5
1366, 2001.
Kanakidou, M. and Crutzen, P. J.: The photochemical source of carbon monoxide: Importance, Uncertainties and feedbacks, Chemosphere: Global Change Science, 1, 91–109, 1999. Kanakidou, M., Seinfeld, J. H., Pandis, S. N., Barnes, I., Dentener, F. J., Facchini, M. C., van
Dingenen, R., Ervens, B., Nenes, A., Nielsen, C. J., Swietlicki, E., Putaud, J. P., Balkanski,
10
Y., Fuzzi, S., Horth, J., Moortgat, G. K., Winterhalter, R., Myhre, C. E. L., Tsigaridis, K., Vignati, E., Stephanou, E. G., and Wilson, J.: Organic aerosols and global climate modeling: a review, Atmos. Chem. Phys., 5, 1053–1123, 2005,
http://www.atmos-chem-phys.net/5/1053/2005/.
Kawamura, K., Kasukabe, H., and Barrie, L. A.: Source and reaction pathways of dicarboxylic
15
acids, ketoacids and dicarbonyls in arctic aerosols: One year of observations, Atmos. Envi-ron., 30, 1709–1722, 1996.
Kawamura, K., Steinberg S., and Kaplan I. R.: Homologous series of C-1-C-10 monocarboxylic acids and C-1-C-6 carbonyls in Los Angeles air and motor vehicle exhausts, Atmos. Environ., 34, 4175–4191, 2000.
20
Kean, A. J., Grosjean, E., Grosjean, D., and Harley, R. A.: On-Road Measurement of Carbonyls in California Light-Duty Vehicle Emissions, Environ. Sci. Technol., 35, 4198–4204, 2001. Kroll, J. H., Ng, N. L., Murphy, S. M., Varutbangkul, V., Flagan, R. C., and Seinfeld, J. H.:
Chamber studies of secondary organic aerosol growth by reactive uptake of simple carbonyl compounds, J. Geophys. Res., 110, D23207, doi:10.1029/ 2005JD006004, 2005.
25
Landgraf, J. and Crutzen, P. J.: An efficient method for online calculation of photolysis and heating rates, J. Atmos. Sci., 55, 863–878, 1998.
Lelieveld, J., Peters, W., Dentener, F. J., and Krol, M. C.: Stability of tropospheric hydroxyl chemistry, J. Geophys. Res., 107, 4715, doi:10.1029/2002JD002272, 2002.
Lee, Y. N., Zhou, X. L., and Hallock, K.: Atmospheric carbonyl compounds at a rural
southeast-30
ern United States site, J. Geophys. Res.-Atmos., 100, 25 933–25 944, 1995.
Liggio, J., and McLaren, R.: An optimized method for the determination of volatile and semi-volatile aldehydes and ketones in ambient particulate matter, Int. J. Environ. An. Ch., 83,
ACPD
8, 1673–1708, 2008 Secondary sources and distribution of glyoxal S. Myriokefalitakis et al. Title Page Abstract Introduction Conclusions References Tables Figures ◭ ◮ ◭ ◮ Back CloseFull Screen / Esc
Printer-friendly Version
Interactive Discussion
EGU
819–835, 2003.
Liggio, J., Li, S. M., and McLaren, R.: Heterogeneous reactions of glyoxal on particulate matter identification of acetals and sulfate esters, Environ. Sci. Technol., 39, 1532–1541, 2005a. Liggio, J., Li, S. M., and McLaren, R.: Reactive uptake of glyoxal by particulate matter, J.
Geophys. Res., 110, D10304, doi:10310.11029/2004JD005113, 2005b.
5
Lim, H. J., Carlton A. G., and Turpin, B. J.: Isoprene forms secondary organic aerosol through cloud processing: Model simulations, Environ. Sci. Technol., 39, 4441–4446, 2005.
Loeffler, K. W., Koehler, C. A., Paul, N. M., and de Haan, D. O.: Oligomer Formation in Evapo-rating Aqueous Glyoxal and Methyl Glyoxal Solutions, Environ. Sci. Technol., 40, 6318–6323, 2006
10
Matsunaga, S., Mochida, M., and Kawamura, K.: Growth of organic aerosols by biogenic semi-volatile carbonyls in the forestal atmosphere, Atmos. Environ., 37, 2045–2050, 2003. Moortgat, G. K., Grossmann, D., Boddenberg, A., Dallmann, G., Ligon, A. P., Turner, W. V.,
Gab, S., Slemr, F., Wieprecht, W., Acher, K., Kilber, M., Schlomski, S., Bachmann, K.: Hy-drogen Peroxide, Organic Peroxides and Higher Carbonyl Compounds Determined during
15
the BERLIOZ Campaign, J. Atmos. Chem. 42, 443–463, 2002.
Munger, J. W., Jacob, D. J., Daube, B. C., Horowitz, L. W., Keene, W. C., and Heikes B. G.: Formaldehyde, glyoxal, and methylglyoxal in air and cloudwater at a rural mountain site in central Virginia, J. Geophys. Res., 100, 9325–9334, 1995.
Olivier, J., Peters, J., Granier, C., Petron, G., Muller, J. F., and Wallens, S.: Present and Future
20
surface emissions of anthropogenic compounds, POET report #2, EU project EVK2-1999-00011, 2003.
Palmer, P. I., Jacob, D. J., Fiore, A. M., Martin, R. V., Chance, K., and Kurosu, T. P.: Map-ping isoprene emissions over North America using formaldehyde column observations from space, J. Geophys. Res., 108(D6), 4180, doi:10.1029/2002JD002153, 2003.
25
Poisson, N., Kanakidou, M., and Crutzen, P. J.: Impact of Non Methane Hydrocarbons on tropospheric chemistry and particular the oxidizing power of the global troposphere: 3-Dimensional Modelling results, J. Atmos. Chem., 36, 157–230, 2000.
Poisson, N., Kanakidou, M., Bonsang, B., Behmann, T., Burrows, J., G ¨olz, C., Harder, H., Lewis, A., Moortgat, G. K., Nunes, T., Pio, C., Platt, U., Sauer, F., Schuster, G., Seakins, P.,
30
Senzig, J., Seuwen, R., Trapp, D., Voltz-Thomas, A., Zenker, T., Zitzelberger, R.: The Impact of Natural NonMethane Hydrocarbon Oxidation on the Free Radical and Ozone budgets above a Eucalyptus forest, Chemosphere, Global Change Science, 3, 353–366, 2001.
ACPD
8, 1673–1708, 2008 Secondary sources and distribution of glyoxal S. Myriokefalitakis et al. Title Page Abstract Introduction Conclusions References Tables Figures ◭ ◮ ◭ ◮ Back CloseFull Screen / Esc
Printer-friendly Version
Interactive Discussion
Pope, C. A., and Dockery, D.W.: Health effects of fine particulate air pollution: Lines that con-nect, J. Air Waste Manage., 54, 709–742, 2006.
Ramanathan, V. and Crutzen, P. J.: New directions: Atmospheric brown “Clouds”, Atmos. Env-iron., 37, 4033–4035, 2003.
Sander, S.P., Ravishankara, A. R., Golden, D. M., Kolb, C. E, Kurylo, M. J., Molina, M. J.,
5
Moortgat, G. K., Finlayson-Pitts, B. J., Wine, P. H., Huie, R. E.: Chemical Kinetics and Photochemical Data for Use in Atmospheric Studies Evaluation Number 15, JPL Publication 06-2 (2006), available on the web athttp://jpldataeval.jpl.nasa.gov/, 2006.
Saxena, P. and Hildemann, L. M.: Water-Soluble Organics in Atmospheric Particles: A Critical Review of the Literature and Application of Thermodynamics to Identify Candidate
Com-10
pounds, J. Atmos. Chem., 24, 57–109, 1996.
Saunders, S. M., Jenkin, M. E., Derwent, R. G., and Pilling, M. J.: Protocol for the development of the Master Chemical Mechanism, MCM v3 (Part A): tropospheric degradation of non-aromatic volatile organic compounds, Atmos. Chem. Phys., 3, 161–180, 2003
Singh, H. B., Salas, L. J., Chatfield, R. B., Czech, E., Fried, A., Walega, J., Evans, M. J., Field,
15
B. D., Jacob, D. J., Blake, D., Heikes, B., Talbot, R., Sachse, G., Crawford, J. H., Avery, M. A., Sandholm, S., and Fuelberg, H.: Analysis of the atmospheric distribution, sources, and sinks of oxygenated volatile organic chemicals based on measurements over the Pacific during TRACE-P, J. Geophys. Res., 109, D15S07, doi:10.1029/2003JD003883, 2004.
Sinreich, R.: MAX-DOAS detection of glyoxal during ICARTT 2004, Atmos. Chem. Phys., 7,
20
1293–1303, 2007,
http://www.atmos-chem-phys.net/7/1293/2007/.
Shindell, D. T., Faluvegi, G., Stevenson, D. S., Emmons, L. K., Lamarque, J. F., Petron G., Dentener, F. J., Ellingsen K., Eskes, H., and van Noije, T. P. C.: Multi-model simulations of carbon monoxide: Comparison with observations and projected near-future changes, J.
25
Geophys. Res., 111, D19306, doi:10.1029/2006JD007100, 2006.
Sorooshian, A., Lu, M. L., Brechtel, F. J., Jonsson, H., Feingold, G., Flagan, R. C., and Seinfeld, J. H.: On the source of organic acid aerosol layers above clouds, Environ. Sci. Technol., 41, 4647–4654, 2007.
Spaulding, R. S., Schade, G. W., Goldstein, A. H., and Charles, M. J.: Characterization of
30
secondary atmospheric photoxidation products: Evidents for biogenic and anthropogenic sources, J. Geophys. Res., 108(D8), 4247, doi:10.1029/2002JD002478, 2003.
Multi-ACPD
8, 1673–1708, 2008 Secondary sources and distribution of glyoxal S. Myriokefalitakis et al. Title Page Abstract Introduction Conclusions References Tables Figures ◭ ◮ ◭ ◮ Back CloseFull Screen / Esc
Printer-friendly Version
Interactive Discussion
EGU
model ensemble simulations of present-day and near-future tropospheric ozone. J. Geophys. Res., 111, D08301, doi:10.1029/2005JD006338, 2006.
Tadi`c, J., Moortgat, G. K., and Wirtz, K.: Photolysis of glyoxal in air, J. Photoch. Photobiol. A, 177, 116–124, 2006.
Tsigaridis, K. and Kanakidou, M.: Global modeling of secondary organic aerosol in the
tropo-5
sphere: a sensitivity analysis, Atmos. Chem. Phys. 3, 1849–1869, 2003.
Tsigaridis, K., Krol, M., Dentener, F. J., Balkanski Y., Lathiere J., Metzger S., Hauglustaine, D. A., and Kanakidou, M.: Change in global aerosol composition since preindustrial times, Atmos. Chem. Phys., 6, 5143–5162, 2006,
http://www.atmos-chem-phys.net/6/5143/2006/.
10
Tsigaridis, K. and Kanakidou, M.: Secondary organic aerosol importance in the future atmo-sphere, Atmos. Environ, doi:10.1016/j.atmosenv.2007.03.045, 2007.
van Noije, T. P. C., van Eskes, H. J., van Weele, M., and van Velthoven, P. F. J.: Implications of the enhanced Brewer-Dobson circulation in European Centre for Medium-Range Weather Forecasts reanalysis ERA-40 for the stratosphere-troposphere exchange of ozone in global
15
chemistry transport models, J. Geophys. Res., 109, D19308, doi:10.1029/2004JD004586, 2004.
van Noije, T. P. C. van Eskes H. J., Dentener, F. J., Stevenson, D. S., Ellingsen, K., Schultz, M. G., and Wild, O.: Multi-model ensemble simulations of tropospheric NO2 compared with GOME retrievals for the year 2000, Atmos. Chem. Phys., 6, 2943–2979, 2006,
20
http://www.atmos-chem-phys.net/6/2943/2006/.
Velasco, E., Lamb, B., Westberg, H., Allwine, E., Sosa, G., Arriaga-Colina, J. L., Jobson, B. T., Alexander, M. L., Prazeller, P., Knighton, W. B., Rogers, T. M, Grutter, M. Herndon, S. C., Kolb, C. E., Zavala, M., de Foy, B., Volkamer, R., Molina, L. T., and Molina, M. J.: Distribution, magnitudes, reactivities, ratios and diurnal patterns of volatile organic compounds in the
25
Valley of Mexico during the MCMA 2002 & 2003 field campaigns, Atmos. Chem. Phys., 7, 329–353, 2007,
http://www.atmos-chem-phys.net/7/329/2007/.
Volkamer, R., Platt, U., and Wirtz, K.: Primary and secondary glyoxal formation from aromatics: experimental evidence for the bicycloalkyl-radical pathway from benzene, toluene, and
p-30
xylene, J. Phys. Chem. A, 105, 7865–7874, 2001.
Volkamer, R., Barnes, I., Platt, U., Molina, L. T., and Molina, M. J.: Remote Sensing of Gly-oxal by Differential Optical Absorption Spectroscopy (DOAS): Advancements in simulations
ACPD
8, 1673–1708, 2008 Secondary sources and distribution of glyoxal S. Myriokefalitakis et al. Title Page Abstract Introduction Conclusions References Tables Figures ◭ ◮ ◭ ◮ Back CloseFull Screen / Esc
Printer-friendly Version
Interactive Discussion
champers and field experiments, paper presented at Advanced Research Workshop on En-vironmental Simulation Chambers: Application to Atmospheric Chemical Processes, NATO, Zakopane, Poland, 1–4 October, 2005a.
Volkamer, R., Molina, L. T., Molina, M. J., Shirley, T., and Brune, W. H.: DOAS measurement of glyoxal as an indicator for fast VOC chemistry in urban air, Geophys. Res. Lett., 32, L08806,
5
doi:10.1029/2005GL022616, 2005b.
Volkamer, R., Spietz, P., Burrows, J., Platt U.: High-resolution absorption cross-section of gly-oxal in the UV–vis and IR spectral ranges, J. Photoch. Photobiol. A, 172, 35–46, 2005c. Volkamer, R., Jimenez, J. L, Martini, F. S., Dzepina, K., Zhang, Q., Salcedo, D., Molina, L.
T., Worsnop, D. R., and Molina, M. J.: Secondary organic aerosol formation from
anthro-10
pogenic air pollution: Rapid and higher than expected, Geophys. Res. Lett., 33, L17811, doi:10.1029/2006GL026899, 2006a.
Volkamer, R., Kurosu, T. P., Chance, K., Li, Z., Zhang, Y., Brauers, T., and Wahner, A.: Spatial Variability of Glyoxal, HCHO and NO2 during PRD-2006: Comparison of mobile Mini-MAX-DOAS and OMI satellite data in the Pearl River Delta, China. Eos Trans. AGU, 87(52), Fall
15
Meet. Suppl., Abstract A31B-0897, 2006b.
Volkamer, R., San Martini, F., Salcedo, D., Molina, L. T., Jimenez, J. L., and Molina, M. J.: A Missing Sink for Gas-Phase Glyoxal in Mexico City: Formation of Secondary Organic Aerosol, Geophys. Res. Lett., 34, L19807, doi:10.1029/2007GL030752, 2007a.
Vountas, M., Dinter, T., Bracher, A., Burrows, J. P., and Sierk, B.: Spectral studies of ocean
wa-20
ter with space-borne sensor SCIAMACHY using Differential Optical Absorption Spectroscopy (DOAS), Ocean Sci., 3, 429–440, 2007,
http://www.ocean-sci.net/3/429/2007/.
Vrekoussis, M., Kanakidou, M., Mihalopoulos, M., Crutzen, P. J., Lelieveld, J., Perner, D., Berresheim, H., and Baboukas, E.: Role of the NO3 radicals in oxidation processes in the
25
eastern Mediterranean troposphere during the MINOS campaign, Atmos. Chem. Phys., 4, 169–182, 2004,
http://www.atmos-chem-phys.net/4/169/2004/.
Wittrock, F., Oetjen, H., Richter, A., Fietkau, S., Medeke, T., Rozanov, A., and Burrows, J. P.: MAX-DOAS measurements of atmospheric trace gases in Ny-Alesund-Radiative transfer
30
studies and their application, Atmos. Chem. Phys., 4, 955–966, 2004,
http://www.atmos-chem-phys.net/4/955/2004/.
ACPD
8, 1673–1708, 2008 Secondary sources and distribution of glyoxal S. Myriokefalitakis et al. Title Page Abstract Introduction Conclusions References Tables Figures ◭ ◮ ◭ ◮ Back CloseFull Screen / Esc
Printer-friendly Version
Interactive Discussion
EGU
R., Beirle, S., Platt, U., and Wagner, T.: Simultaneous Global Observations of Glyoxal and Formaldehyde from Space, Geophys. Res. Lett., 33, L16804, doi:10.1029/2006GL026310, 2006.
Wesely, M. L.: Parameterization of surface resistances to gaseous dry deposition in regional scale numerical models, Atmos. Environ., 23, 1293–1304, 1989.
ACPD
8, 1673–1708, 2008 Secondary sources and distribution of glyoxal S. Myriokefalitakis et al. Title Page Abstract Introduction Conclusions References Tables Figures ◭ ◮ ◭ ◮ Back CloseFull Screen / Esc
Printer-friendly Version
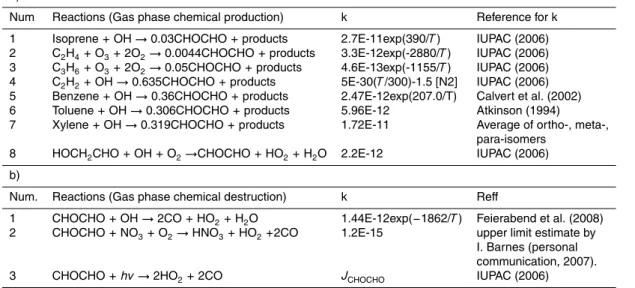
Interactive Discussion Table 1. Reactions taken into account in the TM4 model for CHOCHO production and
destruc-tion and references for the rate constants adopted in the model.
a)
Num Reactions (Gas phase chemical production) k Reference for k 1 Isoprene + OH → 0.03CHOCHO + products 2.7E-11exp(390/T ) IUPAC (2006) 2 C2H4+ O3+ 2O2→ 0.0044CHOCHO + products 3.3E-12exp(-2880/T ) IUPAC (2006)
3 C3H6+ O3+ 2O2→ 0.05CHOCHO + products 4.6E-13exp(-1155/T ) IUPAC (2006)
4 C2H2+ OH → 0.635CHOCHO + products 5E-30(T /300)-1.5 [N2] IUPAC (2006) 5 Benzene + OH → 0.36CHOCHO + products 2.47E-12exp(207.0/T) Calvert et al. (2002) 6 Toluene + OH → 0.306CHOCHO + products 5.96E-12 Atkinson (1994) 7 Xylene + OH → 0.319CHOCHO + products 1.72E-11 Average of ortho-, meta-,
para-isomers 8 HOCH2CHO + OH + O2→CHOCHO + HO2+ H2O 2.2E-12 IUPAC (2006)
b)
Num. Reactions (Gas phase chemical destruction) k Reff
1 CHOCHO + OH → 2CO + HO2+ H2O 1.44E-12exp(−1862/T ) Feierabend et al. (2008)
2 CHOCHO + NO3+ O2→ HNO3+ HO2+2CO 1.2E-15 upper limit estimate by
I. Barnes (personal communication, 2007). 3 CHOCHO + hv → 2HO2+ 2CO JCHOCHO IUPAC (2006)