A photometric study of the Carina nebula region
around WR 22
Brajesh Kumar
1,2, Jean Manfroid
1, Eric Gosset
1,
Gregor Rauw
1, and Manash R. Samal
21 Institut d’Astrophysique et de G´eophysique, Universit´e de Li`ege,
All´ee du 6 Aoˆut 17, Bˆat B5c, 4000 Li`ege, Belgium
2 Aryabhatta Research Institute of Observational Sciences, Manora Peak,
Nainital, 263 129, India
Abstract: We performed the first photometric observations of a field situated around WR 22 in the Carina nebula region. We present and discuss the preliminary results of the study.
1
Introduction
The Carina nebula (NGC 3372) in the Southern hemisphere, is one of the largest and brightest nebulae in our Galaxy. It provides a natural laboratory not only for the formation of the star clusters but also for the birth and the evolution of young and massive stars. To determine various properties of the stellar population in this region, extensive studies of several clusters and/or star concentrations have already been performed (Trumpler 14, 15 and 16; Collinder 228 and 232; Bochum 10 and 11, see Massey & Johnson 1993, Vazquez et al. 1996, Carraro & Patat 2001, DeGioia-Eastwood et al. 2001, Patat & Carraro 2001, Tapia et al. 2003, Carraro et al. 2004). This prominent structure is not as compact as some of the other galactic young clusters, but it provides a snapshot of the evolution of massive Population I stars and of their surroundings.
Here we deal with a less studied wide field (340x 330) around the very massive Wolf-Rayet binary
WR 22 (α(J2000) = 10h 41m 17.5s, δ(J2000) = −59◦ 400 36.900) located to the west side of the main
part of the Carina nebula. Difficulties in the study of the Carina region arise from the differential extinction and the possibly peculiar reddening law (see Walborn 1995). This leads to some uncertain-ties on the derived distance. In this work, we adopt a distance of 2.7 kpc (DM = 12.15) and a colour
excess EB−V = 0.36 following Gosset et al. (2009).
2
Observations and data analysis
The photometric observations of the WR 22 field were obtained with the Wide Field Imager (WFI) instrument at the ESO/MPG 2.2m telescope at La Silla in May 2005 with a total exposure time of 3h
and flat fielded using the IRAF mscred and esowfi packages. Zero points were estimated from the above mentioned photometric studies (Vazquez et al. 1996, DeGioia-Eastwood et al. 2001, Tapia et al. 2003, Carraro et al. 2004). To convert the WFI photometry into the standard Johnson-Cousins system, we used colour transformations derived from our observations of Landolt and Stetson standard fields,
supplemented by the relations published by ESO on the WFI instrument website1. The Hα data were
left in the natural system, with a zero-point arbitrarily defined by the R standards. To build the near-infrared (NIR) J, H, K colour-colour diagram, we have cross-correlated our photometric data with the
2MASS catalogue2.
Figure 1: False colour image of the region around WR22. The RGB image was built by combining the U and B as the Blue channel, V as Green, and R, I, Hα as Red. The complex structure of the nebulosity is remarkable.
The same field was observed with the XMM-Newton observatory (Jansen et al. 2001) during seven 1http://www.eso.org/sci/facilities/lasilla//instruments/wfi/inst/zero-points/ColorEquations
pointings with exposure times of 10ks. In addition to the star WR 22 itself (see the study of Gosset et al. 2009), 42 X-ray sources were detected (Claeskens et al. 2011). Their positions have been cross-correlated with the list of sources detected in our photometric data in order to identify these X-ray sources.
3
Results
Figure 1 is a false color image that we built by combining the various WFI pointings. It illustrates the field covered by our photometry. Besides the large stellar population, the nebular component is particularly remarkable and highly structured.
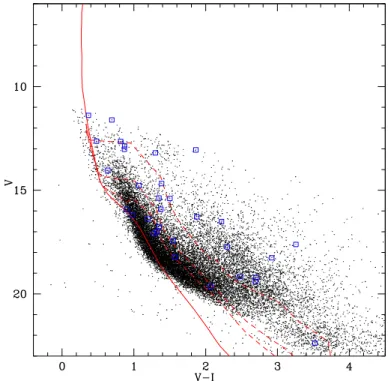
In Fig. 2 we show the colour-magnitude diagram of all the sources in the field of view (having JHK counterparts), along with the main-sequence and pre-main sequence (PMS) isochrones from
Siess, Dufour & Forestini (2000) for a distance of 2.7 kpc and an extinction giving EB−V = 0.36. As
can be seen many of the objects actually fall well above the main sequence, although there is probably a strong contamination by foreground stars. Most of the X-ray sources are found to be located above the main sequence, in agreement with the idea that these objects are most likely low-mass PMS stars with ages of a few million years or more distant objects. According to our photometry, the X-ray source #20 of Claeskens et al. (2010) has magnitudes V = 13.06, B−V = 1.41, U−B = −0.16, V−I
= 1.86. These values are in good agreement with an O star reddened by AV ∼ 4-5. This confirms the
identification proposed by Claeskens et al. (2010). The identification for all the sources is in progress.
Figure 2: Colour-magnitude diagram of the WFI photometry for the region around WR22. The X-ray sources are highlighted by open square symbols. The PMS isochrones from Siess et al. (2000) are shown for the ages of 1Myr, 5Myr and 10Myr.
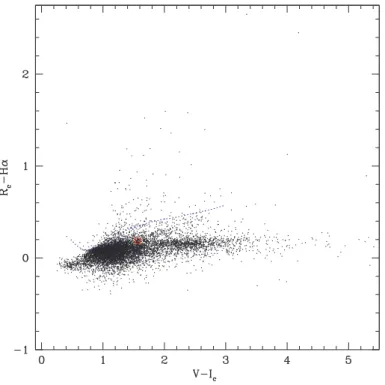
In Fig. 3 we show the R−Hα index as a function of the V−Ic colour. Large positive values of
the R−Hα index indicate a strong emission in this line. To fix ideas, we draw a line representing the expected value of the index for main sequence stars (see Sung, Bessell & Lee 1997), but shifted by
about 0.3 magnitude. Therefore all the objects confirmed to belong to the Carina region, appearing over this line are almost surely Hα emitters. The red open square represents the location of the X-ray source #18 (Claeskens et al. 2010). Its R−Hα index amounts to 0.19 suggesting the source having Hα in emission; this confirms the identification reported by Claeskens et al. (2010) with an object exhibiting lines in emission from Hβ to Hδ.
Figure 3: The Rc−Hα index is shown as a function of V−Ic. The dotted blue line (calibrated
accord-ing to Sung et al. 1997) indicates the thresholds for Hα emitter candidates for the objects belongaccord-ing to the Carina region. The counterpart of the X-ray source #18 (Claeskens et al. 2010) is highlighted by the red open square.
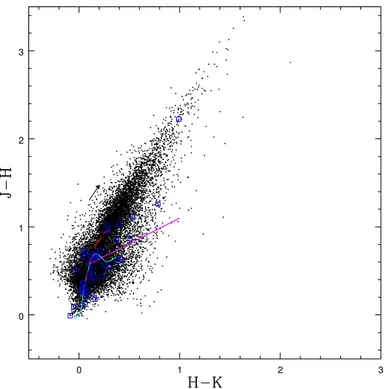
Fig. 4 shows the NIR colour-colour diagram for the studied region. This figure reveals a severe contamination of the cluster photometric data by the field stars. At the same time, it also shows a strong reddening gradient in the particular region. This suggests that we are observing a cluster at the edge of a molecular cloud, with some of the stars being located deeper inside the cloud. Whilst some of the X-ray sources have NIR counterparts that are consistent with a moderate reddening, a few X-ray selected objects are obviously subject to a rather substantial extinction.
4
Future work
As a next step, we will combine the NIR and WFI photometry to infer the reddening of individual sources and finally build a Hertzsprung-Russell diagram for the stellar population in this region allow-ing us to derive the age of the population and to identify the PMS stars. This photometry will further help in our on-going identification process of the different X-ray sources detected in this region.
0 1 2 3 0
1 2 3
Figure 4: NIR colour-colour diagram of the studied region. The locus of the main-sequence and of the giant branch are shown by cyan and red curves, whilst the magenta straight line yields the locus of unreddened T Tauri stars as given by Meyer, Calvet & Hillenbrand (1997). The counterparts of the X-ray sources are highlighted by the blue open squares.
References
Carraro, G., & Patat, F. 2001, A&A, 379, 136
Carraro, G., Romaniello, M., Ventura, P., & Patat, F. 2004, A&A, 418, 525
Claeskens, J.-F., Gosset, E., Naz´e, Y., Rauw, G., & Vreux, J.-M. 2011, A&A 525, A142 DeGioia-Eastwood, K., Throop, H., Walker, G., & Cudworth, K.M. 2001, ApJ, 549, 578 Gosset, E., Naz´e, Y., Sana, H., Rauw, G., & Vreux, J.-M. 2009, A&A, 508, 805
Jansen, F., Lumb, D., Altieri, B., et al. 2001, A&A, 365, L1 Massey, P., & Johnson, J. 1993, AJ, 105, 980
Meyer, M.R., Calvet, N., & Hillenbrand, L.A. 1997, AJ, 114, 288 Patat, F., & Carraro, G. 2001, MNRAS, 325, 1591
Siess, L., Dufour, E., & Forestini, M. 2000, A&A, 358, 593 Sung, H., Bessell, M.S., & Lee, S.-W. 1997, AJ, 114, 2644
Tapia, M., Roth, M., V´azquez, R.A., & Feinstein, A. 2003, MNRAS, 339, 44 Vazquez, R.A., Baume, G., Feinstein, A., & Prado, P. 1996, A&A, 116, 75 Walborn, N.R. 1995, RevMexAA (Serie de Conferencias), 2, 51