RECENT ADVANCES IN BLOOD ANALYSES OF POPs
Brasseur C, L’Homme B, Focant JF
CART, Organic and Biological Analytical Chemistry, Department of Chemistry, University of Liège, Allée du 6 août B6c, 4000 Liège, Belgium.
e-mail: JF.Focant@ulg.ac.be Introduction
Biological monitoring (biomonitoring) can be defined as the assessment of internal dose exposure by measuring a toxicant (or its metabolites or reaction products) in human blood, urine, saliva, adipose, or other tissue. This approach is usually preferred over environmental monitoring for assessing human exposure because the later only provides data on the amount of toxicants that have been released and to which a population might have been exposed at different levels.1 By-passing the exposure assessment step by directly measuring internal doses via analysis of biological specimens thus reduces the number of uncertainties in assessing health effects of toxicants.2
Persistent bioaccumulative toxicants are highly lipophilic compounds that have long biological half-lives and are retained in adipose tissues. Equilibration of the lipophilic toxicants takes place between the lipids in adipose tissue and blood.3 The primary matrix used for biomonitoring of persistent toxicants is blood and, more specifically, serum - typically, 5-75mL of whole blood are sampled from patients. Even if much less invasive than the classical surgical abdominal fat removals that were performed in the 1980’s, the venipunction of several milliliters of whole blood for analytical purpose is still badly perceived by patients. Therefore, minimizing sample sizes and enlarging the list of measured analytes is important. Recent advances are continuously made in both directions.
Firstly, efforts are made to develop and miniaturize an analytical strategy based on cryogenic zone compression (CZC)4 of chromatographic signals for the analysis of selected POPs (PCB-153 and DDE) in 20µL whole blood. The method can be considered as (almost) non-invasive since samples are simply prepared by pricking the heel or the finger to collect a few drops of blood on a high purity cotton filter paper and let it dry to form a dried-blood spot (DBS).5 The procedure can partially be automatized using micro-extraction by packed sorbent (MEPS) for sample preparation and a GC×GC high-resolution (HR) time-of-flight (TOF) mass spectrometer (MS) for fast analysis. MEPS extraction, which is the key part of the development, lead to good quality spectra without further clean up. The miniaturization is significant, with total amount of solvent reduced to 500µL.
Secondly, strategies have been developed to separate and measure unusual flame retardants6 in regular volumes of serum. We used GC-HRMS analysis to detect and quantify Dechlorane Plus (DP), Dechlorane (Dec) 602, Dec 603, Dec 604 and Chlordene Plus (CP) with isotopic dilution, as well as Mirex and PBDEs. The aim was to provide an overview of the contamination pattern of these compounds in human, and especially in a region of the world where levels have not yet been estimated.
Material and methods
For low volume samples QC serum samples were used. 13C-labeled DDE and PCB-153 at
10pg/µL each were used as internal standards (IS). The recovery standard was a solution of
13
C-labeled PCB-80 at 20pg/µL. Standards of indicator PCBs (#28, 52, 101, 138, 153, 180, 209) were used for calibration. Solvents (formic acid, methanol, hexane, dichloromethane and acetone) were all GC grade. Syringes and sorbent for MEPS analysis were provided by SGE.
Filter papers used for DBS were provided by Perkin Elmer. They were prepared by pipeting a finite amount of serum or blood. They are then dried in air for several hours, stored at room temperature in zip-closing plastic bags and then extracted using various solvents. Measurements were carried out on a JEOL AccuTof T100GC. The GC oven (Agilent 6890) was
equipped with a Zoex ZX1 - LN2 Cooled Loop Modulation GC x GC System. The 1D GC column
was an Restek Rxi-XLB (30 m x 0.25 mm ID x 0.25 µm df). The 2D GC column was an Restek
Rxi-17 (1.5 m x 0.25 mm ID x 0.25 µm df). The instrument was operated either in negative chemical ionization (NCI) mode or electron ionization (EI) mode. A recording interval of 0.04s (25Hz) and a detector voltage of 2300V were used. The mass accuracy of the instrument was ensured by frequent single point calibration checks.
For measuring emerging flame retardants, French human serum samples (n=48) were used. All standards were from Cambridge Isotope Laboratories or Wellington Laboratories. Others chemicals and solvents used were of analytical grade. Sample sizes of 10g were extracted using solid-phase extraction (SPE) on non-endcapped C18 cartridges (1g/6mL). Samples were analyzed with a high resolution sector mass spectrometer Thermo MAT95 XL connected by a heated transfer line (275°C) to a CE Trace gas chromatograph (ThermoQuest) equipped with a A2000S autosampler (Thermo). The GC column was a Phenomenex ZB-5 (15m x 0.25mm I.D., 0.25 µm df). The ion source temperature was 250°C and Electron Impact (EI) ionization was performed with 70eV. The HRMS instrument was operated in the selected ion monitoring (SIM) mode. Two ions were monitored for both native and labeled isotope ratio check. Calibration stability was ensured by injecting both low and high levels points of the calibration curve every 20 samples. Both instrumental and procedural blanks were monitored.
Results and Discussion
Measurement of PCB-153 and DDE in DBS
Two calibration curves were recorded: for DDE and for PCB-153, and the working zone ranged from 50fg to 10pg. 6 calibration points (triplicates) gave a R2 of 0.99842 for PCB-153 and 0.96821 for DDE.
MEPS were performed automatically on a CTC autosampler. Practically, the sorbent (0.5-2mg) is included inside the needle of the syringe and can be used many times for different samples before being replaced. Solvents and samples are pumped and released sequentially through the sorbent in the syringe (several times if needed). The sequence was developed and optimized during this study and consists in 6 steps as illustrated in Figure 1. Liquid serum samples were extracted with good success in 20 minutes. This method has shown recoveries of 40% and cleaner spectrums than with LLE. In addition, extractions were automatized and were less subject to environmental contamination than liquid-liquid extraction since all solutions remain in capped vials or in the MEPS syringe. The total volume of solvent required for the extraction was as low as 500 µL. MEPS sorbents are designed to be used several times but should rather be considered as disposable since they are subject to carry over and therefore require proper and time consuming washings between uses.
The use of CZC allows a gain in intensity of about 10 times between modulated and non modulated peaks at 25Hz and 2Hz acquisition rate, respectively. The instrumental limit of detection (iLOD) was 20fg/µL for PCB-153 (S/N=11), and 2pg/µL for DDE (S/N=10) using M+2 ion. We reached iLOD of 40fg/µL for DDE (S/N=10) using chlorine ion. Typical levels in blood are respectively 100ng/g fat and 20ng/g fat for PCB-153 and DDE. In 20µL DBS, we thus need an iLOD in the order of 10pg and 2pg for those compounds. We can assume we would be able to quantify those targets in most real samples. Figure 2 shows NCI mass chromatograms of targets compounds and 13C labeled isotopes for quantification for samples extracted by the MEPS procedure. PCB-153 was quantified on the basis of the molecular ion and DDE was quantified either on the basis of molecular ion or chlorine ion. In this case, DDE can be identified using the two tR provided by GC×GC. Accuracy was always below 10% relative error.
ME P S Sample Dilution with formic acid 20% Sample
ME P S Loading 50 times on C18 column ME P S
Wash 4 times with water (4x100µL)
ME P S Hexane/ DCM 70:30 Collect Elution with 2x25µL organic mixture (5µL/s) Cleaning/ conditioning
with water and methanol
Figure 1: Scheme of DBS analysis by CZC-HRTOFMS
Native DDE
Labeled DDE
Native hx-PCB
Labeled hx-PCB
Figure 2: Chromatogram of CZC-HRTOFMS signals for isotope dilution measurement of PCB-153 and DDE
Blanks levels were found in the range of 2-10pg/20µL DBS when using MEPS extraction whereas typical natural contamination levels were in the range of 10-50pg/20µL DBS. We therefore reach the limit where blanks levels are in the same order than natural samples. It is however important to say that no average blank value was taken into account but each individual sample was analyzed with its own paired blank for more accuracy.
Measurement of flame retardants in serum
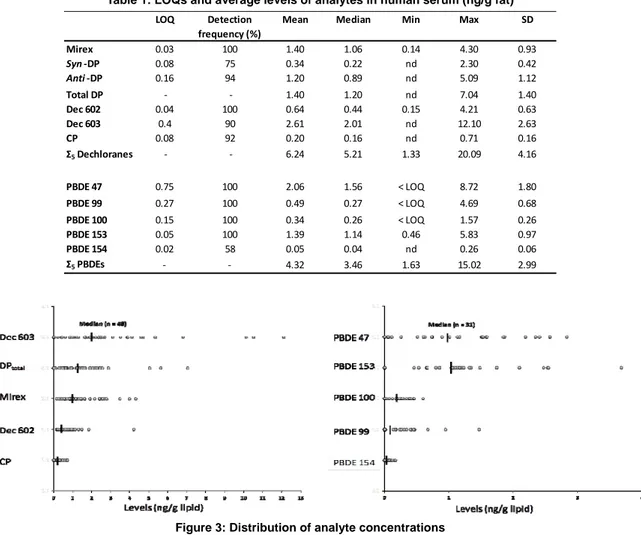
Levels of DP, Dec 602, Dec 603, Dec 604, CP, and Mirex of general French population are reported in Table 1 with their LOQs. Figure 3 shows the level distribution for each analyte and compares to levels of PBDEs.
Table 1: LOQs and average levels of analytes in human serum (ng/g fat)
LOQ Detection Mean Median Min Max SD
frequency (%) Mirex 0.03 100 1.40 1.06 0.14 4.30 0.93 Syn ‐DP 0.08 75 0.34 0.22 nd 2.30 0.42 Anti ‐DP 0.16 94 1.20 0.89 nd 5.09 1.12 Total DP ‐ ‐ 1.40 1.20 nd 7.04 1.40 Dec 602 0.04 100 0.64 0.44 0.15 4.21 0.63 Dec 603 0.4 90 2.61 2.01 nd 12.10 2.63 CP 0.08 92 0.20 0.16 nd 0.71 0.16 Σ5 Dechloranes ‐ ‐ 6.24 5.21 1.33 20.09 4.16 PBDE 47 0.75 100 2.06 1.56 < LOQ 8.72 1.80 PBDE 99 0.27 100 0.49 0.27 < LOQ 4.69 0.68 PBDE 100 0.15 100 0.34 0.26 < LOQ 1.57 0.26 PBDE 153 0.05 100 1.39 1.14 0.46 5.83 0.97 PBDE 154 0.02 58 0.05 0.04 nd 0.26 0.06 Σ5 PBDEs ‐ ‐ 4.32 3.46 1.63 15.02 2.99
Figure 3: Distribution of analyte concentrations
This study is the first report of dechloranes compounds in European human serum. DP as well as others related dechloranes were detected, while no production source has been identified yet in Europe. The hypothesis of long term transport has to be considered. A specific pattern of contamination was found, and Dec 603 was reported with high levels, compared to others biota samples that have been analyzed from Europe. The results demonstrated that bioaccumulation properties should be taken in consideration additionally to contamination and exposure when evaluating risk for human.
Conclusions
Those results demonstrate the feasibility of analyzing selected POPs in small sample amount including human dried-blood spots. More data on levels of Dechloranes in human are needed. References
1. Sexton K et al. Am Sci, 2004; 92: 38-45.
2. Pirkle JL et al. J Expos Anal Environ Epidem, 1995; 5: 405-424.
3. Patterson DG et al. Arch Environ Contam Toxicol 1988; 17: 139-143.
4. Patterson DG et al. J Chromatogr A, 2011; 1218: 3274–3281.
5. Turner RC and Holman RR. Lancet, 1978; 312: 712. 6. Feo ML et al. Anal Bioanal Chem, 2012; 404: 2625-2637.