Publisher’s version / Version de l'éditeur:
Vous avez des questions? Nous pouvons vous aider. Pour communiquer directement avec un auteur, consultez la
première page de la revue dans laquelle son article a été publié afin de trouver ses coordonnées. Si vous n’arrivez pas à les repérer, communiquez avec nous à [email protected].
Questions? Contact the NRC Publications Archive team at
[email protected]. If you wish to email the authors directly, please see the first page of the publication for their contact information.
https://publications-cnrc.canada.ca/fra/droits
L’accès à ce site Web et l’utilisation de son contenu sont assujettis aux conditions présentées dans le site LISEZ CES CONDITIONS ATTENTIVEMENT AVANT D’UTILISER CE SITE WEB.
5th International Conference: Tunnels Fires [Proceedings], pp. 185-196, 2004-10-01
READ THESE TERMS AND CONDITIONS CAREFULLY BEFORE USING THIS WEBSITE.
https://nrc-publications.canada.ca/eng/copyright
NRC Publications Archive Record / Notice des Archives des publications du CNRC :
https://nrc-publications.canada.ca/eng/view/object/?id=994c1051-c7b4-4b1b-a920-d7df95b176ef https://publications-cnrc.canada.ca/fra/voir/objet/?id=994c1051-c7b4-4b1b-a920-d7df95b176ef
NRC Publications Archive
Archives des publications du CNRC
This publication could be one of several versions: author’s original, accepted manuscript or the publisher’s version. / La version de cette publication peut être l’une des suivantes : la version prépublication de l’auteur, la version acceptée du manuscrit ou la version de l’éditeur.
Access and use of this website and the material on it are subject to the Terms and Conditions set forth at Computational fluid dynamics simulations of in-situ fire tests in road tunnels
Computational fluid dynamics simulations of in-situ fire tests in road tunnels
Kashef, A.; Bénichou, N.; Lougheed, G.; Debs, A.
NRCC-45174
A version of this document is published in / Une version de ce document se trouve dans: 5th International Conference – Tunnels Fires, London, UK,
Oct. 25-27, 2004, pp. 185-196
COMPUTATIONAL FLUID DYNAMICS SIMULATIONS OF IN-SITU FIRE TESTS IN ROAD TUNNELS
Ahmed Kashef, Noureddine Benichou, Gary Lougheed, National Research Council of Canada
Alexandre Debs, Ministère des Transports du Québec, Canada
ABSTRACT
A research project is being conducted at the National Research Council of Canada (NRC) to evaluate the effectiveness in two road tunnels of the current emergency ventilation system (EVS) to control smoke spread in the event of a fire. The research study includes two phases; namely, a numerical and an experimental phase. The numerical phase uses CFD models to study smoke ventilation in the tunnel. The experimental phase is used to calibrate and partially verify the CFD models and to provide the necessary initial and boundary conditions.
The current paper presents the efforts to validate the CFD models using the test measurements conducted in one of the two investigated tunnels. The CFD model includes aerodynamically significant physical features of the tunnel and is customized to provide general roughness replicating the actual roughness in the tunnel.
1 INTRODUCTION
The first two stages of a project, being conducted at the NRC to evaluate the effectiveness of the current EVS to control smoke spread in the event of a fire in two road tunnels, have been completed. An extensive literature review on vehicle tunnels’ ventilation for fire safety was completed[1]. The review provided a rational basis for choosing two CFD numerical models for the initial evaluation. The two CFD models were Solvent[2] and Fire Dynamic Simulator (FDS)[3].
Airflow measurements and fire tests were then conducted in one of the two tunnels. The initial airflow measurements[4] were used to establish the ventilation scenarios for the fire tests and to provide input data for the CFD models.
This paper presents the results of Solvent simulations conducted to replicate the fire tests carried out in the first road tunnel. The CFD model includes aerodynamically significant physical features of the tunnel and is customized to provide general roughness replicating the actual roughness in the tunnel.
A clean-burning propane system that produces minimal smoke was developed for the in-situ fire tests. The heat output for the fire tests was limited to 2 MW to minimize damage to the tunnel. Artificial smoke was added for visualization purposes. Temperature and optical smoke density measurements were conducted at 80 locations downstream and upstream of the fire. Also, the air speed was measured at several locations along the tunnel.
1.1 Tunnel Ventilation System
The L.-H.-La Fontaine road tunnel (Figure 1), built in 1964, is located in Montreal, Quebec, Canada, and travels underwater in a North-South direction. The tunnel is 1.8 km long with three lanes in each direction, inside two concrete tubes. Two ventilation towers are located at the ends of the underwater section. A control and monitoring centre for the tunnel is located at the North tower. A central section separates the two tubes. Galleries located in this section are used to supply air along the tunnel length via openings distributed along the walls. These galleries can also be used as evacuation routes. Doors at various locations along the length of the tunnel provide access to the gallery and the other traffic tube. The wall openings have adjustable dampers to ensure uniformity of air distribution. The side vents are situated in two rows, upper and lower located at heights of 3.9 and 1.0 m above the tunnel floor, respectively, and at intervals of approximately 6 m. The two rows of vents are offset by 3 m.
N o r th
S o u th
S lo p e
Figure 1: General layout and ventilation system of the tunnel
The tunnel ventilation is provided by a semi-transverse system with local extraction points (Figure 1). The ventilation system is composed of 8 ceiling exhaust fans (4 fans for each roadway) and 8 fans that supply air through side vents uniformly distributed along one wall for each roadway. All fans can operate in reverse mode. Therefore, fresh air may be supplied at either the ceiling (fans VE-151 through VE-254), or by fans VA-101 through VA-204 through the side vents. In the exhaust mode, fans VE-151 through VE-254 can operate at 30 or 60 Hz, and in the supply mode they can only operate at 60 Hz. In the supply mode, fans VA-101 through VA-204 can operate at: 30, 40, or 60 Hz. In the exhaust mode, these fans can only operate at 60 Hz.
2 FIRE TESTS
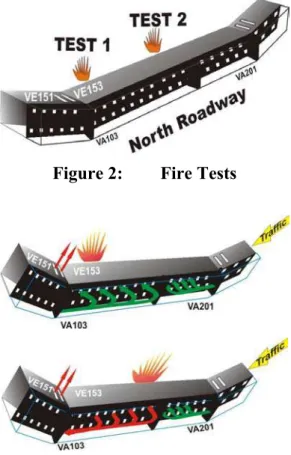
Fire tests were conducted using a propane burner system developed by NRC. Two fire tests were conducted in the North Roadway of the tunnel (Figure 2): one in the middle of the tunnel and one close to the exhaust fans at the North end of the tunnel. Two different EVS scenarios were activated for the two tests. For Test 1 (Figure 3), the EVS scenario used the two fans VE151 and VE153 in the exhaust mode and the two fans VA103 and VA201 in the supply mode. In Test 2 (Figure 3), a similar EVS scenario was activated except fan VA103, which was used in the exhaust mode.
Figure 2: Fire Tests
Figure 3: Fire Tests EVS scenarios
During the planning phase, the project team investigated several issues to develop the fire source for the in-situ fire tests. These issues included: fire source alternatives, fire size, test duration, tunnel safety and test logistics.
In order to simulate a fire, the heat source must produce a buoyant airflow. Therefore, the heat source must convert a substantial portion of the energy to heating the air to produce convective airflow. As such, cold smoke systems or electrical systems that produce primarily radiant heat are not applicable. Various clean-burning fuel arrangements, including alcohol pan fires, propane burners and oil-fuelled burners, were explored for this project. A clean-burning propane burner system that produces minimal smoke was developed for the in-situ fire tests (Figure 4). The burner was about 1.3 m wide and 1.83 m long. This system was a compact, portable and convenient heat source that is capable of producing up to 5 MW of heat output simulating a small car fire. Artificial smoke was used for visualization purposes with four smoke bombs added at 1 min intervals.
Figure 4: Propane burner
The fire size was selected so as to minimize damage to the tunnel structure and different components and to produce reliable data for the calibration and validation of the numerical models. Based on preliminary laboratory tests, CFD simulations as well as discussions with the tunnel authority and the local Fire Services, the heat output for the fire tests was limited to 2 MW. The objective was to limit the temperature at the tunnel ceiling below 100°C.
Other concerns considered during the planning stage included: ensuring that the smoke from the smoke bombs was well-mixed with the plume from the propane burner so as to produce hot
buoyant smoke; ensuring that the smoke was not recycled into the South Roadway that was open to traffic.
Initial flow measurement tests indicated that it took longer to clear the smoke with the fire located close to the mid-tunnel. Therefore, the fire test with the fire located close to the exhaust fans VE151 and VE153 preceded the second test where the fire was located at the middle of the tunnel.
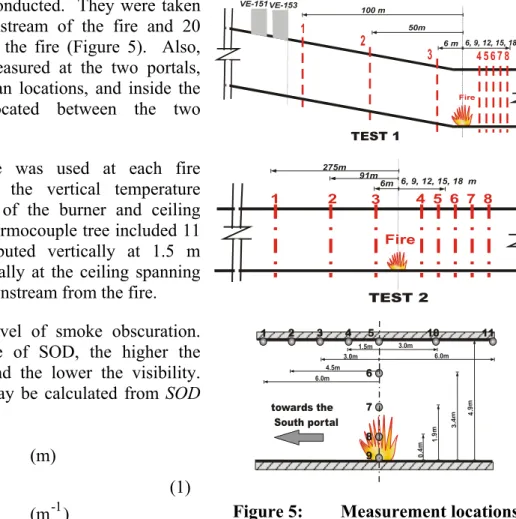
Temperature and smoke optical density (SOD) measurements were conducted. They were taken at 60 locations downstream of the fire and 20 locations upstream of the fire (Figure 5). Also, the air speed was measured at the two portals, mid-tunnel, exhaust fan locations, and inside the evacuation paths located between the two roadways.
A thermocouple tree was used at each fire location to measure the vertical temperature profile at the centre of the burner and ceiling temperatures. The thermocouple tree included 11 thermocouples, distributed vertically at 1.5 m intervals and horizontally at the ceiling spanning 6 m upstream and downstream from the fire.
SOD indicates the level of smoke obscuration. The higher the value of SOD, the higher the smoke obscuration and the lower the visibility. The visibility, VIS, may be calculated from SOD as follows[5]: ) (m (m) 1 SOD 303 . 2 : where K VIS = − = α α (1) 6, 9, 12, 15, 18 m 6m 91m 275m 6, 9, 12, 15, 18 m 1.5m 3.0m 6.0m 3.0m 6.0m 0 .4 m 1 .9 m 4 .9 m 11 9 8 7 6 5 4 3 2 1 10
Figure 5: Measurement locations
towards the South portal
4.5m
Where: α is the extinction coefficient, K is the proportionality constant (6 for illuminated signs, 2
for reflected signs and building components in reflected light), and VIS is the visibility in m.
The maximum ceiling temperature was approximately 50°C for Test 1 and 21°C for Test 2. The vertical temperature profiles at the fire locations were similar for the two tests. The maximum temperature was about 60oC measured at 0.4 m above the ground.
For both tests, the values of SOD were quite low upstream of the fire and the temperatures were at ambient temperature (about 20oC). These observations indicate that the EVS scenarios used in the tests created an airflow such that the hot smoke moved in the desired direction. That is, it moved from the South to the North in the traffic direction.
In general, close to the fire location, high SOD values were measured and as a result, the visibility was reduced. A few meters from the fire, the SOD decreased at a lower tunnel height
and the visibility was in the range of 12 m and higher. However, at locations further away from the fire, the SOD increased at lower elevations and visibility was reduced, especially during Test 2. Moreover, the reduced level of visibility extended, in the case of Test 2, further downstream of the fire location.
For Test 1, the smoke was pulled towards the ceiling (at exhaust fans VE151 and VE153) and, therefore, lower values of the SOD were observed and good visibility was maintained up to 3.0 m above the Roadway.
There were differences in the behaviour of cold smoke tests previously conducted in the tunnel[4] and the hot smoke in the current set of tests. During cold smoke tests, it was noted that when the smoke source was located close to the exhaust fans (similar to Test 1), the rate of smoke removal was higher with almost no side dispersion of smoke. However, with hot smoke tests, smoke was dispersed laterally and the rate of smoke clearance was lower. This confirms that only hot smoke tests should be used to evaluate the performance of ventilation systems.
It was concluded from the measured values for Test 2 that the ventilation system helped to control the temperatures and produce a high airflow velocity in the middle of the tunnel. However, most of the smoke was extracted through the sidewall vents. The visibility was reduced at a lower elevation downstream of the fire up to a distance of about 300 m. In addition, a dense layer of smoke was observed in the evacuation path limiting its use in this scenario. Moreover, it was observed that the smoke extracted through the side vents was recirculated into the other evacuation paths downstream of the exhaust fans.
3 NUMERICAL SIMULATIONS
Solvent was developed as a tunnel ventilation model that can simulate the interactive effects of a tunnel fire and the ventilation system to determine the tenable regions in the tunnel. The model is applicable to different ventilation modes, including longitudinal ventilation using jet fans, transverse ventilation, and natural ventilation[2].
Solvent is based on the general-purpose CFD code COMPACT-3D[6]. It employs the buoyancy-augmented k-ε model[7] to represent turbulent transport and includes component models for jet fans, ventilation ducts, fire, radiation heat transfer, and smoke. The SIMPLE algorithm is used to calculate the pressure field. The algebraic equations are solved using the line-by-line TriDiagonal-Matrix Algorithm supplemented by a block-correction procedure.
The wall boundary is treated using the wall function approach. The fire is represented as a source of heat and mass. The model does not simulate the combustion process. Instead, the heat release rate, due to combustion, is prescribed as a volumetric heat source in a postulated fire region.
The boundary conditions at the tunnel portals can be specified as inflow/outflow boundaries or as "free" boundaries with known values of pressure, depending on the physical situation being modelled. At an inflow boundary, values of all variables are specified. At an outflow boundary, the diffusion flux is assumed to be zero and the normal velocity components are adjusted to ensure the overall conservation of mass. The model also has provision for the introduction of entrance loss and differential pressures at the portals to represent wind effects.
3.1 Geometry and Boundary Conditions
Only the North Roadway of the tunnel and its galleries (Figure 6) were simulated with a mesh consisting of 465,696 control volumes (539 x 36 x 24). The mesh was refined around the vents, exhaust fans, fire source and tunnel portals. Two simulations were conducted to represent the ventilation scenarios used for both fire tests (Figure 5). The two simulations were conducted as a steady state heat release variable density simulation. Smoke was assumed to represent the products of
combustion. The smoke production rate was calculated as follows:
Figure 6: Propane burner
) s 1 ( m m fu smoke = & + & (2)
Where is the smoke production rate, is the fuel consumption rate, and s is the
stiochiometric air/fuel ratio.
smoke
m&
fu
m&
The fire was represented as a fluid region where mass, energy, and smoke sources were introduced. The model did not simulate the combustion process in the fire. A propane source, approximately 2.0 m long, 1.5 m wide and 0.7 m high was used to simulate the experimental fire source. The fire source with a heat output of 2 MW was placed at a distance of 335 m and 687 m from the North portal for Tests 1 and 2, respectively.
Fans VA103 and VA201 were simulated as mass sources or sinks depending on the ventilation scenario. For Test 1, both fans were introduced as mass sources. In the ventilation scenario used for Test 2, fan VA103 was represented as a mass sink. Free boundaries with the pressure equal to the static ambient pressure were assumed at the North and South portals. A wall roughness of 0.003 was assumed for the concrete wall
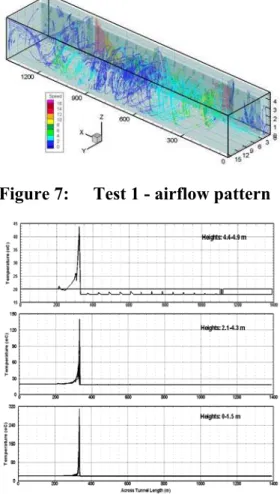
surface. Figure 7: Test 1 - airflow pattern
3.2 Test 1 Ventilation Scenario
In the ventilation scenario of Test 1, fresh air was supplied by fans VA101 and VA201 through the galleries and entered the tunnel roadway through the side vents. Smoke and hot gases were exhausted through ceiling fans VE151 and VE153. Fresh air was also drawn through the North and South portals. The resulting flow pattern is shown in Figure 7 and is represented by streamlines of the velocity vector field. The air supplied through the lower and upper side vents created regions of turbulent flow. Furthermore, the air from the larger upper vents had higher velocity than that from the lower vents, which resulted in more air
injected at the top of the tunnel. The air jets forced airflow downwards and created rotational movement of the air. As a result, only a small portion of the tunnel had a longitudinal airflow, near the two portals. These results are in agreement with the field observations that indicated low longitudinal air velocities at the middle section of the tunnel.
Figure 8 shows the temperature profiles along a longitudinal plane passing through the centreline of the tunnel roadway. Within a few meters upstream and downstream of the fire source, the temperatures were at ambient. The maximum temperature calculated was approximately 300oC at the fire site.
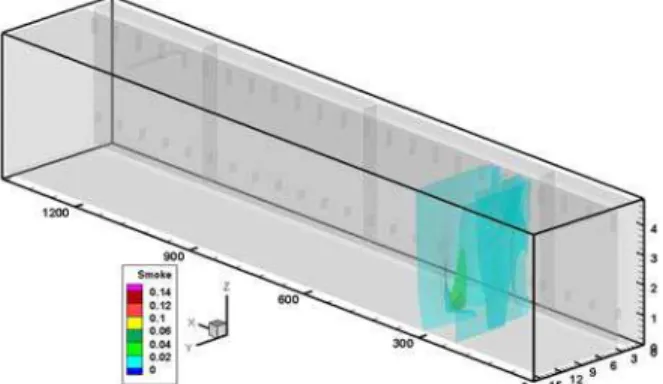
Figure 9: Test 1 – smoke iso-surfaces
Figure 9 shows the smoke fraction (kg smoke/kg air) iso-surfaces. The smoke produced at the fire location travels mainly downstream of the fire towards exhaust fans VE151 and VE153. Higher smoke concentrations were mainly located close to the fire. No smoke was observed in the galleries.
res
sur
re (
P
The main goal of the emergency ventilation
system is to provide and maintain a smoke-free path for safe evacuation. This tunnel uses the galleries for evacuation purposes in the event of a fire. It is important, therefore, to maintain a differential pressure between the tunnel environment and the evacuation passage that will ensure a “smoke-free” escape route. Thus, the pressure inside the ventilation gallery should always be higher than that in the tunnel to force airflow from the gallery into the tunnel. Figure 10 shows the bulk average total pressure across the tunnel roadway and evacuation paths (galleries). The results indicate that the bulk pressure in the gallery is higher than the pressure in the roadway throughout the tunnel length except for a small region adjacent to the North portal. However, the air drawn into the evacuation path in this region was free of smoke. Under these conditions, it is expected that most parts of the evacuation path would be smoke-free.
-60 -30 0 30 60 90 120 0 200 400 600
Lon gitu din al
P a) 800 1000 1200 1400 D istan ce (m) way uation Path
Figure 10: Test 1 – total pressure
Road Evac
3.3 Test 2 Ventilation Scenario
The airflow pattern and the resulting bulk flow for the Test 2 ventilation scenario is shown in Figure 11. The turbulent behaviour of the flow in the tunnel is still the dominant mode of smoke transport. The air speeds at mid-tunnel increased from almost zero (corresponding to Test 1) to more than 5.0 m/s.
Most of the smoke was extracted through the
scenario, the VA103 gallery could not be used for evacuation purposes. The result also indicates that the smoke mainly moved downstream of the fire leaving half of the tunnel upstream of the fire “smoke-free” (Figure 12).
The strong turbulent nature of the airflow adversely affected the rate of smoke clearance as can be seen from Figure 12 where the smoke iso-surfaces covered half of the tunnel downstream of the fire. However, the bulk smoke values for Test 2 were less than those in Test 1 (Figure 13). The average bulk smoke concentration in the galleries of VA103 was approximately 0.03 kg/kg.
Figure 12: Test 2 – smoke iso-surfaces
The turbulent effects, together with the higher airflow speeds, resulted in temperatures (Figure 14), lower than those observed in Test 1 at the fire location. This is in agreement with the measurements in the field tests.
Figure 15 shows the bulk average pressures across the tunnel roadway and evacuation paths (galleries). The results indicate that the bulk pressure in the gallery upstream of the fire is larger than the pressure in the roadway, indicating that these evacuation paths would be smoke-free. On the other hand, in the gallery for ventilation fan VA103, the pressure was about ten times lower than the pressure in the roadway, resulting in the smoke being exhausted by fan VA103. However, at a distance of approximately 200 m from the fire, the pressure in the gallery was higher than that in the adjacent roadway. As a result, the smoke in the gallery re-entered the roadway.
0.00 0.05 0.10 0.15 0.20 0.25 0.30 0 20 0 40 0 60 0 8 0 0 1 0 00 1 2 00 1 4 0 0
Lon gitu din al D istan ce (m)
S m ok e ( k g/ k g ) T EST 1 T EST 2 (Roadway) T EST 2 (Escape)
Figure 13: Tests 1 and 2 – smoke fraction
Figure 14: Test 2 – temperature field 3.4 Comparisons
Comparisons of numerical simulation results and field tests data of the two tests are presented in Figures 16 through 19.
Figure 16 shows the comparison of the numerical simulation and Test 1 data for the ceiling temperatures. The figure indicates a a maximum ceiling predicted temperature of about 50oC. -250 -200 -150 -100 -50 0 50 100 150 200 250 0 200 400 600 L o n g itu d in al P ressu rre ( P a ) 800 1000 1200 1400 D istan ce (m )
Figure 15: Test 2 – total pressure
T u n n e l E v ac u a tio n P a th
Figure 17 shows a plot of the vertical centreline temperatures for Test 1 as predicted by the numerical simulations and measured data. Up to a height of 2.0 m, the numerical model predicted a higher temperature than for measured data. Above that height, there was a good comparison.
The discrepancy between the predicted values and experimental data are mainly attributed to the idealization of the fire in the numerical analysis, where the fire source is modelled as a postulated volumetric heat source. During the experiments it was observed that the flames were deflected downstream of the fire by the longitudinal airflow. This pushed the higher flame temperatures downstream of the fire, away from the thermocouple tree.
Figure 16: Test 1 - ceiling temperatures
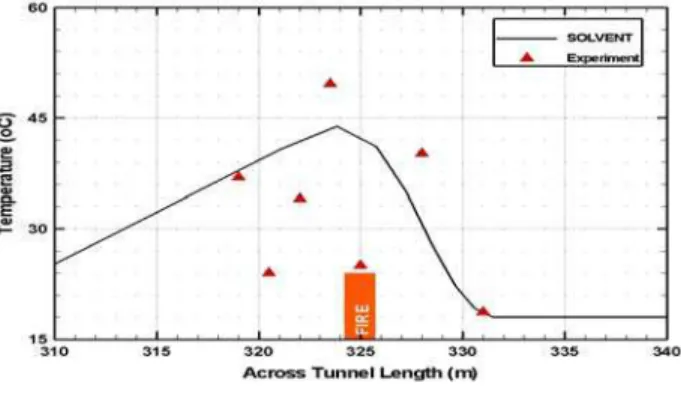
Figure 18 shows the comparison of ceiling temperatures for Test 2. The predicted temperatures were higher than the measured values. It is believed that this discrepancy is caused by the strong deflection of flames during the experiment as a result of higher longitudinal airflow speeds at the centre section of the tunnel.
Figure 17: Test 1 - vertical temperatures
Figure 19 shows the vertical temperature comparison for Test 2. The trend is similar to that observed for Test 1 (Figure 17).
4 CONCLUSIONS
1. In general, the numerical simulations, using Solvent, follow the field measurements. They indicated that the current ventilation strategies for the two fire scenarios, close to the exhaust fans and at the middle of the tunnel, are efficient in clearing hot smoke and fire products from the tunnel.
Figure 18: Test 2 - ceiling temperature
2. No smoke was observed within the galleries of ventilation fans VA103 and VA201 during Test 1. The numerical simulation confirmed this observation by using the pressure differences between the
3. The ventilation scenario associated with Test 2 involved the activation of fan VA103 in exhaust mode. This significantly increased the mid-tunnel velocity. However, in this case the VA103 gallery could not be used as an escape route as the evacuees would be exposed to smoke. Moreover, it was observed during the field measurements that the smoke extracted through the side vents into the gallery of fan VA103 was recirculated into the other galleries downstream of exhaust fans VE151 and VE153 preventing its use as an evacuation path.
4. The air velocity in the evacuation passage was 14 m/s with VA103 at maximum capacity. It might be difficult to walk against such a high airflow during an evacuation. Lower velocities (11 m/s) should be used to facilitate movement in the evacuation passage[8].
5. It should be noted that the rate of smoke production for the field tests and the numerical simulation may differ. In the numerical simulations, the rate of smoke production was a function of the fuel consumption and the stoichiometric ratio (Eq. 2). Whereas, an extra source of smoke was introduced during the tests (four smoke bombs/min) for better visualization. For more meaningful quantitative comparisons between the numerical and experimental data, the extra quantity of smoke produced by the smoke bombs should be included in the simulations. However, the current qualitative comparisons are favorable.
5 REFERENCES
1. Kashef, A.; Bénichou, N.; Lougheed, G.D. Numerical Modelling of Movement and Behaviour of Smoke Produced from Fires in the Ville-Marie and L.-H.-La Fontaine Tunnels: Literature Review, Research Report, Institute for Research in Construction, National Research Council Canada, 141, pp. 66, Sep, 2003 (IRC-RR-141).
2. Innovative Research, Inc./Parsons Brinker-hoff, Inc., “Solvent Version 1.0”, Innovative Research, Inc./Parsons Brinkerhoff, Inc., 2000.
3. K.B. McGrattan, H.R. Baum, R.G. Rehm, G.P. Forney, J.E. Floyd, and S. Hostikka., “Fire Dynamics Simulator (Version 2), Technical Reference Guide”, Technical Report NISTIR 6783, National Institute of Standards and Technology, Gaithersburg, Maryland, August 2001.
4. Kashef, A.; Bénichou, N.; Lougheed, G.D.; Debs, A. "CFD simulation of in-situ airflow measurements in road tunnels," 5th International Conference Safety in Road and Rail Tunnels (Marseilles, France, 2003-10-06), pp. 609-618.
5. Klote, J., and Milke, J. 2002. “Principles of Smoke management”. ASHRAE, Inc., 1791 Tullie Circle NE, Atlanta, GA 30329.
6. Innovative Research, “Reference Manual for COMPACT-3D”, Innovative Research, Inc., Minneapolis, 1998.
7. Wilcox, D.C., Turbulence Modeling of CFD, DCW Industries, Inc., California 91011, 1993.
8. Cheung, Emil, Chan, Wilson, and Man, Richard, “Ventilation Scheme using Saccardo Nozzles”, Tunnel Management International, 5th International Conference, Safety in Road and Rail Tunnels, Volume 6, Number 1, 2003.