arXiv:1103.1344v1 [astro-ph.SR] 7 Mar 2011
Nancy Remage Evans
Smithsonian Astrophysical Observatory, MS 4, 60 Garden St., Cambridge, MA 02138; email nevans@cfa.harvard.edu
Kathleen DeGioia-Eastwood
Department of Physics and Astronomy, Northern Arizona University, Box 6010, Flagstaff AZ, 86011-6010
Marc Gagn´e
Department of Geology and Astronomy, West Chester University, West Chester, PA 19883
Leisa Townsley
Department of Astronomy & Astrophysics, 525 Davey Laboratory, Pennsylvania State University, University Park, PA 16802
Patrick Broos
Department of Astronomy & Astrophysics, 525 Davey Laboratory, Pennsylvania State University, University Park, PA 16802
Scott Wolk
Smithsonian Astrophysical Observatory, MS 70, 60 Garden St., Cambridge, MA 02138
Ya¨el Naz´e
GAPHE Departement AGO, Universite de Liege, Allee du 6 Aout 17, Bat. B5C, B4000-Liege, Belgium
Michael Corcoran
NASA’s Goddard Space Flight Center,Code 662, Greenbelt, MD 20771
Lida Oskinova
Institute for Physics and Astronomy, University Pots- dam, 14476 Potsdam, Germany
Dept. de Physique, Univ. de Montreal, CP 6128 Succ. A. Centre-Ville, Montreal, QC H3C 3J7, Canada
Junfeng Wang
Smithsonian Astrophysical Observatory, MS 06, 60 Garden St., Cambridge, MA 02138
Nolan R. Walborn
Space Telescope Science Institute 3700 San Martin Dr., Baltimore, MD 21218
nevans@cfa.harvard.edu
ABSTRACT
We have developed lists of likely B3–A0 stars (called “late B” stars) in the young cluster Trumpler 16. The following criteria were used: location within 3’ of η Car, an appropriate V and B-V combination, and proper motion (where available). Color and magnitude cuts have been made assuming an E(B-V) = 0.55 mag ± 0.1, which is a good approximation close to the center of Trumpler 16. These lists have been cross-correlated with X-ray sources found in the Chandra Carina Complex Project (CCCP). Previous studies have shown that only very rarely (if at all) do late main sequence B stars produce X-rays. We present evidence that the X-ray detected sources are binaries with low-mass companions, since stars less massive than 1.4 M⊙ are strong X-ray sources at the age of the
cluster. Both the median X-ray energies and X-ray luminosities of these sources are in good agreement with values for typical low-mass coronal X-ray sources. We find that 39% of the late B stars based on a list with proper motions have low-mass companions. Similarly, 32% of a sample without proper motions have low-mass companions. We discuss the X-ray detection completeness. These results on low-mass companions of intermediate mass stars are complementary to spectroscopic and interferometric results, and probe new parameter space of low mass companions at all separations. They do not support a steeply rising distribution of mass ratios to low masses for intermediate-mass (5M⊙) primaries,
such as would be found by random pairing from the Initial Mass Function.
Subject headings: stars: binaries; stars:massive; X-rays
1. INTRODUCTION
B stars later than spectral type B2 do not in general produce X-rays. In the deepest exposure of a young star cluster (the Chandra Orion Ultradeep Project, COUP project), Stelzer, et al. (2005) found late B and A stars which were not detected with log LX <27.6
ergs s−1
. X-rays in O and B stars in the Carina region are discussed by Naz´e, et al. (2011) and Gagn´e. et al. (2011) and references cited therein. Hotter, more luminous stars with substantial winds (O and early B stars) produce X-rays through embedded wind shocks, colliding winds in binaries, or magnetically confined wind shocks (see Gagn´e, et al.).
Stelzer et al. (2005) analyzed the properties of late B (B5 and later) through A stars in the Orion Nebula Cluster COUP project (which they call “ weak wind” stars) which were detected in X-rays and compared them to low-mass T Tau stars. The luminosity, temperature (relatively hard), and variability (flare like) were all consistent with X-rays produced by a T Tau companion rather than the B star itself, and Stelzer et al. concluded that the X-rays are most probably from late spectral type companions. On the other hand, in 4 out of 11 late B and A stars discussed by Stelzer, et al., no X-rays are detected “several orders of magnitude” below that seen in other weak wind stars (i.e., from low-mass companions). These 4 stars (36% of the sample) that have no X-rays to a very low level clearly do not have a low-mass stellar companion.
The exception to the general lack of X-rays in late B stars appears to be associated with the rare class of magnetic chemically peculiar stars. The model proposed to explain, for in-stance IQ Aur (a magnetic A0 star) is the magnetically confined wind-shock model (MCWS, Babel and Montmerle, 1997). In this model wind streams from opposite hemispheres collide at the equator, creating X-rays from strong shocks. Θ1 Ori C is thought to be a high mass
analog of this process (Gagn´e, et al. 1997). However, magnetic chemically peculiar stars are rare and would only be a minor contaminant to the X-ray detected group of late B stars. For instance, Power, et al. (2007) find that magnetic Ap/Bp stars constitute only 1.7% of intermediate mass stars within 100 pc of the sun. Furthermore, very few late B magnetic chemically peculiar stars have actually been detected in X-rays (Drake 1998; Leone 1994; Drake, Wade, and Linsky 2006). For instance, Drake et al. (1994) found 3 to 5 detections in about 100 Bp-Ap stars in the Rosat All Sky Survey. This is discussed further in Section 6 below.
The aim of the present study is to develop a sample of intrinsically X-ray–quiet stars, the late B stars in Trumpler 16 (hereafter Tr 16). The stars from this list detected in a Chandra image become the list suspected to have low mass companions–young and X-ray active T Tau stars.
Focusing on a cluster (Tr 16) within the rich but complicated Carina complex provides advantages to interpretation, namely that the stars are confined to a much smaller age range (≃ 3 Myr old) than that covered in the whole region (though some lower mass stars may be older; see Wolk, et al., 2011). Townsley, et al. (2011) provide an introduction to the Carina complex and the Chandra Carina Complex Project (CCCP). The population of massive stars and the extinction in Tr 16 have been well studied, and the range of extinction is much smaller than for the entire complex. The full complex also contains a wide range of stellar densities or environments, of which Tr 16 is one of the denser areas. This is not to say that Tr 16 can be simply characterized as a symmetric cluster. It is, in fact, a grouping of subclusters (Feigelson, et al., 2011; Wolk, et al. 2011), one of which contains η Car itself. Previous studies of Tr 16 are summarized by Wolk, et al., who focus on the low mass stars. The present study pertains to late B stars in Tr 16; several other studies in this issue discuss B and O stars in the entire Carina Complex (Naz´e, et al., 2011 and Gagn´e et al. 2011). Povich, et al. (2011) discuss young stellar objects of intermediate mass identified by mid-infrared excess. The range of ages in the entire complex is large enough to include the pre-main sequence stars in that study, as well as main sequence stars here.
The goal here is to estimate the fraction of B3 to A0 stars in Tr 16 that have low-mass companions using the Chandra X-ray data. There are several difficulties in identifying these companions by other means. Radial velocities in this spectral range are limited in accuracy because of the broad lines. This is particularly a problem in identifying companions of (say) 0.5 M⊙ for a 5 M⊙ primary (mass ratio q = M2/M1 = 0.1). Similarly, for resolved
compan-ions, light from the primary overwhelms light from the secondary. Recently, interferometric and adaptive optics approaches as well as high resolution satellite images have improved the situation by resolving a number of companions, adding information about companions in wide orbits. A number of such surveys of B stars are listed in Sch¨oller, et al. (2010). How-ever, since there is a large population of low mass field stars, a resolved red companion has a high probability of being a chance alignment. X-ray observations identify young companion stars since T Tau stars can easily be distinguished from much older field stars which have very weak X-ray flux. This is an important strength of the X-ray approach. In summary, we still know almost nothing of low-mass companions of B stars. X-ray observations pro-vide a new way to identify low mass companions and hence complete the picture of binary properties.
Massive (M > 8 M⊙) and intermediate-mass (8 > M > 3 M⊙) stars are typically formed
as members of groups: rich star clusters, sparse clusters, multiple systems, or binary systems. This is important in the redistribution of angular momentum necessary in cloud collapse. Thus, the resulting distributions of angular momentum and mass (the Initial Mass Function or IMF) are shaped by this formation environment. It is important to determine the observed
parameters of these groupings, even though subsequently clusters and multiple systems can be altered by both internal and external interactions. However, to statistically estimate the multiplicity of stars is a non-trivial task. Even more difficult is to put constraints on binary properties, such as q, the mass ratio of the secondary to the primary. Systems with low mass companions identified in this study provide new information about these questions.
The discussion below contains the following parts: the development of a sample of mid to late B stars, the detection of X-ray sources in this list, examination of the X-ray sources for corroborative evidence that they are produced by low-mass coronal sources, and discussion of the results.
2. SAMPLE OF STARS
Massive stars in Tr 16 (O and early B stars) have been extensively studied, using spectra to derive spectral types (see Massey and Johnson 1993). Spectra are not available for late B stars, however photometry and proper motions do exist. We have confined our attention to stars within 3’ of η Car to obtain a high proportion of cluster members.
We have developed a sample of Tr 16 late B members from two sources. First Cudworth, et al. (1993) have determined membership from proper motions. We created a list of stars from their list within 3’ of η Car using the Vizier database. Although Tr 16 is a complex cluster (see Wolk, et al. 2011), this radius should contain most of the cluster members. We have removed from the list any stars found by Cudworth, et al. to have a membership probability of less than 0.80 (Fig. 1a). This is particularly important in removing foreground contaminants. To create a list of Zero Age Main Sequence (ZAMS) stars between B3 V and A0 V, we have used the ZAMS from Schmidt-Kaler (1982). Fig. 1a (center line) shows the ZAMS using a distance of 2.3 kpc (Smith 2006), and a mean reddening of E(B-V) = 0.55 mag, which corresponds to V - MV = 13.51 mag. The two other lines have been shifted by -0.1
and +0.1 mag in E(B-V), illustrating the approximate range in E(B-V). The range between the lines also means some evolution past the ZAMS is included. Specifically only stars with V between 12.41 and 14.81 mag and (B-V) bluer than 0.62 have been retained. Fig. 1a confirms that this range of E(B-V) is reasonable, and that the range contains most of the likely B star members. Feinstein et al. (1973) provide a graphical summary of the reddening from massive stars in Tr 16 (their Fig. 9), which shows that this range of reddenings is appropriate. We make no attempt to assign spectral types or temperatures to individual stars because of limited information about reddening; instead we have created a list of stars which are late B stars in Tr 16. The final list of 31 sources (called “Late B Cudworth” below) is provided in Table 1, including the Cudworth, et al. designation, the coordinates (J2000),
V, B-V, and the distance from η Car (all from Vizier).
We have examined the proper motions for the stars identified as members in Tr 16 in the recent USNO CCD Astrograph Catalog (UCAC3).1 Although there are differences from the
Cudworth, et al. values, the UCAC3 proper motions are all reasonably small, appropriate for stars at the distance of Tr 16.
The second approach used the photometry of DeGioia-Eastwood, et al. (2001). Again, the original list of stars within 3’ of η Car was obtained from Vizier (Fig. 1b). Again, stars brighter or fainter in V or redder in (B-V) than the ZAMS B3–A0 range (using the same color-magnitude range as for the Cudworth sample) have been culled from the list. Figure 4 in DeGioia-Eastwood, et al. confirms that a selection using a restricted E(B-V) provides good separation from a comparison background field. Table 2 contains the final list (called “Late B Eastwood” below), including the coordinates, V, (B-V), and the distance from η Car.
There is some overlap between our filtered Cudworth and Eastwood lists (as there is in the author lists), however, there are also some differences. The Eastwood photometry is deeper. Although the two lists have many stars in common, since the Cudworth, et al. stars have proper motion evidence of cluster membership in addition to appropriate color-magnitude values, we have analyzed the lists separately.
The stars in Figures 1a and 1b that fall far outside the selected V- (B-V) range for late B stars have magnitudes and colors that are generally appropriate for a foreground population of low-mass stars. Note that after culling by Cudworth’s proper motion criterion, very few stars fell outside the cluster region in Fig. 1a. As an aside, it is by no means impossible that there may be a few locations of very high obscuration, resulting in B stars even more highly reddened than the reasonably generous limits in Figures 1a and 1b. Even if we have omitted some obscured stars, it makes no difference to the final result. This would have only decreased the sample size, not altered the fraction of X-ray detections.
3. X-RAY SOURCES
Although Tr 16 is central to the region surveyed in the CCCP (Townsley, et al. 2011), an ACIS observation of 88.4 ksec already existed in the Chandra archive. This is a deeper exposure than the typical exposure in CCCP, and hence the cluster was not reobserved in CCCP. This observation was originally analyzed by Albacete-Colombo, et al. (2008, called
AC below). The current analysis is complementary to their discussion in two ways. First, the data extraction was performed using the ACIS Extract package (AE, Broos, et al. 2010), which identifies fainter sources, and is also consistent with other CCCP data (Broos, et al. 2011). Second, the emphasis of the current study is on mid to late B stars rather than the low-mass population. The new treatment of these data increases the completeness of detections, which is pivotal for our present study of X-ray emission in intermediate-mass stars.
Point source extraction was performed as described in Broos, et al. (2011). Source detection in the vicinity of Tr 16 is fully described by Wolk, et al. (2011). X-ray sources found from the processing for the whole project were cross-correlated with the late B star lists (Tables 1 and 2) to determine which sources in this sample produce X-rays. Fig 2 shows the Tr 16 region of the ACIS image with the late B stars marked. The B stars detected are spread fairly homogeneously through the image. The late B stars detected in X-rays are listed in Table 3. The X-ray/Cudworth offsets for the 12 sources in Table 3 range from 0.14” to 0.73”, with a mean of 0.38”. The X-ray/Eastwood offsets for the 12 sources in Table 3 range from 0.08” to 1.1”, with a mean of 0.46”.
The X-ray sources are evenly spread through the luminosity and temperature ranges in Figures 3a and 3b. This is as expected for a random event (the existence of a binary). One characteristic we investigate is the B3 spectral type commonly used as the cutoff below which hot stars do not produce X-rays through wind shocks as O stars and early B stars do (see discussion in Gagn´e, et al., 2011 and Naz´e et al., 2011). If the hottest stars in the late B sample did produce their own X-rays, we would expect a concentration of X-ray sources at the highest luminosities (the lowest V magnitudes). Instead X-ray sources are evenly spread through all luminosities in Figs. 3a and 3b. For the Cudworth sample, the mean V for the stars detected in X-rays is 13.31 ± 0.63 mag, as compared to 13.42 ± 0.50 mag for the undetected stars, and the mean B-V values are 0.41 ± 0.10 mag (detected) and 0.39 ± 0.07 mag (undetected). For the Eastwood sample, the mean V values are 13.25 ± 0.61 mag (detected) and 13.52 ± 0.56 (undetected). For B-V, the means are 0.42 ± 0.10 mag (detected) and 0.43 ± 0.09 mag (undetected). For both samples, the mean V of the detected sources is indistinguishable from the mean V of undetected sample within the uncertainties. The same is true for B-V.
Properties for the detected X-ray sources (Table 3) were derived as follows. The net number of detected X-ray events, median X-ray energy, and flux (columns 4, 5, and 6) are standard outputs from the AE package (Broos, et al. 2011) for total energy range (0.5-8.0 keV). To deredden the fluxes we have used the simple procedure of assuming a constant NH
= 0.55 ± 0.10 mag used to define the sample; Seward 2000). The information required to compute individual reddenings is not available, and for the sources within the center of Tr 16, this is a good approximation. Combining this reddening with a temperature of log T (K) ≃ 7.5 using a PIMMS Raymond-Smith model, we obtained a factor of 1.6 to deredden the observed flux. This is a typical temperature found by Albacete-Colombo, et al. (2008) for low mass stars in Tr 16. The luminosity is computed from the dereddened fluxes and a distance of 2.3 kpc (column 6 in Table 3; Smith 2006). (If the sources were actually much softer, typical of massive stars, the absorption would be larger, resulting in an increase in computed luminosity of about 0.2 in the log, for a logT = 6.9 K.)
4. SOURCE PROPERTIES
Is there any corroborating information to support the idea that X-ray emission from the sources in Figures 3a and 3b arises from low-mass companions rather than from hot star wind shocks? Figure 4 shows the median X-ray energy from the standard extraction process as a function of net counts for X-ray detected sources in both the Cudworth and Eastwood lists. Note that the median energy is for photons above 0.5 keV, and is not a thermal plasma temperature from a spectral fit. To set the context, the energies for the O and early B stars (hotter than B3) from the Skiff catalog are shown (see Naz´e, et al. 2011). The Skiff stars are from the entire Carina project region, not just from Tr 16. The Tr 16 late B stars (Table 3) are confined to a small region of the plot at high X-ray energies and modest count rates. The high median energies in particular are a characteristic expected of coronal/magnetic low mass pre-main sequence stars which make up the population of companions. It is not surprising, however, that there is some overlap with the Skiff O/early B population, since these stars may also occasionally have low mass companions. Some of the Skiff stars from the entire Carina complex may have higher absorption than the Tr 16 stars. This would result in fewer soft counts in these cases and a higher median energy. This makes the distinctly high median energy of late B stars (as compared with the majority of the Skiff) stars even more notable.
A study of B stars from the whole CCCP region (Gagn`e et al. 2011) also finds that many X-ray detections have the characteristics of low mass coronal sources. Their Fig. 8 shows a bimodal distribution of X-ray source fluxes. Since they include early B stars, a number of objects in that figure are intrinsic X-ray sources. However the sample is dominated by lower X-ray flux sources interpreted as low mass companions. The sources in our late B sample (Table 3) have fluxes appropriate to the lower flux “companion” portion of Gagn`e, et al. Fig. 8.
The X-ray luminosities in Table 3 are also consistent with those of low-mass stars in Tr 16 (Wolk, et al. 2011, Fig. 7). They overlap with the low luminosity range of the early B/O stars (Naz´e, et al. 2011) but there is a clear break in the trend of X-ray luminosity as a function of bolometric luminosity (Naz´e, et al., 2011 Fig. 3), consistent with a different X-ray production mechanism.
We have examined plots of log Lx as a function of V and also B-V for both Cudworth and Eastwood datesets. No relation is seen in any of the plots, consistent with the proposition that the X-ray and optical photons are produced by different stars (optical: B stars, X-rays: companions).
4.1. Strong Sources
For the four strongest X-ray sources, we present the light curves and spectral fits, which can be examined to see whether they show the characteristics of low-mass stars. These have been generated as standard products of the AE package.
Spectra
The “best model” spectra have been obtained from the CCCP database and are shown in Fig. 5 for (top to bottom) FA 69, FA 52, Y 188, and FB 238 (Broos, et al. 2011; Broos, et al. 2010). The spectra have been fit with single temperature APEC thermal plasma models and foreground absorption as described in Broos, et al. (2011). Since late B stars do not have strong winds, no additional circumstellar absorption is expected. It is a confirmation of the fitting process that the NH in the fits corresponds to the range of E(B-V) expected
for the foreground reddening (0.44 to 0.79 mag). The temperatures are kT ≃ 2.43 keV (FA 69), kT ≃ 2.44 keV (FA 52), kT≃ 2.13 keV (Y 188), and kT ≃ 2.38 keV (FB 238). All four temperatures are higher than those typically found in massive stars (see, for instance, Fig. 1 in Naz´e, et al., 2011).
Light Curves
Light curves are also shown (Fig. 5) for FA 69, FA 52, Y 188, and FB 238. Flux variability is quantified by a p-value1 for the no-variability hypothesis, estimated via the
Kolmogorov-Smirnov (KS) statistic, shown as PKS in the right panels. Of the four, FA 52
shows the strongest evidence of flaring in the light curve or in the median X-ray energy, with
1In statistical hypothesis testing, the p-value is the probability of obtaining a test statistic at least as
weaker evidence in FA 69. This is roughly consistent with the flare duty cycle from the long COUP observation of the Orion Nebula Cluster for both solar mass stars and for lower mass stars (Caramazza, et al. 2007).
4.2. Upper Limits
As expected, many of the late B star were not detected in the Chandra image. Since the data come from a single image and are reasonably close to the center (i.e. the psf is approximately constant), the upper limits to undetected stars have a small range. The source extraction (Broos, et al. 2011) provides a 1 σ upper limit to the counts from 0.5 to 8.0 keV. Values range from 8.9 to 1.2 counts, with 4 counts as a typical value. This corresponds to a log LX of 29.65 erg s−1. This is lower than the X-ray luminosities of the detected late B stars
in Table 3. Furthermore, Gagn´e et al. (2011) provide comparisons between detected early B stars and other massive stars (their Fig. 5) and early B stars, early B upper limits, and low mass stars (their Fig. 8). The fact that the upper limits in these figures are lower than the the LX of the bulk of the B stars but similar to those of the low mass stars is consistent
with the undetected stars having a low mass companion (or no companion), the same as we find here.
5. RESULTS
In the Cudworth sample, 39% of the late B stars were detected in the Chandra data (Tables 1 and 3); for the Eastwood sample, 32% were detected (Tables 2 and 3). These are the stars that are expected to have low-mass X-ray active companions.
What fraction of late type companions would be detected in the Chandra image? This has been discussed by AC (2008). From comparison with the COUP very deep exposure of the comparable age Orion Nebula cluster (Preibisch and Feigelson 2005), they estimate that detections are 55% complete for 0.9 to 1.2 M⊙ stars (which will be G stars on the
main sequence), 40% complete for 0.5 to 0.9 M M⊙ stars (which will become main sequence
K stars), and only 5% complete for less massive stars (to become main sequence M stars). For our sample, if we use 5 M⊙ as typical of late B stars, this means that we will identify
essentially no M star companions (q = M2/M1<0.1), but approximately half the companions
more massive than this but cooler than mid-F spectral types (roughly to q = 0.3).
There are two reasons that our companion detection may actually be higher than this. The source detection technique used here (Broos, et al, 2011; Wolk, et al. 2011) identified
70% more sources than AC. Fig. 3 in Wolk, et al. 2011, (a plot of X-ray flux vs J magnitude) shows that sources are detected at least 2 magnitudes fainter than in AC. This means that we detect stars that will be M stars on the main sequence. Thus, stars less massive than 0.5 M⊙ are detected, corresponding to q = 0.1. The second reason is also illustrated in the
same figure in Wolk et al. The FX vs J relation has a clear lower bound in X-ray fluxes
to at least J = 16 mag which corresponds to M = 0.8 M⊙ from the Siess tracks (Wolk, et
al., Fig 4). This indicates that source detection is complete in this range. A second result from this figure discussed in Wolk, et al. pertains to stars in the late B through A spectral range (J between 12 and 14 mag, which would include our detections in Table 3). These stars are not the fainter X-ray sources. That is, they are not the lowest-mass J = 16 mag coronal sources in that figure. Although many low mass stars are detected with J > 15 mag, the late B–A star range (J 12-14 mag) is more sparsely populated for X-ray flux < -6 (log photons sec−1 cm−2. The implication is that (assuming the X-rays in this group are from
low-mass companions) the companions are not the least massive pre-main sequence stars in the cluster. As discussed above, low mass companions would be detected to at least M = 0.8 M⊙, however they are lacking in the range J = 12-14 mag. That is, binaries among late
B and A stars with very small q values are deficient. (Preibisch and Feigelson [2005] and Telleschi et al. [2007] provide comparable diagrams linking X-ray flux and mass.)
6. DISCUSSION
To summarize, 39% and 32% of the late B stars in the Cudworth sample (Tables 1 and 3) and Eastwood sample (Tables 2 and 3) were detected respectively in the Chandra data. It is expected that these overwhelmingly have low-mass companions. Note that system multiplicity could be higher if a low-mass companion is itself a binary.
Biases
What biases are likely to be found in these data? The most important is contained in the sample selection. If a cluster member were omitted from Tables 1 or 2, for example because of an unusually large reddening, the result is not affected. The sample size is decreased, but it is not contaminated by nonmembers. For this reason, the Cudworth sample which has the additional proper motion criterion is taken to be the more authoritative result, although it is a valuable confirmation that the two lists provide very similar results (in part because they have a significant overlap).
One aspect of the sample and detection process, the detection completeness, was dis-cussed in the previous section. We conclude that X-ray detection is likely to be complete
through 0.8 M⊙ companions.
Finally, is it possible that some of the X-ray detected stars are in fact MCWS stars which produce X-rays intrinsically. This would mean we have over estimated the fraction of low mass companions. The discussion of fluxes of B stars (Fig. 8 in Gagn´e, et al., 2011) illustrates that this is not a serious distortion. Although the Gagn´e sample contains hotter B stars than our sample, they are stars of the same age analyzed in the same way, making them a good comparison. Gagn´e et al. conclude that the sample is made up of two populations. The majority of detected B stars nicely match the distribution in X-ray photon flux expected if the X-rays are produced by a low mass companion. However, there is in addition a small group of 14 stars with higher fluxes, which are good candidates for instrinsic X-ray production, for which the MCWS mechanism is the leading hypothesis. If we accept this as the population of intrinsic X-ray producers in the list of 127 early B stars, the fraction is only 11%. Applying this fraction to the late B sample, we would expect only 1 of the late B X-ray stars to be an intrinsic X-ray source and wrongly attributed as having a low mass companion.
Binary Fractions
As an example for comparison, the recent discussion by Mason, et al. (2009) combines speckle interferometry observations of O and B stars with spectroscopic binary results. They find, for instance, a binary fraction of 66% among cluster O stars, taken to be the sample least altered from the initial condition. Our approach using X-ray identification cannot, of course, be used for O stars, since they produce X-rays themselves. The low-mass companions of B stars identified through X-rays in this project would only be present very infrequently in lists of spectroscopic binaries or speckle interferometry because of small mass ratios and large magnitude differences respectively. Hence our binary fraction is complementary and approximately additive to the Mason, et al. result.
A second comparison comes from an International Ultraviolet Explorer satellite (IUE) survey of 76 Cepheids brighter than 8th mag from 2000 to 3200 ˚A (Evans 1992). Any
companion hotter than mid A spectral type would have been detected. 21% of the sample had hot companions. (A statistical correction using stars with known orbital velocities provided a fraction of 34%.) This target list is more similar in mass to late B stars than the O star list. Again, the fraction of companions in the photometric survey of hot star companions is approximately additive to the fraction of low-mass companions in the present study.
A full synthesis of the results of the present X-ray companion detection study and other binary survey techniques is premature and beyond the scope of this paper. As discussed
above, the Mason, et al. and Evans studies detect relatively high mass companions while the present X-ray study detects low mass companions. Since there is little overlap, the re-spective fractions can be simply summed for an approximate total fraction. This results in a very high fraction of binaries, approaching unity. This is in agreement with, for instance, the discussion of Kouwenhoven, et al. (2007) for intermediate mass stars in the Sco OB2 association. Adaptive Optics (AO) surveys are more difficult to combine with the X-ray results, since AO surveys reveal companions of all masses but are not sensitive to close bi-naries which are typically detected in spectroscopic surveys. Furthermore, they may include chance projections of low mass field stars. In contrast, X-ray detected companions are only stars young enough to be physical companions. The X-ray approach detects companions at all separations but only low mass companions (from 1.4 M⊙ to 0.8 M⊙). In other words,
there is some overlap in detections with AO surveys but in a complicated way. A number of AO surveys of B stars have recently been done, as summarized in Sch¨oller, et al. (2010) typically finding a fraction of approximately 30%. Again, the present X-ray results imply that the full binary fraction including close binaries is considerably higher than this.
The result that 39% of late B stars have low-mass companions is a lower limit to the fraction of low mass companions because of the limit to X-ray sensitivity. However, discussion of the low-mass stars in the previous section suggests that the X-ray observations may in fact have uncovered the majority of companions. As mentioned in the previous section this is an intriguing hint that the low-mass companions may favor the more massive stars among the low-mass coronal sources. The fraction of low-mass companions is smaller than the fraction of companions produced from random pairing from the IMF, which rises very steeply at low-masses.
The homogeneous distribution of X-ray sources throughout the late B star range (Figs. 3a and 3b) supports the interpretation that the X-rays are produced by a low-mass coronal source rather than a continuation of the wind shock mechanism in more massive stars.
In summary, we have used Chandra X-ray data to identify intermediate mass (5 M⊙)
stars with low-mass companions in Tr 16. This approach together with AO surveys are exploring new parameter space for reasonably massive binary systems.
It is a pleasure to acknowledge many interesting conversations from the Chandra Carina Large Project teams, particularly the Penn State group and the massive star group. We also thank an anonymous referee for suggestions which improved the presentation of the paper. Tables 1 and 2 were generated using data from the CDS VizieR interface. NRE and SJW acknowledge support from the Chandra X-ray Center NASA Contract NAS8-03060. This work is supported by Chandra X-ray Observatory grant GO8-9131X (PI: L. Townsley) and
by the ACIS Instrument Team contract SV4-74018 (PI: G. Garmire), issued by the Chandra X-ray Center, which is operated by the Smithsonian Astrophysical Observatory for and on behalf of NASA under contract NAS8-03060. AFJM is grateful for financial support from NSERC (Canada) and FQRNT (Quebec). YN acknowledge support from the Fonds National de la Recherche Scientifique (Belgium), the PRODEX XMM and Integral contracts, and the Action de Recherche Concertee (CFWBAcademie Wallonie Europe). NRW acknowledges support from STScI which is operated by AURA, Inc., under NASA contract NAS5-26555.
REFERENCES
Albacete-Colombo, J. F., Damiani, F., Micela, G., Sciortino, S., and Harnden, F. R., Jr. 2008, A&A, 490, 1055 (AC)
Babel, J. and Montmerle, T. 1997, A&Ap, 323, 121
Broos, P. S., Townsley, L. K., Feigelson, E. D., Getman, K. V., Bauer, F. E., and Garmire, G. P. 2010, ApJ, 714, 1582
Broos, P. S., et al. 2011, ApJS, submitted (CCCP Catalog Paper)
Caramazza, M., Flaccomio, E., Micela, G. Reale, F., Wolk, S. J., and Feigelson, E. D. 2007, A&Ap, 471, 645
Cudworth, K. M., Martin, S. C., and DeGioia-Eastwood, K. 1993, AJ, 105, 1822
DeGioia-Eastwood, K., Throop, H., Walker, G., and Cudworth, K. M 2001, ApJ, 549, 578
Drake, S. A. 1998, Cont. Obs. Skalnate Pleso, 27, 382
Drake, S. A., Linsky, J. L., Schmitt, J. H. M. M., and Rosso, C. 1994, ApJ, 420, 387
Drake, S. A., Wade, G. A., and Linsky, J. L. 2006, Proc. X-ray Universe (ESA SP-604), Ed.: A. Wilson, p. 73
Evans, N. R. 1997, ApJ, 384, 220
Evans, N. R., Seward, F. D., Krauss, M. I., Isobe, T., Nichols, J., Schlegel, E. M., and Wolk, S. J. 2003, ApJ, 589, 509
Feigelson, E. D. et al. 2011, ApJS, submitted
Gagn´e, M., Caillault, J.-P., Stauffer, J. R., and Linsky, J. L. 1997, ApJ, 478, L87
Gagn´e, M., et al. 2011, ApJS, submitted (CCCP Massive Star Signatures Paper)
Kouwenhoven, M. B. N., Brown, A. G. A., Portegies Zwart, S. F., and Kaper, L. 2007, A&A. 474, 77.
Leone, F. 1994, A&Ap, 286, 486
Mason, B. D., Hartkopf, W. I., Gies, D. R., Henry, T. J., and Helsel, J. W. 2009, AJ, 137, 3358
Massey, P. and Johnson, J. 1993, AJ, 105, 980.
Naz´e, Y., et al. 2011, ApJS, submitted (CCCP Massive Star Lx/Lbol Paper)
Povich, M. S., et al. 2011, ApJS, submitted (CCCP IR Excess Paper)
Power, J., Wade, G. A., Hanes, D. A., Aurier, M., and Silvester, J. 2007, in “The physics of Magnetic Stars”, Proc. of Conf. by Special Astp Obs. of the Russian, AS, eds. I. I. Romanyuk and D. O. Kudryavtsev, p. 89
Preibisch, T. and Feigelson, E. D. 2005, ApJS, 160, 390
Schmidt-Kaler, T. 1982, in Landolt-B¨ornstein VI 2b, ed K. Schaifers & H. H. Voigt (New York: Springer), 19
Seward, F. D. 2000, in Allen’s Astrophysical Quantities, ed. A. N. Cox, New York: Springer Verlag, p. 196
Sch¨oller, M., Correia, S., Hubrig, S., and Ageorges, N. 2010, A&Ap, 522, 85
Smith, N 2006, ApJ, 644, 1151
Stelzer, B., Flaccomio, E., Montmerle, T., Micela, G., Sciortino, S., Favata, F., Preibisch, T., and Feigelson, E. D. 2005, ApJS, 160, 557.
Telleschi, A., G¨udel, M., Briggs, K. R., Audard, M., and Palla, F. 2007, A&A, 468, 425
Townsley, L. K., et al. 2011, ApJS, submitted (CCCP Intro Paper)
Wolk, S. J., et al. 2011, ApJS, submitted (CCCP Tr16 Paper)
Table 1. Late B Stars (Cudworth)
Name RA Dec V B-V Distance to η Car
(h m s) (o ’ ”) (mag) (mag) (’) FB204 10 44 42.15 -59 41 40.3 13.89 0.36 2.71 FA50 10 44 44.37 -59 42 33.8 12.91 0.32 2.77 FA47 10 44 51.66 -59 43 14.1 12.90 0.34 2.55 Y127 10 44 53.97 -59 40 19.2 14.34 0.56 1.43 FB224 10 44 55.13 -59 42 24.9 13.27 0.49 1.63 FA41 10 44 56.70 -59 40 24.2 12.48 0.37 1.10 FA40 10 44 56.79 -59 40 03.0 13.30 0.44 1.36 FA39 10 44 57.97 -59 40 00.5 12.83 0.45 1.31 Y213 10 44 58.57 -59 43 33.9 14.13 0.29 2.49 FB200 10 44 58.67 -59 41 16.1 13.50 0.32 0.58 FA75 10 45 05.03 -59 42 08.0 14.20 0.58 1.02 FA68 10 45 05.75 -59 41 24.4 12.50 0.26 0.42 FA69 10 45 07.93 -59 41 34.6 13.03 0.41 0.74 FA51 10 45 07.97 -59 39 01.4 12.89 0.30 2.20 FA52 10 45 08.41 -59 38 47.9 12.68 0.35 2.43 FA70 10 45 09.33 -59 41 28.8 13.33 0.37 0.84 Y207 10 45 10.06 -59 43 32.5 14.01 0.35 2.55 Y188 10 45 11.24 -59 42 34.4 13.84 0.55 1.75 Y116 10 45 12.76 -59 39 06.8 12.90 0.37 2.36 Y200 10 45 13.30 -59 42 58.7 13.47 0.45 2.24 Y206 10 45 13.59 -59 43 32.4 14.13 0.45 2.73 Y166 10 45 14.07 -59 41 42.4 13.07 0.38 1.48 FB238 10 45 16.25 -59 41 41.7 13.57 0.44 1.74 FB239 10 45 17.34 -59 41 20.8 13.60 0.39 1.80 FB240 10 45 18.02 -59 41 10.0 13.82 0.41 1.87 Y189 10 45 18.99 -59 42 18.9 12.57 0.31 2.31 Y164 10 45 19.03 -59 41 43.2 14.01 0.35 2.08 Y190 10 45 20.12 -59 42 08.9 13.97 0.45 2.36 Y191 10 45 20.61 -59 42 21.9 13.30 0.36 2.51 Y163 10 45 21.12 -59 41 44.9 12.92 0.43 2.34 Y193 10 45 24.20 -59 42 31.9 13.40 0.41 2.99
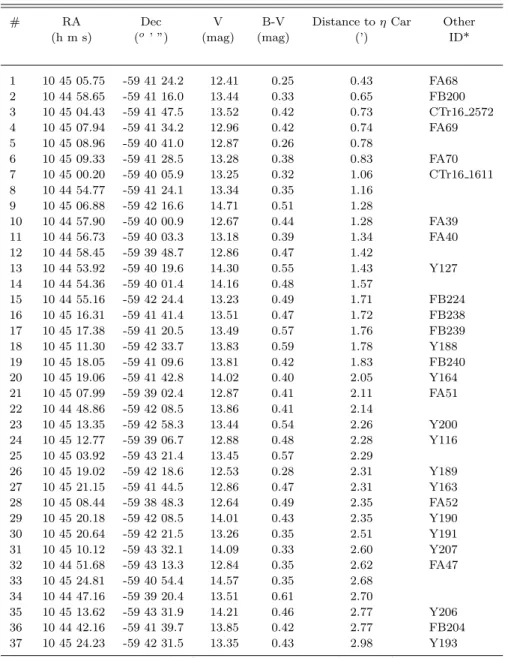
Table 2. Late B Stars (Eastwood)
# RA Dec V B-V Distance to η Car Other
(h m s) (o
’ ”) (mag) (mag) (’) ID*
1 10 45 05.75 -59 41 24.2 12.41 0.25 0.43 FA68 2 10 44 58.65 -59 41 16.0 13.44 0.33 0.65 FB200 3 10 45 04.43 -59 41 47.5 13.52 0.42 0.73 CTr16 2572 4 10 45 07.94 -59 41 34.2 12.96 0.42 0.74 FA69 5 10 45 08.96 -59 40 41.0 12.87 0.26 0.78 6 10 45 09.33 -59 41 28.5 13.28 0.38 0.83 FA70 7 10 45 00.20 -59 40 05.9 13.25 0.32 1.06 CTr16 1611 8 10 44 54.77 -59 41 24.1 13.34 0.35 1.16 9 10 45 06.88 -59 42 16.6 14.71 0.51 1.28 10 10 44 57.90 -59 40 00.9 12.67 0.44 1.28 FA39 11 10 44 56.73 -59 40 03.3 13.18 0.39 1.34 FA40 12 10 44 58.45 -59 39 48.7 12.86 0.47 1.42 13 10 44 53.92 -59 40 19.6 14.30 0.55 1.43 Y127 14 10 44 54.36 -59 40 01.4 14.16 0.48 1.57 15 10 44 55.16 -59 42 24.4 13.23 0.49 1.71 FB224 16 10 45 16.31 -59 41 41.4 13.51 0.47 1.72 FB238 17 10 45 17.38 -59 41 20.5 13.49 0.57 1.76 FB239 18 10 45 11.30 -59 42 33.7 13.83 0.59 1.78 Y188 19 10 45 18.05 -59 41 09.6 13.81 0.42 1.83 FB240 20 10 45 19.06 -59 41 42.8 14.02 0.40 2.05 Y164 21 10 45 07.99 -59 39 02.4 12.87 0.41 2.11 FA51 22 10 44 48.86 -59 42 08.5 13.86 0.41 2.14 23 10 45 13.35 -59 42 58.3 13.44 0.54 2.26 Y200 24 10 45 12.77 -59 39 06.7 12.88 0.48 2.28 Y116 25 10 45 03.92 -59 43 21.4 13.45 0.57 2.29 26 10 45 19.02 -59 42 18.6 12.53 0.28 2.31 Y189 27 10 45 21.15 -59 41 44.5 12.86 0.47 2.31 Y163 28 10 45 08.44 -59 38 48.3 12.64 0.49 2.35 FA52 29 10 45 20.18 -59 42 08.5 14.01 0.43 2.35 Y190 30 10 45 20.64 -59 42 21.5 13.26 0.35 2.51 Y191 31 10 45 10.12 -59 43 32.1 14.09 0.33 2.60 Y207 32 10 44 51.68 -59 43 13.3 12.84 0.35 2.62 FA47 33 10 45 24.81 -59 40 54.4 14.57 0.35 2.68 34 10 44 47.16 -59 39 20.4 13.51 0.61 2.70 35 10 45 13.62 -59 43 31.9 14.21 0.46 2.77 Y206 36 10 44 42.16 -59 41 39.7 13.85 0.42 2.77 FB204 37 10 45 24.23 -59 42 31.5 13.35 0.43 2.98 Y193
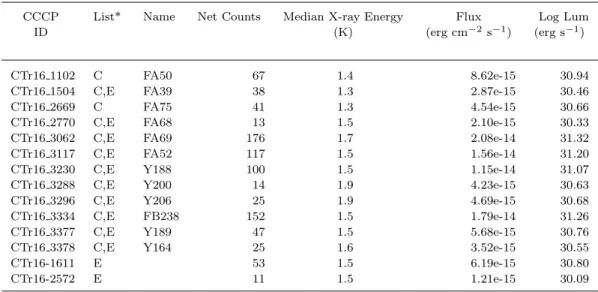
Table 3. X-Ray Detections
CCCP List* Name Net Counts Median X-ray Energy Flux Log Lum
ID (K) (erg cm−2s−1) (erg s−1)
CTr16 1102 C FA50 67 1.4 8.62e-15 30.94
CTr16 1504 C,E FA39 38 1.3 2.87e-15 30.46
CTr16 2669 C FA75 41 1.3 4.54e-15 30.66
CTr16 2770 C,E FA68 13 1.5 2.10e-15 30.33
CTr16 3062 C,E FA69 176 1.7 2.08e-14 31.32
CTr16 3117 C,E FA52 117 1.5 1.56e-14 31.20
CTr16 3230 C,E Y188 100 1.5 1.15e-14 31.07
CTr16 3288 C,E Y200 14 1.9 4.23e-15 30.63
CTr16 3296 C,E Y206 25 1.9 4.69e-15 30.68
CTr16 3334 C,E FB238 152 1.5 1.79e-14 31.26
CTr16 3377 C,E Y189 47 1.5 5.68e-15 30.76
CTr16 3378 C,E Y164 25 1.6 3.52e-15 30.55
CTr16-1611 E 53 1.5 6.19e-15 30.80
CTr16-2572 E 11 1.5 1.21e-15 30.09
Fig. 1.— (left) The Cudworth sample within 3’ of η Car with a membership probability ≥ 0.80. The lines are the ZAMS from Schmidt-Kaler from B3 V through A0 V. The central line is for E(B-V) = 0.55 mag; lines to the left and right have been shifted by -0.1 and +0.1 mag, respectively in (B-V). (V and B-V are in magnitudes in all figures.) (right) The Eastwood sample within 3’ of η Car. Again, the lines are the ZAMS from Schmidt-Kaler from B3 V through A0 V for E(B-V) = 0.45, 0.55, and 0.65 mags from left to right.
Fig. 2.— The center of Chandra ACIS image with the late B stars marked. The image is event data color coded for energy (red = 0.5-2 keV, green = 2-7 keV) and smoothed with a gaussian. Thus, X-ray sources appear red if they are soft, green if they are hard, yellow for in-between. η Car is the object in the middle, which is piled up. The green nearly- horizontal line is the readout streak from η Car. The surrounding red diffuse object is the η Car X-ray nebula. Image coordinates are J2000. The yellow circle outlines the 3’ search region. Blue symbols are X-ray detected late B stars (crosses: Cudworth, Table 3; diamonds: Eastwood, Table 3); purple symbols are late B stars which were not detected (squares: Cudworth; circles: Eastwood).
Fig. 3.— (left) The Cudworth sample after cuts in V and B-V. Lines are the Schmidt-Kaler ZAMS. Dots are detected in X-rays; x’s are not. (right) The Eastwood sample after cuts in V and B-V. Lines are the Schmidt-Kaler ZAMS. Dots are detected in X-rays; x’s are not.
Fig. 4.— Median X-ray energy as a function of log of net counts for X-ray sources from ACIS Extract (AE). Dots are sources from both the Cudworth and Eastwood lists. x’s are sources from the Skiff catalog of O and early B stars.
Fig. 5.— X-ray spectra and time series for FA69, FA52, Y188, and FB238 (top to bottom). Single-temperature thermal plasma models are overplotted on the spectra (left panels). For the fits NH is 1022 cm −2 and kT is in keV. Temporal variation in photon flux is depicted by
both binned and adaptively smoothed light curves (right panels, solid, left ordinate axis). Flux variability is quantified by a p-value (see text) for the no-variability hypothesis, esti-mated via the Kolmogorov-Smirnov (KS) statistic, shown as PKS in the right panels.
Tempo-ral variation in median X-ray energy is depicted by binned time series (right panels, dotted, right ordinate axis). Both time series are not corrected for background.