HAL Id: inserm-00951425
https://www.hal.inserm.fr/inserm-00951425
Submitted on 24 Feb 2014
HAL is a multi-disciplinary open access archive for the deposit and dissemination of sci-entific research documents, whether they are pub-lished or not. The documents may come from teaching and research institutions in France or abroad, or from public or private research centers.
L’archive ouverte pluridisciplinaire HAL, est destinée au dépôt et à la diffusion de documents scientifiques de niveau recherche, publiés ou non, émanant des établissements d’enseignement et de recherche français ou étrangers, des laboratoires publics ou privés.
Combining calcium imaging with other optical
techniques.
Marco Canepari, Dejan Zecevic, Kaspar Vogt, David Ogden, Michel de Waard
To cite this version:
Marco Canepari, Dejan Zecevic, Kaspar Vogt, David Ogden, Michel de Waard. Combining calcium imaging with other optical techniques.: Ca 2+ Imaging and Other Optical Techniques. Cold Spring Harbor protocols, Cold Spring Harbor, NY : Cold Spring Harbor Laboratory Press, 2013, 2013 (12), pp.1125-31. �10.1101/pdb.top066167�. �inserm-00951425�
TOPIC INTRODUCTION Title page
Combining Ca
2+Imaging with Other Optical Techniques
SHORT TITLE: Ca2+ Imaging and Other Optical Techniques
Marco Canepari
1,2, Dejan Zecevic
4, Kaspar E Vogt
3, David Ogden
5, Michel De
Waard
1,21
Inserm U836, Team 3, BP 170, Grenoble Cedex 09, F-38042, France
2
Université Joseph Fourier, Grenoble Institut des Neurosciences, France
3
Division of Pharmacology and Neurobiology, Biozentrum – University of Basel, Switzerland
4
Department of C/M Physiology, Yale University School of Medicine, New Haven, CT, USA
5
Laboratoire de Physiologie cérébrale, UMR8118, Université Paris Descartes, 75006 Paris, France
Address correspondence to: [email protected]
ABSTRACT
Ca2+ imaging is a commonly used approach to measure Ca2+ signals at high spatial resolution. The method is often combined with electrode recordings to correlate electrical and chemical signals or to investigate Ca2+ signals following an electrical stimulation. To obtain information on electrical activity at the same spatial resolution, Ca2+ imaging must be combined with membrane potential imaging. Similarly, stimulation of subcellular compartments requires photostimulation. Thus, combining Ca2+ imaging with an additional optical technique facilitates the study of a number of physiological questions. The aim of this chapter is to introduce some basic principles on how to combine Ca2+ imaging with other optical techniques. We will focus on: 1. the design of the optics; 2. the design of experimental protocols; 3. the optical characteristics of the Ca2+ indicators and of the additional optical probe used in combination with the Ca2+ indicator; 4 the affinity of the Ca2+ indicator in relation to the type of measurement. This chapter will enable the reader to devise an optimal strategy for combined optical experiments.
INTRODUCTION
Ca2+ imaging is a very powerful approach allowing measurement of the intracellular free Ca2+ concentration change (∆[Ca2+]i) or of the Ca2+ influx (ICa) simultaneously from multiple sites, including
different cells in a network or different compartments within a cell. Using confocal microscopy or two-photon imaging, the improved spatial resolution permits recordings from sub-micron structures such as
axonal terminals or dendritic spines. Whereas the principles of Ca2+ imaging and of related microscopy
techniques are described in other chapters, here we address the topic of combining Ca2+ imaging with
additional optical techniques, i.e. how to image simultaneously another important physiological variable or how to measure a Ca2+ signal following an optical stimulation.
Correlating a Ca2+ signal with another variable of biological interest at the same spatial resolution is often necessary to unambiguously answer a specific question. The example that we address here is the combination of Ca2+ imaging using calcium indicators with membrane potential (Vm) imaging using
voltage-sensitive dyes. Several types of Ca2+ signals are directly correlated with Vm changes and the
simultaneous recording of the two signals from same locations may facilitate the interpretation of results. ICa initiated by depolarization may also contribute to the further change in Vm when it originates
from Ca2+ channels in the plasma membrane, such as voltage-gated Ca2+ channels (VGCCs),
glutamate receptors (in particular NMDA receptors) and other Ca2+ permeable pores. In this case, the influx of Ca2+ cations represents a depolarizing current. In contrast to ICa through calcium channels in
the plasma membrane, Ca2+ signals are supposedly not directly correlated with Vm when they are due
exclusively to Ca2+ flux through internal membranes, such as those of the endoplasmic reticulum. In this case, Ca2+ flux does not contribute to the current underlying ∆Vm. Sometimes the source of Ca2+ signal
can be determined by using appropriate pharmacological tools. More often, however, Ca2+ signals originate from multiple sources and the combined Ca2+ and Vm imaging is the ideal experimental tool to
determine the composition of Ca2+ signals. In the subheading dedicated to this technique, we will give some examples illustrating this concept.
Ca2+ imaging can also be combined with photostimulation. Photostimulation may be necessary in experiments where physiological stimulation does not allow the separation and the study of different components of Ca2+. An example that we will describe below is the investigation of Ca2+ signals associated with activation of glutamate receptors using L-glutamate photorelease from caged compounds. In this type of study, the different Ca2+ components associated with synaptic signals (ICa
from AMPA or NMDA receptors and Ca2+ signals associated with activation of metabotropic glutamate
receptors) cannot be easily separated from Ca2+ signals from VGCCs using synaptic stimulation, because pharmacological manipulation of VGCCs also affects presynaptic function. In a separate
section, we will discuss how combining Ca2+ imaging with L-glutamate uncaging can be used to investigate Ca2+ signaling associated with activation of metabotropic receptors.
MICROSCOPY PRINCIPLES OF COMBINING TWO OPTICAL TECHNIQUES
Combining optical techniques for functional studies requires particular attention to the design of the experiment in order to make the measurement possible and to facilitate the interpretation of the results. The design of the experiment starts from the optical properties of the two molecules that are utilized. In fluorescence measurements, the relevant properties of optical probes include the absorption and the emission spectra of the indicators and the absorption (or excitation) spectrum of the caged compound. For a “dual” imaging experiment, the two indicators can be excited at the same wavelength if the emission spectra of the two dyes are different permitting separation and independent acquisition of signals with two detectors. This arrangement, however, has the disadvantage that both indicators must always be excited at same intensity and for the same duration, a condition that is rarely ideal. Another possibility is to alternate two excitation wavelengths and to use only one detector utilizing dyes that have different absorption spectra but largely overlapping emission. Using this protocol, however, a strictly simultaneous imaging cannot be achieved. The ideal condition is met by using two indicators having separate absorption and emission spectra. In this case, it is possible to design the experiment to permit simultaneous illumination at two separate wavelengths and independent acquisition of the two
fluorescence signals (Fig. 1A). The simultaneous Vm and Ca2+ imaging can be achieved by using Fura
Ca2+ indicators, that can be excited by UV light and that emit in the blue/green region, together with commercial styryl voltage-sensitive dyes (for example di-4-ANEPPS, di-8-ANEPPS and JPW-1114) that are excited with green light and that emit in the red/IR region (Canepari et al. 2007; Canepari et al. 2008; Canepari and Vogt 2008; Vogt et al. 2011). The same principle of dual illumination also applies to combine Ca2+ imaging with photostimulation. In uncaging experiments, UV light is normally used for photorelease while blue light is typically inert to caged compounds. Thus, blue-excitable Ca2+ indicators such as Fluo, Oregon Green or Calcium Green dyes are ideal for this application. For dual illumination, two light sources can be directed to the epifluorescence port of the microscope using a dichroic mirror (Fig. 1B) and reflected to the preparation. This configuration is not ideal to obtain whole-field illumination with lasers (Canepari et al. 2010). In this case, illumination can be done directly from above the objective (Fig. 1C) and a multiple-band dichroic mirror should be chosen if the transmission of two separate fluorescence bands is necessary (Vogt et al. 2011). Details on the specific configuration for simultaneous Vm and Ca2+ imaging are given in Protocol 1.
FIGURE 1. Principles for combining two optical techniques. (A) Ideal combination of optical techniques based on two photo-excitable molecules: molecules are excited by two different wavelengths λ1 and λ2; for fluorescent indicators, fluorescence
signals 1 and 2 are separated and acquired independently. (B) Schematic drawing of a possibility for dual illumination and acquisition: excitation wavelengths λ1 and λ2 are both introduced via the epifluorescence port of the microscope using a
dichroic mirror; a second dichroic mirror separates fluorescence signals 1 and 2. (C) Another possibility where illumination at
λ2 is introduced from the top of the microscope; a dual band dichroic mirror is necessary to transmit signals 1 and 2. (D)
Schematic spectra of Fura indicators (top) and styryl voltage sensitive dyes Di-8-Anepps or JPW1114: for Fura both excitation at minimal (dotted line) and maximal Ca2+ (straight line) are illustrated; excitation wavelengths λ1 and λ2 and
Ca2+and Vm emission signals are indicated.
APPLICATION 1: COMBINING C2+AND VM OPTICAL MEASUREMENTS
A minimal overlap in the absorption and emission, meeting the ideal condition for combining Ca2+ and Vm optical measurements, is obtained with styryl voltage-sensitive dyes (e.g. di-8-ANEPPS or
JPW1114) and with Fura based Ca2+ indicators (Fig. 1D). It is only recently that it became possible to
image Ca2+ and Vm simultaneously (Vogt et al. 2011, see also Protocol 1). Thus, sequential Ca2+ and Vm
imaging was utilized in several studies where signals were proven to be consistent in different trials (Canepari et al. 2007; Milojkovic et al. 2007; Berger et al. 2007; Canepari and Vogt 2008). In this type of experiment, the choice of the Ca2+ indicator is fundamental. Fura indicators are available with different dissociation constants (Kd). The Kd and the concentration of the indicator determine whether a transient
Ca2+ in the cytosol binds mostly to the dye or to endogenous buffer of the cell (Canepari et al. 2008). In the first case, which is in most cases met with high-affinity Ca2+ indicators (Kd < 1 µM) such as Fura-2 or
Bis-Fura-2 at concentrations >300 µM, the Ca2+ bound to the dye is nearly the total Ca2+ . Thus, it is possible to correlate ∆Vm with the cumulative total cytosolic Ca2+ concentration which is proportional to
the fractional change of fluorescence (i.e. the ratio between the change of fluorescence and the initial fluorescence). However, because the free Ca2+ is tightly buffered by the indicator, physiologically important downstream signaling and Ca-dependent processes that regulate Ca influx, release and uptake are prevented from occurring. In the second case, which requires the use of low-affinity Ca2+
indicators (Kd > 5 µM) such as Fura-FF or Mag-Fura-2, the Ca2+ bound to the dye has minimal impact
on the endogenous cell reactions. Thus, it is possible to correlate ∆Vm with the physiological ∆[Ca2+]i,
proportional to the change of Ca2+ indicator fluorescence normalized to the indicator fluorescence at resting [Ca2+]i. Fura indicators allow ratiometric measurements in which fluorescence increases or
decreases with Ca2+ depending on whether the indicator is excited below or above its isosbestic wavelength (~360 nm). Imaging above the isosbestic wavelength has several advantages. First, the
resting fluorescence, which corresponds to nominally zero Ca2+, is the maximal fluorescence. Second,
the contrast of healthy cells is high because they have low resting Ca2+ and the fluorescence of the extracellular dye is quenched. Third, since the dynamic range is ~1, after subtraction of fluorescence at saturating Ca2+, these measurements allow better quantitative estimates of Ca2+ signals (Konishi et al.,
1991; Ogden et al., 1995). The comparison of the ratios between bound Ca2+ and free Ca2+ (buffering
capacity), a parameter that can be estimated both for the indicator (κdye) and for the cell (κcell), is the key
factor to determine in which regime a Ca2+ imaging experiment is performed. For the indicator, κdye is
given by the ratio between its concentration and its Kd. For the cell, κcell can be measured using specific
imaging protocols (see for example Neher and Augustine 1992; Zhou and Neher 1993; Lips and Keller 1998; Palecek et al. 1999).
The choice of κdye>>κcell is advisable when the aim of the study is to correlate ∆Vm with ICa via
channels located in the plasma membrane. An example of this type of experiment is the measurement of Ca2+ signals associated with induction of long-term potentiation of excitatory synapses CA1 hippocampal pyramidal neurons (Canepari et al. 2007). At these synapses, back-propagating action potentials (bAPs) activate VGCCs whereas excitatory postsynaptic potentials (EPSPs) produce ICa via
Ca2+ permeable ionotropic glutamate receptors, mainly NMDA receptors. When EPSPs are paired with
bAPs, depolarization from bAPs unblocks NMDA receptors from Mg2+ increasing ICa through these
channels, whereas depolarization from EPSPs may inactivate A-type K+ channels boosting the
depolarization (Magee and Johnston 1997). The result is a potentiated ICa correlated with an increased
or more prolonged depolarization, exclusively at the site where EPSPs originate. Here we use the experiment to investigate this phenomenon as an example of recordings with κdye >> κcell. In Fig. 2A-C, a
300 µM of the Ca2+ indicator Bis-Fura-2 (Kd ~ 500 nM). In this type of neuron κcell has been estimated to
be ~100 in the dendrites and ~20 in the spines (Sabatini et al. 2002). Thus, the condition κdye >> κcell is
valid both in the dendrite and in the spines. The analysis of this experiment concentrates on ∆Vm and
Ca2+ signals from two sample dendritic regions (a and b). One region (a) is recognized as the site of synaptic inputs since Ca2+ signals are observed with EPSPs evoked by adjacent extracellular stimulation (data not shown). The other region (b), far from the origin of EPSPs, is used as control site. The action potential initiated in the soma propagates back in the dendrites (Fig. 2B, top) producing a small ICa in both a and b. The amplitude of the action potential was boosted by pairing with a burst of 5
EPSPs in a, where also the associated Ca2+ signal was strongly enhanced (Fig. 2B, bottom). The same
phenomenon was not observed in the control region b. Thus, as expected, a larger ICa was correlated
with a larger depolarization (Fig. 2C).
The relationship κcell >> κdye must be satisfied when the aim of the experiment is to correlate ∆Vm
with ∆[Ca2+]i under physiological calcium homeostasis. Indeed, if an investigated phenomenon depends
on the intact dynamics of Ca2+ which is naturally regulated by Ca2+-binding proteins, a significant buffering by the indicator will produce artificial results. As example of this scenario we use another interesting phenomenon; also related to synaptic plasticity, occurring at cerebellar parallel fibre (PF) –
Purkinje neuron (PN) synapses. PF-PN EPSPs can evoke local Ca2+ spikes and high-frequency (50-200
Hz) of EPSPs can evoke bursts of local Ca2+ spikes (Canepari and Vogt 2008). ∆[Ca2+]i signals
associated with Ca2+ spikes, however, progressively increase during the burst producing a phenomenon
of non-linear Ca2+ summation. The mechanism underlying this increase is the local and transient saturation of the endogenous buffer which is not correlated with size of the spikes. In Fig. 2D-E, a PN
was loaded with the voltage sensitive dye JPW-1114 and with 1 mM of the Ca2+ indicator Fura-FF (Kd ~
10 µM). Because dendritic κcell in the PN is estimated to be ~2000 (Fierro and Llano 1996), the condition
of κcell >> κdye is valid in this experiment. Optical signals related to membrane potential transients were
also calibrated on an absolute scale (in mV) using a prolonged non-attenuating hyperpolarization (Roth and Häusser 2001) as described in Canepari at al. (2008). In the recording of Fig. 2D, a burst of seven PF-EPSPs at 100 Hz produced Ca2+ spikes of the same size, but ∆[Ca2+]i components sequentially
increasing (Fig. 2E). Under conditions of κcell << κdye, obtained by using millimolar concentrations of
Bis-Fura-2, the additional buffering capacity of the indicator prevents the transient saturation resulting in equal Ca2+ components associated Ca2+ spikes. The need for κcell >> κdye is therefore obvious for this
type of measurement.
The analysis of Ca2+ signaling associated with excitatory synaptic transmission is complicated by the fact that extracellular application of pharmacological tools, necessary to separate various Ca2+ components, often causes presynaptic effects. A way to investigate the consequence of glutamate receptor activation, without excitation of presynaptic terminals, is to use photorelease of L-glutamate from caged compounds. This approach fulfills the ideal requirement of mimicking synaptic transmission on a small spatial scale and a fast time scale. A widely used caged compound is the 4-methoxy-7-nitroindolinyl L-glutamate (MNI-glutamate), caged L-glutamate which has sub-microsecond kinetics (Morrison et al 2002) and thermally stable and efficient in photorelease (Papageorgiou et al. 1999; Papageorgiou and Corrie 2000). It has been in use for more than 10 years, and the only negative side – action found is a low affinity block of GABAA receptors by the cage itself (IC(50) block = 0.6 mM, Fino et
al. 2009). Nevertheless it is essentially biologically inert in its caged precursor form at 1 mM and in the photolytic intermediates and by-products (Canepari et al. 2001a).
Good spatial resolution in experiments combining imaging with photolysis can be achieved in two ways. First, excitation of photolysis at a spatial resolution of 1 micron can be achieved with laser photolysis with one or two photon excitation. With extracellular cages like MNI-L-glutamate the main difficulty is the absorption of photolysis light by the cage in the bath – an inner filtering- resulting in poor penetration to the focus at the peak absorption wavelengths near 340 nm. This effect can be overcome by using wavelengths away from the absorption peak. For MNI-caged ligands a 405 nm laser is effective, producing a 1 µm spot, and efficient enough to produce full photolysis conversion without phototoxicity (Trigo et al, 2009). Two-photon photolysis (Matsuzaki et al., 2001; Carter and Sabatini 2004; Noguchi et al. 2005; Nikolenko et al. 2007) also avoids the inner filtering effect, however two-photon excitation of MNI-glutamate, and all other cages currently available, has very poor efficiency relative to one photon excitation. Because of the small volume in laser spot photolysis it is necessary to use brief stimulations, less than 300 µs duration, to maintain spatial resolution without smearing due to diffusion. In the second approach spatial resolution can be achieved by uniform wide field photolysis combined with spatially resolved imaging to monitor the distribution and time course of fluorescence. In this case photolysis pulses of 1 ms can be used with a flashlamp (Canepari et al. 2001a, 2001b, 2004; Canepari and Ogden 2003, 2006), or longer exposures with LED (Bernardinelli et al. 2005) or shuttered arc lamp illumination.
An important requirement in combined Ca2+ imaging and photolysis is that the excitation wavelength
of the Ca2+ indicator does not produce photolysis. For MNI-glutamate, wavelengths ≥ 420 nm satisfy this requirement. Imaging with Fura indicators can still be done at 420 nm (Ogden et al. 1995; Canepari et al. 2004), but blue-excitable Ca2+ indicators (such as Fluo, Oregon-Green or Calcium Green dyes) which show a fluorescence increase may be preferable for this application. Fig. 3 shows an example of
combined Ca2+ imaging with L-glutamate uncaging (from Canepari and Ogden 2006). A rat PN was filled with the Oregon Green BAPTA-5N indicator (Kd ~ 35 µM) at 0.9 mM concentration. L-glutamate
was photoreleased over the whole dendritic tree. Fig. 3A shows a dendritic region from which Ca2+
fluorescence was averaged. To study Ca2+ signals mediated by type-1 metabotropic glutamate
receptors, voltage-gated Na+ and Ca2+ channels, AMPA receptors, NMDA receptors and GABAA
receptors were blocked by tetrodotoxin (1 µM), agatoxin IVA (250 nM), NBQX (100 µM), AP5 (50 µM) and bicuculline (20 µM). Activation of mGluR1 triggered two independent intracellular Ca2+ pathways. At -77 mV holding potential (HP), mGluR1 activated a slow non-selective cation conductance (Canepari et al. 2001b) permeable to Ca2+ (Canepari et al. 2004) (Fig. 3B left). At -12 mV HP, mGluR1 also triggered Ca2+ release from stores via InsP3 receptors, leading to an outward K+ current from BK channels
(Canepari and Ogden 2006) (Fig. 3B right), thus distinguishing two mGluR pathways based on kinetics and prior Ca2+ influx.
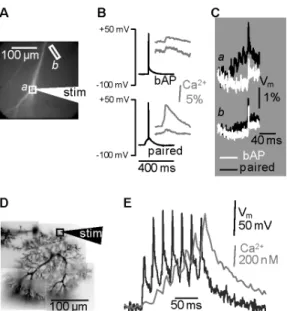
FIGURE 2. Combining Vm and Ca 2+
imaging (A) Area of optical recording of a CA1 hippocampal pyramidal neuron filled with the voltage sensitive dye JPW1114 and with the Ca2+ indicator Bis-Fura-2 (300 µM); two regions a and b and the position of the stimulating electrode indicated. (B) Somatic ∆Vm (black traces) and Ca
2+
signals from a and b (grey traces) associated with a bAP (top) and with the pairing of 5 EPSPs and 1 bAP. (C) ∆Vm optical signals from a and b associated with the bAP
(white traces) and with the pairing protocol (black traces). (D) A PN filled with the voltage sensitive dye JPW1114 and with the Ca2+ indicator Fura-FF (1 mM); a region and the position of the stimulating electrode indicated. (E) ∆Vm (left) and Ca
2+
FIGURE 3. Ca2+ signals mediated by mGluR1 activation and elicited by L-glutamate photorelease in cerebellar Purkinje neurons. (A) Fluorescence image of a sub-region of a PN filled with Oregon Green BAPTA-5N. (B) Somatic membrane current (black traces) and Ca2+ signals (gray traces) from the region in A and mediated by mGluR1 activation and elicited by L-glutamate photorelease; left: signals at -77 mV holding potential (HP); right: signals at -12 mV holding potential.
REFERENCES
Berger T, Borgdorff A, Crochet S, Neubauer FB, Lefort S, Fauvet B, Ferezou I, Carleton A, Lüscher HR, Petersen CC. 2007. Combined voltage and calcium epifluorescence imaging in vitro and in vivo reveals subthreshold and suprathreshold dynamics of mouse barrel cortex. J Neurophysiol 97: 3751-3762.
Bernardinelli Y, Haeberli C, Chatton JY. 2005. Flash photolysis using a light emitting diode: an efficient, compact, and affordable solution. Cell Calcium 37: 565-572.
Canepari M, Auger C, Ogden D. 2004. Ca2+ ion permeability and single channel properties of the parallel fibre metabotropic slow EPSC of rat Purkinje neurons. J Neurosci 24: 3563-3573.
Canepari M, Djurisic M, Zecevic D. 2007. Dendritic signals from rat hippocampal CA1 pyramidal neurons during coincident pre- and post-synaptic activity: a combined voltage- and calcium imaging study. J Physiol 580: 463-484.
Canepari M, Nelson L, Papageorgiou G, Corrie JE, Ogden D. 2001a. Photochemical and pharmacological evaluation of 7-nitroindolinyl-and 4-methoxy-7-nitroindolinyl-amino acids as novel, fast caged neurotransmitters. J Neurosci Meth 112: 29-42.
Canepari M, Papageorgiou G, Corrie JE, Watkins C, Ogden D. 2001b. The conductance underlying the parallel fibre slow EPSP in rat cerebellar Purkinje neurones studied with photolytic release of L-glutamate. J Physiol 533: 765-772.
Canepari M, Ogden D. 2003. Evidence for protein tyrosine phosphatase, tyrosine kinase, and G-protein regulation of the parallel fiber metabotropic slow EPSC of rat cerebellar Purkinje neurons. J
Neurosci 23: 4066-4071.
Canepari M, Ogden D. 2006. Kinetic, pharmacological and activity-dependent separation of two Ca2+ signalling pathways mediated by type 1 metabotropic glutamate receptors in rat Purkinje neurons.
J Physiol 573: 65-82.
Canepari M, Vogt KE. 2008. Dendritic Spike Saturation of Endogenous Calcium Buffer and Induction of Postsynaptic Cerebellar LTP. PLoS ONE 3: e4011.
Canepari M, Vogt K, Zecevic D. 2008. Combining voltage and calcium imaging from neuronal dendrites.
Cell Mol Neurobiol 58: 1079-1093.
Canepari M, Willadt S, Zecevic D & Vogt KE. 2010. Imaging inhibitory synaptic potentials using voltage sensitive dyes. Biophys J 98: 2032-2040.
Carter AG, Sabatini BL. 2004. State-dependent calcium signaling in dendritic spines of striatal medium spiny neurons. Neuron 44: 483-493.
Fierro L, Llano I. 1996. High endogenous calcium buffering in Purkinje cells from rat cerebellar slices. J
Physiol 496: 617-625.
Fino E, Araya R, Peterka DS, Salierno M, Etchenique R, Yuste R. 2009. RuBi-Glutamate: Two-Photon and visible-light photoactivation of neurons and dendritic spines. Front Neural Circuits 3: 2
Konishi M, Hollingworth S, Harkins AB, Baylor SM. 1991. Myoplasmic calcium transients in intact frog skeletal muscle fibers monitored with the fluorescent indicator furaptra. J Gen Physiol97: 271-301. Lips MB, Keller BU. 1998. Endogenous calcium buffering in motoneurones of the nucleus hypoglossus
from mouse. J Physiol 511: 105-117.
Magee JC, Johnston D. 1997. A synaptically controlled, associative signal for Hebbian plasticity in hippocampal neurons. Science 275: 209-213.
Matsuzaki M, Ellis-Davies GCR, Nemoto T, Miyashita Y, lino M, Kasai H. 2001. Dendritic spine geometry is critical for AMPA receptor expression in hippocampal CA1 pyramidal neurons. Nat
Neurosci 4: 1086-1092.
Milojkovic BA, Zhou WL, Antic SD. 2007. Voltage and calcium transients in basal dendrites of the rat prefrontal cortex. J Physiol 585: 447-468.
Morrison J, Wan P, Corrie JET, Papageorgiou G. 2002. Mechanisms of photorelease of carboxylic acids from 1-acyl-7-nitroindolines in solutions of varing water content. Photochem. Photobiol Sci 1: 960–969.
Neher E, Augustine GJ. 1992. Calcium gradients and buffers in bovine chromaffin cells. J Physiol 450: 273-301.
Nikolenko V, Poskanzer KE, Yuste R. 2007. Two-photon photostimulation and imaging of neural circuits. Nat Methods 4: 943-950.
Noguchi J, Matsuzaki M, Ellis-Davies GC, Kasai H. 2005. Spine-neck geometry determines NMDA receptor-dependent Ca2+ signaling in dendrites. Neuron 46: 609-622.
Ogden D, Khodakhah K, Carter T, Thomas M, Capiod T. 1995. Analogue computation of transient changes of intracellular free Ca2+ concentration with the low affinity Ca2+ indicator furaptra during whole- cell patch- clamp recording. Pflugers Arch 429: 587- 591.
Palecek J, Lips MB, Keller BU. 1999. Calcium dynamics and buffering in motoneurones of the mouse spinal cord. J. Physiol 520: 485-502.
Papageorgiou G, Corrie JET. 2000. Effects of aromatic substituents on the photocleavage of 1-acyl-7-nitroindolines. Tetrahedron 56: 8197-8205.
Papageorgiou G, Ogden D, Barth A, Corrie JET. 1999. Photorelease of carboxylic acids from 1-acyl-7-nitroindolines in aqueous solution: Rapid and efficient photorelease of L-glutamate. J Am. Chem
Roth A, Häusser M. 2001. Compartmental models of rat cerebellar Purkinje cells based on simultaneous somatic and dendritic patch-clamp recordings. J Physiol 535: 445-472.
Sabatini BS, Oertner TG, Svoboda K. 2002. The life cycle of Ca2+ ions in dendritic spines. Neuron 33:
439–452.
Sobie EA, Kao JP, Lederer WJ. 2007. Novel approach to real-time flash photolysis and confocal [Ca2+] imaging. Pflugers Arch 454: 663-673.
Trigo FF, Corrie JE, Ogden D. 2009. Laser photolysis of caged compounds at 405 nm: photochemical advantages, localisation, phototoxicity and methods for calibration. J Neurosci Meth 180: 9-21. Vogt KE, Gerharz S, Graham J, Canepari M (2011) High-resolution simultaneous voltage and Ca2+
imaging. J Physiol 589: 489-494.
Wang SS, Augustine GJ. 1995. Confocal imaging and local photolysis of caged compounds: dual probes of synaptic function. Neuron 15: 755-760.
Zhou Z, Neher E. 1993. Mobile and immobile calcium buffers in bovine adrenal chromaffin cells. J