HAL Id: emse-00410635
https://hal-emse.ccsd.cnrs.fr/emse-00410635
Submitted on 21 Aug 2020HAL is a multi-disciplinary open access
archive for the deposit and dissemination of sci-entific research documents, whether they are pub-lished or not. The documents may come from teaching and research institutions in France or abroad, or from public or private research centers.
L’archive ouverte pluridisciplinaire HAL, est destinée au dépôt et à la diffusion de documents scientifiques de niveau recherche, publiés ou non, émanant des établissements d’enseignement et de recherche français ou étrangers, des laboratoires publics ou privés.
Assessing population exposure to odorous pollution from
a landfill over complex terrain
Caroline Riesenmey, Charles Chemel, Hervé Vaillant, Mireille Batton-Hubert
To cite this version:
Caroline Riesenmey, Charles Chemel, Hervé Vaillant, Mireille Batton-Hubert. Assessing population exposure to odorous pollution from a landfill over complex terrain. Hartwig Dobesch; Pierre Dumolard; Izabela Dyras. Spatial Interpolation for Climate Data: The Use of GIS in Climatology and Meterology, Wiley-ISTE, 2007, �10.1002/9780470612262.ch20�. �emse-00410635�
Assessing Population Exposure to
Odorous Pollution from a Landfill
over Complex Terrain
20.1. Introduction
Odors from landfill sites may lead to serious olfactory nuisances for communities that surround them. Though this pollution may be attributed to increases in the emission of landfill gases, they are usually associated with meteorological conditions, which drive their dispersion [SAR03]. Landfill sites are often located over a complex topography for convenience which is mainly related to waste disposal and masking purpose. Consequently, the impacts of these odors (for instance in terms of population exposure) are difficult to assess [BOR 06]. To proceed, a geo-statistical approach is generally not possible because of scant measurements (odors cannot be easily measured) and difficulties in quantifying a subjective perception, which is variable in space and time, as well as in interpolating measurement points over a complex terrain. Conversely, numerical simulations might be a useful approach to access the details of small-scale atmospheric flow fields, which drive the dispersion of plumes of pollutants around a landfill site. Gaussian models are usually found to be insufficient to reproduce local atmospheric circulations since they are based on basic physics and oversimplified initialization. Nonetheless, we may note that the meteorological models are worth even less than the commonly used Gaussian models in accounting for the small-scale atmospheric processes if accurate input data is not available. The objectives of our study then are
Caroline RIESENMEY, Charles CHEMEL, Hervé VAILLANT and Mireille BATTON-HUBERT
Spatial Interpolation for Climate Data Edited by Hartwig Dobesch, Pierre Dumolard & Izabela Dyras Copyright 0 2007, ISTE Ltd.
(i) to provide enough accurate terrain data to ensure a realistic dispersion of odors around a landfill site as calculated by a meteorological model and (ii) to use the model results to focus on assessing the population exposure to odorous pollution. For this purpose, GIS tools are applied and the accuracy of the data is discussed.
This chapter is organized as follows: in section 20.2, the landfill site and meteorological model are presented. Then, GIS tools are applied to supply ARPS with accurate terrain description of the landfill area. In section 20.3, selected model results are discussed and a map of the population exposure to odorous pollution is produced by using GIS tools. Finally, conclusions are given in section 20.4.
20.2. Model set-up
20.2.1. Description of the landfill area
The waste disposal facility is located over a hilly terrain near Saint-Etienne in the Rhône-Alpes-Auvergne French region (see Figure 20.1). The complex topography of this area makes the assessment of the airflow at least challenging. The landfill is one of the fifth largest landfills in France: the site receives about 500,000 tons of waste every year. The facility opened 30 years ago and should stop in about 15 years. It is situated in the vicinity of urban areas (including three cities with populations greater than 10,000 inhabitants). Thus, the landfill site is a potential source of odors, which may affect surrounding communities.
20.2.2. Meteorological modeling
Meteorological conditions leading to odorous pollution events have been identified by using a statistical analysis from meteorological data recorded in situ and an inventory of complaints from the surrounding communities [RIE05]. Nine local weather conditions were identified and two of them were found to lead to the majority of the recorded complaints, that is, fair weather with high-pressure systems in both winter and summer. High-resolution numerical simulations of typical days which are representative of these two meteorological conditions have been conducted with the ARPS (Advanced Regional Prediction System) model [XUE00]:
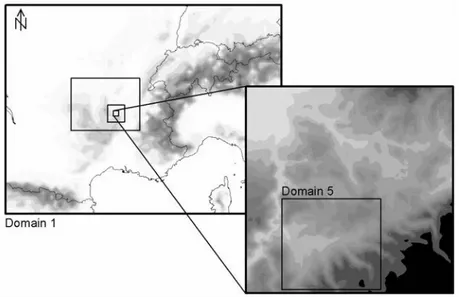
a specific Eulerian model of dispersion was developed to trace odors and marked passive scalars were emitted from the work face every 15 minutes. Emission rates were calculated from concentration measurements realized during a working day. Several nested domains were used for the downscaling procedure (see Figure 20.2). The larger domain (Domain 1) was driven by the ECMWF (European Center for Medium-Range Weather Forecasts) gridded analyses. The finer grid (Domain 5) encompasses a domain of about 10 km x 10 km with a 100-m horizontal resolution.
Figure 20.1. Map of the landfill area
Figure 20.2. Nested domains used for simulations with ARPS
South of City 1
Spatial limit of the landfill site
City 2 Main valley Tributary City 3 Waste cells
20.2.3. Terrain data
The terrain properties used in ARPS are orography, soil and vegetation types, and surface roughness. Data sets for Domain 1 to 3 were obtained from NGDC (National Geophysical Data Center). As for the terrain data for the two finer resolution domains (Domains 4 and 5), it was obtained from aerial photographs and IGN (National Geographic Institute) maps, and processed with the ArcGISTM software.
20.2.3.1. Orography
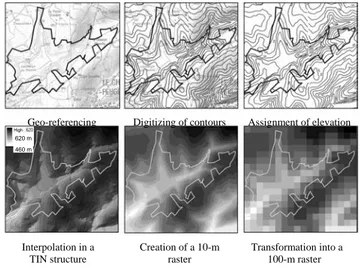
Orography was handled from an IGN 1:125,000 scale topographic map covering the two finer domains (Domains 4 and 5). As an example, Figure 20.3 shows the six steps which were necessary to determine the altitude of each grid point in Domain 5, namely:
– georeferencing of the scanned IGN map in the Lambert II coordinate system; – digitizing contours into a line layer and assigning an altitude for each line; – linear interpolation of the elevation lines in a TIN (Triangular Irregular Network) data structure;
–raster encoding with a cell resolution of 10 m from the TIN layer;
– creation of raster with a cell resolution of 100 m from the existing 10-m layer. Each 100-m cell is assigned the value of the center 10-m cell;
– export of the attribute table in a text file containing the geographical coordinates and the elevation for each 100-m cell center.
Figure 20.3. Necessary steps to assign terrain elevation to the finer grid (Domain 5) Geo-referencing Digitizing of contours Assignment of elevation
Interpolation in a TIN structure Creation of a 10-m raster Transformation into a 100-m raster 620 m 460 m
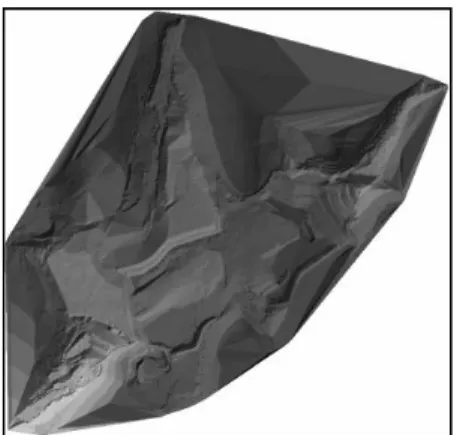
Burying waste modifies the elevation, geometry and slopes of the landfill site. The difference between the starting and final altitudes can be up to 90 m in a waste dump. Thus, orography changes over time. These modifications are accurately assessed by land surveyors and the successive topographical maps are described in AutoCAD® format files. These files are imported into the ArcGISTM software and used to create the contour defining the landfill area in ARPS (see Figure 20.4).
In order to obtain a raster which is representative of the hill and valley slopes, we need an intermediate step to convert the TIN layer into a 100-m raster. Creating a 10-m raster enables us to obtain the altitude at the center of the 100-m cell. Without this step, a 100-m raster from the TIN layer will only return the average elevation in each cell. The topography thus obtained is leveled out and summits and valleys are less prominent. Figure 20.5 shows the difference in the elevation with and without the 10-m raster creation step.
Figure 20.4. TIN layer of terrain elevation obtained from the AutoCAD® file created by the land surveyor
Figure 20.5. Differences between mean and centered values for the elevation calculation TIN structure Elevation using the mean values Elevation using the centered values
20.2.3.2. Land use
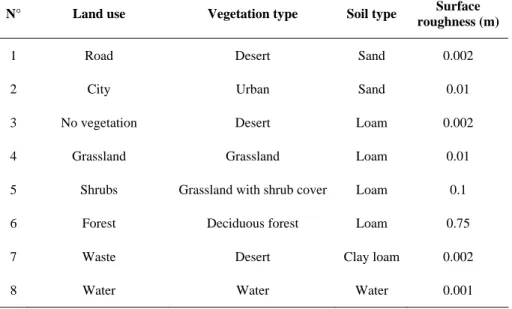
Soil and ground surface properties were obtained from an IGN 1:125,000 scale topographical map and aerial photographs of the site. As for elevation, the ArcGISTM software was used to process the data. Firstly, 8 land use classes were identified as representative in Domains 4 and 5. Soil and vegetation types, as well as surface roughness were assigned to each class, according to Table 1.1.
N° Land use Vegetation type Soil type Surface
roughness (m)
1 Road Desert Sand 0.002 2 City Urban Sand 0.01 3 No vegetation Desert Loam 0.002 4 Grassland Grassland Loam 0.01 5 Shrubs Grassland with shrub cover Loam 0.1 6 Forest Deciduous forest Loam 0.75 7 Waste Desert Clay loam 0.002 8 Water Water Water 0.001
Table 20.1. Land use classes used for simulations with ARPS
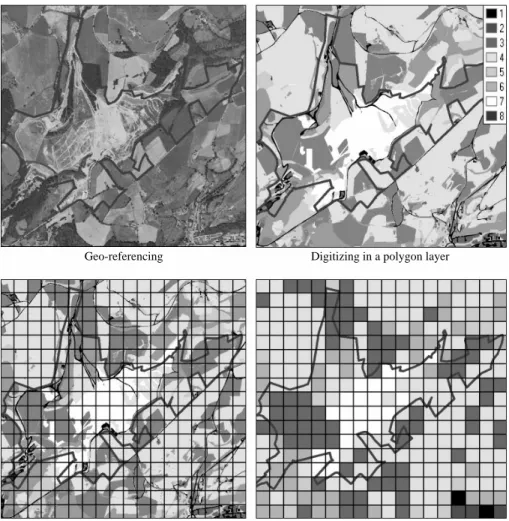
The necessary steps to integrate land use data in ARPS are as follows (see Figure 20.6 for an illustration of these steps applied to Domain 5):
– georeferencing of the IGN map and aerial photographs;
– digitizing the different land use classes by the creation of a polygon layer; – creation of a second polygon layer for which each polygon represents a 100-m cell (creation from a 100-m raster);
–overlaying the two polygon layers and their intersections;
– calculation of the area covered by each land use class for each cell; – allocation of the land use class with the largest area for each cell.
Contrary to orography, allocation of the centered value to the entire cell is not relevant. Furthermore, the use of centered values dramatically changes the results. Values obtained from the largest area in each cell are more representative and do not depend too much on the grid mesh.
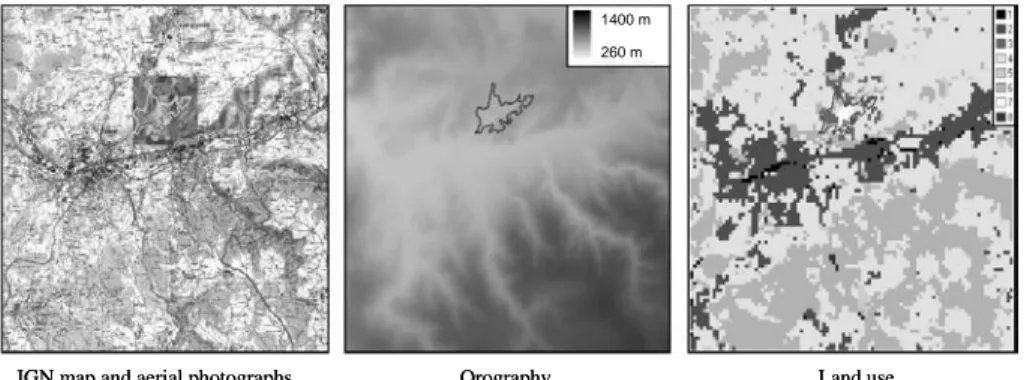
Figure 20.7 summarizes the description of both orography and land use for Domain 5.
Figure 20.6. Necessary steps to assign land use to the finer grid (Domain 5)
Allocation of a land use class Superimposition of the mesh and
intersection of the two layers
Figure 20.7. Description of orography and land use for the finer grid (Domain 5)
20.3. Model results
Two weather types were identified with a high risk of odorous pollution (see section 20.2.2). Below, the results obtained for a day which is representative of summer conditions (17 August 2002) are presented.
20.3.1. Case study: 17 August 2002
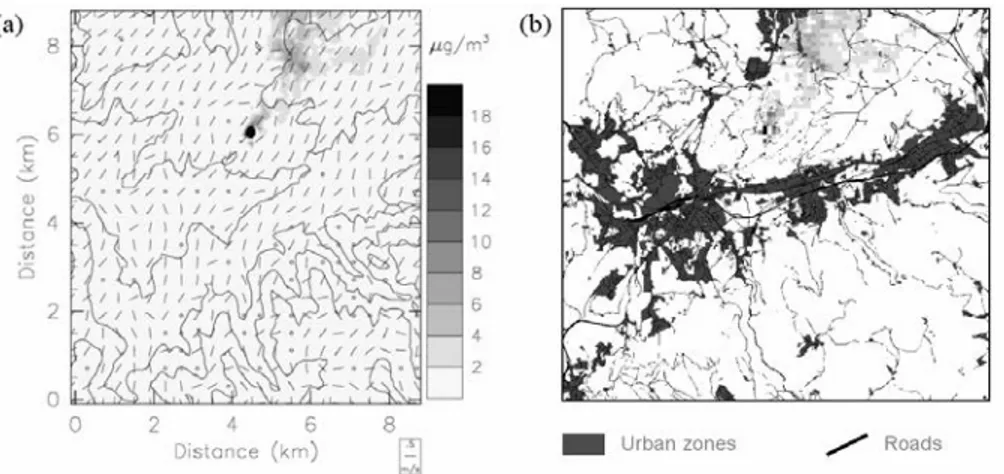
Figure 20.8 shows the dispersion of toluene (odor tracer) emitted from the landfill site at 0900 UTC (1100 LT). On the left is represented the dispersion of the plume of pollutant as calculated by ARPS and on the right the same results are integrated into ArcGISTM and superimposed on a layer containing urban areas [KOU 02]. This result could explain the complaints recorded in the city located northward of the site at midday. Even if the model results highlight pollutant dispersion and affected zones, it is difficult to accurately assess the population exposure without GIS output data processing.
20.3.2. Map of the population exposure
In this section, we show how GIS tools can be used to quantify population exposure to odorous pollution. Olfactory nuisances become acute when the odors are very offensive and/or are all-encompassing. The method used in order to obtain the most affected zones is composed of three steps:
IGN map and aerial photographs Orography Land use
IGN map and aerial photographs Orography Land use
1400 m 260 m
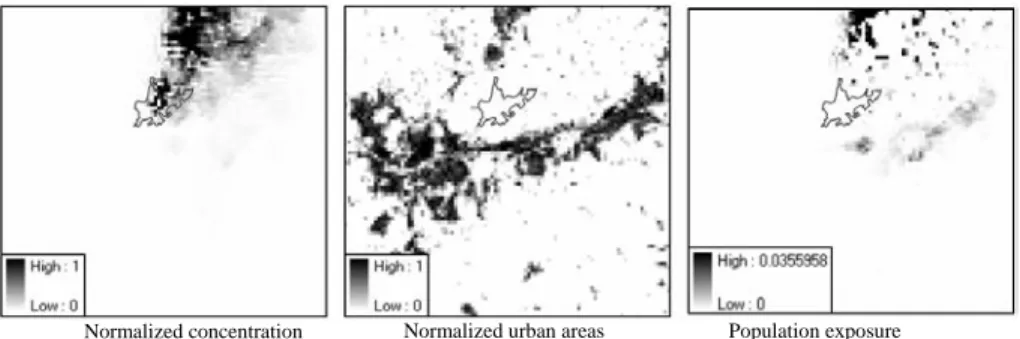
– normalization of the concentration field to obtain values comprised between 0 and 1: Cnorm = C/Cmax, where C is the concentration at the first level above the
ground surface and Cmax is the maximum concentration for the entire area;
– normalization of the population density: we use the ratio of the urban sector to the total area (population density data with a 100-m resolution is not available);
– multiplication of the two layers providing the population exposure.
Figure 20.9 shows the three 100-m rasters representing the normalized concentration, the normalized urban area and the population exposure obtained from the first two layers. This result is in excellent agreement with the inventory of complaints for this weather type: complaints occur in the morning in City 2 (south-eastward of the site) and in City 1 (northward of the site) in the middle of the day. The maximum value obtained in the third raster corresponds to a high-urbanized area and a weak concentration when compared with the maximal concentration obtained on the site. Note that the value representing the population exposure is not normalized, so that it would be possible to compare layers for different times (if the same normalization is used for all the times). Thus, the next step would be to superimpose rasters created from model results at different hours and to evaluate the most affected zones for each weather type.
Figure 20.8. (a) Toluene concentration field in the finer-resolved domain (Domain 5) at 0900
UTC (1100 LT) on 17 August 2002. (b) Same results integrated into ArcGISTM and
Figure 20.9. Assessment of population exposure to odorous pollution by combining pollutant dispersion with urbanization
20.4. Conclusion
Deterministic modeling is a well adapted tool to represent meteorology and pollutant dispersion with a fine resolution over a complex terrain. It enables us to understand the local phenomena driving odor dispersion and to identify the affected zones. The use of GIS tools is necessary to provide input terrain data for such a modeling system (no database is available at a scale which is fine enough) and to analyze model outputs. The accurate assessment of population exposure is not possible without post processing the data. GIS was found especially useful to refine the excessive model results and correlate the pollution dispersion with population density. This methodology could be improved by using other data to describe population characteristics (e.g. sensitive people, children, presence of a hospital) or by using arbitrary normalizations in order to give a heavier weight to some parameters (use of non-linear functions). These results may be useful to provide decision-making aids for communities and firms to control the impacts of future landfill sites and to modify existing facilities with a tailored approach which considers topography, land use and weather conditions.
20.5. Acknowledgements
This research has been supported by the SATROD society, which is a subsidiary of the SITA Group, in charge of the activities on the landfill site. All major calculations were performed with IDRIS (Institut du Développement et des Ressources en Informatique Scientifique) and CINES (Center Informatique National de l'Enseignement Supérieur) computing resources. We are thankful to Chris Yukna for his help on editing this manuscript.
20.6. Bibliography
[BOR 06] BORJA-BAEZA R.-C., ESTEBAN-CHÁVEZ O., MARCOS-LÓPEZ J., PEÑA-GARNICA R.-J., ALCÁNTARA-AYALA I., “Slope instability on pyroclastic deposits: landslide distribution and risk mapping in Zacapoaxtla, Sierra Norte De Puebla, Mexico”,
Journal of Mountain Science, vol. 3 no. 1, 2006, p. 1-19.
[KOU02]KOUSA A., KUKKONEN J., KARPPINEN A., AARNIO P., KOSKENTALOT., “A model for evaluating the population exposure to ambient air pollution in an urban area”, Atmospheric Environment, vol. 36 no. 13, 2002, p. 2109-2119.
[RIE05]RIESENMEY C., CHEMEL C., BATTON-HUBERT M., CHOLLET J.-P., “Mixed method to assess odor impact using data classification and high-resolution numerical simulations”, Proc. of the 5th Int. Conference on Urban Air Quality, Valencia, Spain,
29-31 March 2005.
[SAR03]SARKAR U., HOBBS S.-E., LONGHURSTP.,“Dispersion of odor: a case study with a municipal solid waste landfill site in North London, United Kingdom”, Journal of
Environmental Management, vol. 68 no. 2, 2003, p. 153-160.
[XUE00]XUE M., DROEGEMEIER K.-K., WONGV., “The Advanced Regional Prediction System (ARPS) – A multi-scale non hydrostatic atmospheric simulation and prediction model. Part I: Model dynamics and verification”, Meteorology and Atmospheric Physics, vol. 75 no. 3-4, 2000, p. 161-193.