The Diffusion of Alternative Fuel Vehicles: A
Generalised Model and Future Research Agenda
The MIT Faculty has made this article openly available. Please sharehow this access benefits you. Your story matters.
Citation Keith, David R. et al. "The Diffusion of Alternative Fuel Vehicles: A Generalised Model and Future Research Agenda." Journal of Simulation 14, 4 (January 2020): 260-277 © 2020 Operational Research Society
As Published http://dx.doi.org/10.1080/17477778.2019.1708219
Publisher Informa UK Limited
Version Author's final manuscript
Citable link https://hdl.handle.net/1721.1/130155
Terms of Use Creative Commons Attribution-Noncommercial-Share Alike
The Diffusion of Alternative Fuel Vehicles: A
Generalized Model and Future Research Agenda
David R. Keith
Sloan School of Management, Massachusetts Institute of Technology, Jeroen J.R. Struben
Emlyon Business School Sergey Naumov
Sloan School of Management, Massachusetts Institute of Technology
Abstract
Alternative fuel vehicles (AFVs) powered by fuels such as electricity, hydrogen, and biofuels promise to reduce the significant environmental impacts of automotive transportation, including urban air pollution and greenhouse gas emissions. However, multiple barriers to AFV diffusion exist, including low consumer acceptance, high vehicle costs, and a lack of refueling infrastructure, meaning that sophisticated policies will be needed to achieve a successful AFV market transition. In this article we present a generalized model of AFV diffusion that is flexible for the exploration of critical policy questions, building on recent AFV diffusion literature from system dynamics and related fields. We demonstrate using illustrative scenarios the fragility of AFV diffusion, with a range of behavior modes possible depending on the structure of the market and the actions of stakeholders. Finally, we identify a number of contemporary research topics of interest to automotive manufacturers and policymakers that can be addressed using the model.
Keywords: alternative fuel vehicles; electric vehicles; system dynamics; innovation
Introduction
The decarbonization of transportation in the 2050 timeframe is an increasing urgent policy objective globally as governments seek to mitigate the worst potential impacts of
anthropogenic climate change. Transportation is now the leading sectoral contributor of greenhouse gas (GHG) emissions in the United States (EPA, 2018) and many other countries, resulting from the combustion of carbon-based fuels including gasoline and diesel. In addition to GHG emissions, the combustion of gasoline and diesel also produces pollutants including volatile organic compounds, sulfur dioxide and nitrogen oxides, that cause smog, responsible for an estimated 53,000 deaths per year in the United States (Caiazzo, Ashok, Waitz, Yim, & Barrett, 2013), significantly more than the number of people killed in car crashes. At the same time, demand for automobiles is growing rapidly in the developing world, with the global light duty vehicle fleet predicted to double to 2 billion by 2050 (IEA, 2017). A rapid transition to low-carbon vehicle fuels is thus essential if global environmental goals are to be achieved.
While the scale of this challenge is daunting, many possible solutions exist. Automobile manufacturers have developed alternative fuel vehicles (AFVs) capable of running on fuels including electricity, biofuels, natural gas, and hydrogen, reducing
emissions by using low-carbon fuels and/or improving vehicle energy efficiency. In recent years, the electric vehicle (EV) pathway has become particularly promising, with an
increasing number of EV makes and models available to consumers. 2018 was the best year yet for EV sales globally with more than 2M EVs sold (Figure 1), more than half of which occurred in China, resulting from aggressive government intervention to build an EV market (e.g. effectively banning the purchase of a conventional gasoline vehicle in several cities). With global EV adoption growing exponentially, it is not surprising that an
increasing number of people believe that the transition to sustainable mobility is a foregone conclusion.
Figure 1. Global Electric Vehicle Sales
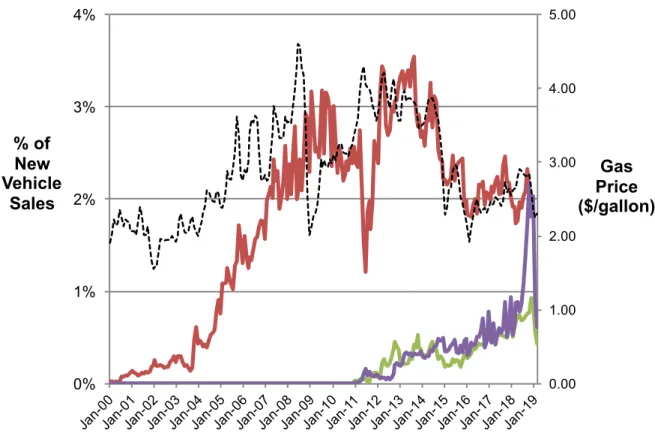
However, there is reason to be cautious about whether the global EV market has yet reached a level that is sustaining absent strong government policy support. The history of alternatives to gasoline-powered internal combustion vehicles is one of “sizzle and fizzle”—an initial burst of enthusiasm and effort often followed by decline and failure as the alternatives fail to gain a sustainable share of the market once policy support is removed. For example, initially promising programs to introduce natural gas vehicles stagnated in Italy and withered in Canada and New Zealand after initial subsidies ended (Flynn, 2002; Yeh, 2007). Closer examination of hybrid and electric vehicle sales in the United States (Figure 2) shows patterns of diffusion that differ from the canonical S-shaped diffusion curve, conditioned by factors including gas prices and government incentives, with AFVs never capturing more than 5% of new vehicle sales. Sales of hybrid-electric vehicles (HEVs) grew steadily through the mid-2000s, but then plateaued, and have trended downward in the past 5 years as the price of gasoline has declined. Sales of plug-in hybrid electric vehicles (PHEVs) and battery electric vehicles (BEVs) have grown steadily since
2010, enjoying strong policy support including a federal $7,500 incentive for EV adoption, further financial incentives in many states, and the Zero Emissions Vehicle (ZEV) mandate that requires automakers to sell increasing numbers of zero-emission electric or hydrogen vehicles in California and the Northeast states. While BEV sales showed an encouraging spike in late 2018 with the launch of Tesla’s Model 3 sedan, that success appears to be short-lived, with BEV sales falling back below 1% in 2019, bringing the future of the US EV market back into question.
Figure 2. Sales of Hybrid and Electric Vehicles in the United States
A common explanation for previous failed efforts to introduce AFVs is that key technologies such as lithium-ion batteries and hydrogen fuel cells are not sufficiently mature, and their costs too high (e.g. Flynn, 2002; Robertson & Beard, 2004; Romm, 2004;
0.00 1.00 2.00 3.00 4.00 5.00 0% 1% 2% 3% 4% Gas Price ($/gallon) % of New Vehicle Sales
Offer, Howey, Contestabile, Clague, & Brandon, 2010). Others have pointed to the lack of ubiquitous refueling infrastructure needed to make AFVs a viable choice (Yeh, 2007; P. E. Meyer & Winebrake, 2009) or a lack of consumer awareness (Sperling & Gordon, 2010). While both arguments have considerable merit, more subtly, the low functionality and high cost of AFVs are endogenous consequences of the dominant gasoline/ICE regime. The diffusion of AFVs is governed by multiple strong and reinforcing feedbacks, including word-of-mouth that conditions consumer acceptance, learning-by-doing in manufacturing, and the co-evolution of refueling infrastructure. The gasoline/ICE regime that has
developed over the past century already enjoys the benefits of well-educated buyers,
efficient low-cost engine technologies, a wide range of vehicle makes and models available, and a ubiquitous network of gas stations, all of which serve to maintain the dominance of gasoline/ICE and suppress consumer adoption of AFVs. Understanding how markets for AFVs form that are sustainable in both environmental and economic terms given these diffusion dynamics is an ongoing challenge for firms and policymakers.
Computational models have been under development for many years to understand aspects of these complex diffusion dynamics and the plausibility of a mass-market AFV transition (Metcalf, 2001; Cahill, 2002). Struben & Sterman (2008) formalized the concept of consumers’ willingness-to-consider an AFV as a stock that accumulates with social exposure from advertising and word-of-mouth, consistent with the marketing literature on consideration sets (Hauser, Urban, & Weinberg, 1993). Conventional choice theory assumes that consumers have full information and select the option that maximizes utility (McFadden, 1981; Ben-Akiva & Lerman, 1985), implying that low uptake of AFVs is due to a shortfall in product utility relative to conventional vehicles. However, vehicles are expensive and durable, and in reality consumers will only purchase an AFV when they have developed the knowledge and confidence needed to include that vehicle in their consideration set. Therefore, modeling the build-up of consideration independent of
adoption and integrating consideration into the logit model of discrete consumer choice was a major advance, allowing market shares to be estimated as a function of the relative utility of each available platform. This approach has been applied in several empirical settings, including the diffusion of diesel vehicles in Europe (Q. Zhang, 2008), the diffusion of EVs
in the UK (Shepherd, Bonsall, & Harrison, 2012), the role of supply constraints and waitlists in the diffusion of HEVs (Keith, Sterman, & Struben, 2017) and the spatial diffusion of HEVs (Keith, Struben, & Sterman, 2015).
Leaver, Gillingham, & Leaver (2009) place greater attention on production capacity in the upstream energy supply chain, exploring the potential to introduce hydrogen vehicles in New Zealand. This approach has since been extended to explore sustainable
transportation pathways in Iceland, another island nation with substantial renewable energy resources (Shafiei, Davidsdottir, Leaver, Stefansson, & Asgeirsson, 2014, 2015; Shafiei et al., 2016). A number of studies have focused on the issue of refueling infrastructure coevolution, and the need for spatial and temporal coordination of infrastructure
deployment with vehicle sales to support sustained consumer adoption of AFVs (Janssen, Lienin, Gassmann, & Wokaun, 2006; Struben, 2006a, 2006b; Supple, 2007; P. E. Meyer & Winebrake, 2009). Finally, Struben (2006a) and Keith (2012) consider competition
between multiple distinct AFV platforms, each differing in the degree to which they are constrained by the various chicken and egg problems, and subject to cross-platform spillovers, exploring the conditions under which the presence of multiple competing AFV platforms helps or hinders their collective cause. The management flight simulator
developed by Keith, Naumov, & Sterman (2017) further explores these dynamics, allowing users to experiment interactively with policies and strategies intended to accelerate the process of AFV market formation. A complementary literature exists using agent-based (AB) and hybrid SD-AB models to simulate AFV diffusion. For example, T. Zhang, Gensler, & Garcia (2011) emphasize agent heterogeneity, parameterizing an agent-based model of AFV diffusion using the results of a choice-based conjoint experiment, exploring the interactions between four types of agents: manufacturers, consumers, vehicle types, and the government. Eppstein, Grover, Marshall, & Rizzo (2011) model spatial interactions explicitly, simulating the influence of factors such as home location, action radius, and social network structure on consumer adoption of plug-in hybrid electric vehicles (PHEVs). For further reviews of related agent-based literature see Al-Alawi & Bradley (2013) and Shafiei, Stefansson, Asgeirsson, Davidsdottir, & Raberto (2013).
While significant progress has been made towards understanding these complex diffusion dynamics, the promise of a widespread AFV transition that delivers sustainable automotive transportation remains largely unfulfilled, with substantially more work required to determine the specific policies and strategies that should be pursued to
accelerate AFV diffusion globally. Our aims in this paper are first to develop, present, and make available a generalized model of AFV diffusion that brings together developments in the literature over the last several years. Second, we encourage continued research that builds on this model, identifying a number of high-impact research opportunities that address emerging issues in the field. We begin by introducing the structure of the model, focusing on the most interesting and important formulations in each sub-model, providing the fully documented model in an online compendium. We emphasize a broad model boundary, in which consumer choice between multiple competing vehicle platforms is influenced by: (i) the endogenous accumulation of consumer consideration, (ii)
technological change as a result of learning-by-doing and R&D investment by automakers, and (iii) the co-evolution of refueling infrastructure with fuel demand. Next, we
demonstrate the key behavior modes of the model, simulating scenarios that vary in the number and type of vehicle platforms competing in the market. Finally, we describe a range of opportunities where the model could be used to address important policy and strategy questions regarding AFV transitions, reflecting recent industry developments.
Model Structure
The model represents an automotive market in which multiple vehicle platforms (powertrain technologies) compete for new vehicle sales. The on-road vehicle fleet
increases with new vehicle sales, and decreases with vehicle retirements due to crashes and aging (Figure 3). The composition of new vehicle sales reflects consumers’ choices about which platform to purchase based on the utility of each platform, and the willingness of consumers to consider that platform in their purchase decision. Consumers’ willingness-to-consider each vehicle platform accumulates social exposure to the platform from
appeal of the vehicle (consolidating influence from attributes such as vehicle purchase price, operating cost, and acceleration) and the extrinsic convenience of driving that vehicle, conditioned by the availability of refueling infrastructure. These factors evolve as endogenous consequences of the mix of vehicle platforms being purchased by consumers, in the presence of learning-by-doing and R&D investment by producers, allowing producer capabilities to accumulate (R2), and of infrastructure expansion by providers (R3).
Figure 3. Model Overview
The model is behaviorally robust and incorporates established formulations from related fields including innovation diffusion (e.g. Bass, 1969; Norton & Bass, 1987;
Mahajan, Muller, & Wind, 2000), discrete consumer choice (e.g. McFadden, 1981a; Ben-Akiva & Lerman, 1985; Brownstone, Bunch, & Train, 2000), behavioral decision-making (Simon, 1959; Cyert & March, 1963; Morecroft, 1985; Sterman, 1989), and technological change (e.g. Argote & Epple, 1990).
Consumer Choice
Consumers have a choice between multiple technology platforms when purchasing a new vehicle, including gasoline (petrol) or diesel, hybrid, natural gas, and plug-in electric vehicles, in addition to choices about body styles, makes, and models. In general, consumers choose the vehicle from the available options that has the highest perceived utility given their preferences for the attributes of those options.
We formulate choice at the population level (e.g. a country or a region), based on the perception that buyers currently owning each platform 𝑖 hold for each new platform 𝑗. We model consumer choice as being conditioned by both the utility of platform 𝑗, 𝑢!, and consumers’ willingness-to-consider that product, 𝐶"!. Consideration 𝐶"! captures the extent to which drivers of platform 𝑖 are sufficiently familiar with platform 𝑗 that they include that alternative in their consideration set, the subset of alternatives that they evaluate in detail to purchase from (Hauser & Wernerfelt, 1990). Following Struben & Sterman (2008), we model the market share of each platform 𝑗 for drivers of platform 𝑖, 𝜎"!, by combining these
two terms multiplicatively in a logit probability structure: 𝜎!"=
𝐶!"𝑒#!
∑ 𝐶" !"𝑒#!
(1) When full consideration is assumed (𝐶"! = 1, ∀𝑖, 𝑗), Eq. (1) reduces to the classic
multinomial logit model (McFadden, 1981). The logit model is flexible to an arbitrary number of choices, and can be readily adapted to represent more complex decision processes. For example, a nested multinomial logit model (NMNL) could be used to represent a multi-stage decision process where related alternatives are available, such as plug-in hybrid vehicles and battery-electric vehicles, which can be thought of a subset of the full range of available options (Train, 2009).
We quantify consideration as the fraction of the population that is willing to include the new product in their consideration set. Because conventional gasoline vehicles are a mature and dominant platform with close to 100% market share in most countries, we assume all consumers give gasoline vehicles full consideration (𝐶",$%& = 1, ∀𝑖). In the other
extreme, an entirely new platform has zero market share initially, regardless of the utility of that platform, because consideration is zero initially.
The utility of platform 𝑗 is calculated as a linear function of the population-level preferences that consumers hold for each attribute 𝑎 of platform 𝑗, 𝜒!,', and the cost of refueling vehicles of platform 𝑗, 𝑓!:
𝑢"= ' 𝛽$𝜒"$ $
+ 𝛽%𝑓" (2)
where 𝛽' and 𝛽( measure the consumer elasticity of demand for vehicle attributes and refueling cost respectively. These preferences (weights) can be estimated empirically, or assumed from the existing discrete choice literature (Brownstone et al., 2000; Berry, Levinsohn, & Pakes, 2004; Santini & Vyas, 2005).
Our formulation of consumer choice, integrating utility and consideration, is consistent with discrete choice theory which derives the logit probability structure for market level adoption share of an alternative choice option (Eq. (1) and (2)) from first principles. Under the assumption that an unobserved portion of the utility ε is iid extreme value distributed across individuals, with 𝑢) = 𝑢 + 𝜀), for individual h, consumers
collectively produce the market share 𝜎 = 𝑒*/(𝑒* + 1) (McFadden, 1981). Implicitly,
these studies assume that consumers are fully informed and are always willing to consider the alternative in their purchase decision (i.e. 𝐶"! is constant and equal to 1), thus 𝑎 = 𝑒*
(omitting indices). However, affinity 𝑎 = 𝐶𝑒* can be restated as 𝑎 = 𝑒*&. Then, with 𝑢’ =
𝑢 + 𝑙𝑛(𝐶), the discrete choice structure properties are maintained for 𝐶 ≥ 0. Consumer Consideration
Automobiles are expensive and durable products, with multiple attributes. Automobile ownership also transcends the use value of the vehicle, signaling the owner’s
socioeconomic status, style, and values (Hård & Knie, 2001; Miller, 2001). Thus, automobile choice is strongly shaped by cultural norms, personal experience, and social interactions (Kay, 1997). Consumers will only consider purchasing an AFV over a conventional gasoline vehicle when they are sufficiently familiar with that AFV platform that they are willing to include it in their consideration set (Hauser et al., 1993). Achieving this consideration requires consumers to learn about AFVs through social interactions such as seeing commercials about AFVs on television, discussions with friends who have purchased an AFV previously, and observing AFVs in use.
We represent the accumulated effects of social influence as a stock of consideration for each vehicle platform, capturing the “…cognitive and emotional process through which drivers gain enough information about, understanding of, and emotional attachment to a platform for it to enter their consideration set” (Struben & Sterman, 2008). Consumer willingness-to-consider platform 𝑗 among drivers of platform 𝑖 increases with social exposure to platform 𝑗, and erodes through forgetting:
𝑑𝐶!"
𝑑𝑡 = 𝑧"/1 − 𝐶!"2 − 𝜙𝐶!" (3) where 𝑧! is the aggregate effect of social exposure, and 𝜙 is the fractional rate of forgetting. Social exposure to platform 𝑗 is the sum of the socialization effect of marketing, 𝑧!+, and
the socialization effect of word-of-mouth from drivers of platform 𝑗, 𝑧!,. Word-of-mouth is
a strong reinforcing feedback in the diffusion of successful innovations: as the vehicle fleet of platform 𝑗 grows, more opportunities exist for prospective buyers to learn about the platform from existing adopters and observe the platform in use, building consideration and leading to further adoption.
When consumers adopt a new platform, they take their willingness-to-consider each platform with them. To assure the ‘conservation of consideration’ at the population level, the model also contains a consideration co-flow, tracking how consumers remember their willingness-to-consider each platform when they switch to ownership of a new platform.
Fleet Turnover
Modern automobiles are highly durable with an average life span of approximately 15 years (Keith, Houston, & Naumov, 2019), meaning that only a small fraction of the more than 1 billion vehicles on roads globally are retired each year due to aging and car crashes. The slow rate of fleet replacement constrains swift market transitions, limits the rate of new vehicle sales, and in turn slows the rate at which AFV platforms can accumulate consumer willingness-to-consider, production experience, and refueling infrastructure.
We represent the installed base of adopters of platform 𝑗, 𝐴!, as a standard multiple-vintage cohort model (Sterman, 2000), with multiple-vintage-specific hazard rates of discard and replacement purchase for each vintage 𝑣, 𝑟-. The total installed base of platform 𝑗 sums over the individual vintages, 𝐴! = ∑ 𝐴- -!. Generally, 𝑟- increases with the age of the
cohort. While a fully specified fleet model might use one-year age cohorts (NHTSA, 2006), this level of detail is not necessary to understand the fundamental fleet turnover dynamics. However, the simplest possible representation of the fleet as a single stock lacks sufficient detail, failing to adequately capture the durability of new vehicles, which almost always remain in the fleet for several years except when they are involved in crashes. In the model presented here we use four age cohorts, balancing behavioral realism and model
complexity.
The model is flexible to varying assumptions about the rate of growth of the vehicle fleet and survivability of new vehicles, which have important implications for the
composition of the vehicle fleet. In developed countries the size of vehicle fleets are relatively stable. Therefore, the rate of new vehicle sales is given by the rate at which vehicles are retired from the fleet. However, demand for automobiles is growing strongly in many countries including in China and India, driven by population growth and increasing affluence. In such regions, growth in total demand for vehicles may be an important influence on AFV diffusion.
Manufacturer Capabilities
The utility of new technologies, defined as performance relative to cost, commonly improves over time with cumulative adoption, resulting from firms’ learning-by-doing in production, and investment in research and development (R&D). Technological change is a particularly important consideration in the diffusion of AFVs, because low performance and high cost of emerging technologies are widely identified as key barriers to consumer adoption of AFVs.
We model technological change at the vehicle subsystem level, capturing the effects of learning-by-doing and R&D investment as reductions in the unit subsystem cost over time, using a single power-law learning curve (Argote & Epple, 1990) cumulative in production experience. The performance of vehicle subsystem ℎ in platform 𝑗, 𝑃!), is
therefore given by:
𝑃"' = 𝑃"'(5
𝐸"'
𝐸"'(7 )"
(4) where 𝐸!) is the current level of production experience with subsystem ℎ in platform 𝑗, 𝐸!).
is the reference level of experience with subsystem ℎ in platform 𝑗, 𝑃!). is the price of
subsystem ℎ at the reference level of experience, and 𝛾/ is the strength of the learning curve for production experience. As is common in studies of producer learning, cumulative production is used as a proxy for the aggregate effect of all sources of learning, while performance – aggregating the effect across multiple attributes - is measured in the single dimension of cost (Argote & Epple, 1990).
The total cost of platform 𝑗 is the sum of the costs of the vehicle subsystems of platform 𝑗. Because we model technological change at the subsystem level, changes in the cost of subsystems may influence other platforms that use those same subsystems, although to potentially differing extents. For example, reductions in the unit cost of lithium-ion batteries will benefit hybrid and electric vehicle platforms differentially, varying with the size of the battery pack in each vehicle, assuming the full appropriation of learning spillovers across platforms. The rate at which production experience accumulates is the
sum of direct production experience with platform 𝑗, and spillovers of production
experience from all other platforms 𝑘 that employ the same or similar vehicle subsystem: 𝑑𝐸"'
𝑑𝑡 = 8𝑠"+ ' 𝑣"*'∗ 𝑠* *+"
< (5)
where 𝑣!0) is the extent of producer experience spillovers that occur from platform 𝑘 to
platform 𝑗 in subsystem ℎ. The extent of spillovers is governed by factors such as industry structure, collaboration, technology complexity, practices regarding intellectual property protection, and employee mobility. Then, 𝑣!0) [0,1], where 𝑣!0) = 0 implies that subsystem ℎ is proprietary to the platform and perfectly appropriable, preventing any spillovers. In the other extreme, 𝑣!0) = 1 implies that subsystem ℎ is common across
multiple platforms, or that platforms can effectively learn about improvements achieved in other platforms, enabling full learning spillovers.
Refueling Infrastructure
Refueling infrastructure is a critical determinant in the success or failure of AFVs. Without ready access to a ubiquitous refueling infrastructure, the cost of searching for fuel and the resulting effective vehicle range is prohibitive, and consumers will choose not to purchase that AFV platform. However, the problem is similar from the perspective of fuel providers: without sufficient demand for fuel from a significant fleet of AFVs, the construction of compatible refueling infrastructure is not profitable, and that infrastructure does not get built. The stocks of refueling infrastructure and vehicles therefore co-evolve in a powerful reinforcing feedback that can facilitate AFV diffusion when operating virtuously, but stifle AFV diffusion when operating in reverse. We model the refueling infrastructure using a standard stock management structure (Sterman, 2000). The rate of new station construction reflects fuel providers’ perception of the profitability being earned from the network of refueling stations that exists currently (Figure 4). Significant time delays exist in the construction of infrastructure, including the time to perceive the level of infrastructure demand, an information delay, and the time required to plan, permit, and construct new infrastructure, a material delay.
Figure 4. Refueling Infrastructure Co-evolution
Driver Refueling Behavior
The availability of refueling infrastructure influences the attractiveness of AFV platforms for prospective buyers, and the driving habits of AFV owners, in multiple ways. First, as the number of refueling stations increases, the average distance to a refueling station decreases, reducing the time and vehicle range required to obtain fuel. This in turn makes vehicle usage more appealing, increasing fuel demand and fuel station profitability, leading to the further construction of refueling stations (R3, Chicken-egg). However, when limited infrastructure exists, this feedback acts to prevent the vehicle sales that would support infrastructure development. More subtly, the capacity of the available refueling infrastructure relative to the number of vehicles demanding fuel determines the rate of infrastructure utilization, and the probability that a driver must wait at the station to refuel. If insufficient infrastructure exists to satisfy the number of people wanting to refuel, queues will form at stations, eventually suppressing platform appeal (B2, Demand Response).
Drivers manage these costs by maintaining a buffer, a portion of their driving range that they reserve for fuel search that reduces the effective range of the vehicle, because running out of fuel is very costly (e.g. waiting for roadside assistance or towing the vehicle to a refueling station). A larger buffer decreases the risk of running out of fuel before finding a refueling station, increasing the utility of driving that platform (B3, Out of Fuel Risk). However, a larger buffer also reduces the effective range of the vehicle, leading to increased refueling frequency, and increased queuing times, reducing the utility of the platform (R4, Topping Off). Assuming full information, rational drivers would operate with an optimal buffer (in miles) that minimizes their total cost of refueling. We assume that drivers use a heuristic approximation to this optimization, maintaining a larger buffer as the average distance to the nearest refueling station increases.
We capture the effect of infrastructure availability on platform utility for new vehicle buyers by calculating the total per-mile cost of refueling (𝑓! in Eq. (2)):
𝑓! = 𝑓!12'34)+ 𝑓
!5'"6 + 𝑓!123-"42+ 𝑓!77( (6)
comprising the costs of searching for a compatible fueling station I𝑓!12'34)J, waiting in line
to refuel I𝑓!5'"6J, refueling the vehicle I𝑓
!123-"42J, and the risk of running out of fuel
(𝑓!77().
Scenario Analysis
To demonstrate the behavior of the model, we explore scenarios that vary the number and type of platforms competing in the market. The analysis we present is a deliberately stylized portrayal of the US automotive market, with simplified representation of actual vehicle technologies, and holding total vehicle ownership constant, in order to focus attention on the endogenous behavior of the model. In Scenario 1, we introduce the HEV platform, which is compatible with the existing gasoline infrastructure but initially
unfamiliar to consumers. Next, we instead introduce the BEV platform, which can only be recharged using electricity and hence require the development of a new refueling
infrastructure. We consider the diffusion of the BEV platform with minimal infrastructure development in Scenario 2, and a more aggressive infrastructure strategy in Scenario 3. In Scenario 4 we introduce both HEVs and BEVs concurrently, exploring the effect of competition between AFV platforms on their individual and collective prospects. The parameterization of each scenario is summarized in Table 1.
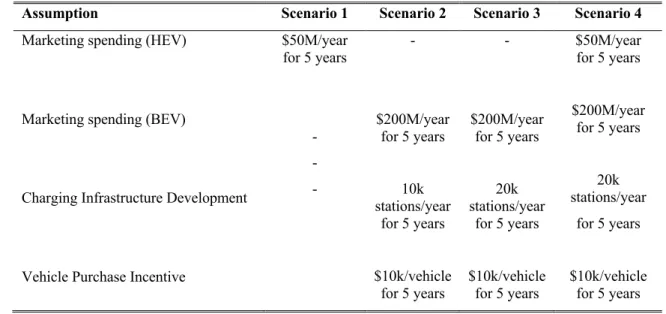
Table 1. Scenario Assumptions
Assumption Scenario 1 Scenario 2 Scenario 3 Scenario 4
Marketing spending (HEV)
Marketing spending (BEV)
Charging Infrastructure Development
Vehicle Purchase Incentive
$50M/year for 5 years - - - - $200M/year for 5 years 10k stations/year for 5 years $10k/vehicle for 5 years - $200M/year for 5 years 20k stations/year for 5 years $10k/vehicle for 5 years $50M/year for 5 years $200M/year for 5 years 20k stations/year for 5 years $10k/vehicle for 5 years
Scenario 1: Base Case
We first consider a case where the sole entrant platform, HEVs, do not require the development of a new refueling infrastructure. The HEV platform has superior fuel economy to the conventional gasoline platform, but the HEV is more expensive due to the additional cost of the hybrid powertrain. We introduce the HEV platform into the market in year five, supported by a targeted advertising campaign for the first five years. Sales of the HEV platform grow logistically over time, eventually making HEV the dominant platform in the fleet by year 30 (Figure 5, (a) and (b)), as a result of two key factors. First, consumer willingness-to-consider HEVs accumulates with increasing sales, because HEV adopters generate new social exposure opportunities to the HEV platform that build consumer
willingness-to-consider, resulting in yet more sales - a reinforcing feedback (Figure 5, (c)). Second, the incremental cost of the hybrid powertrain comes down with cumulative
production as vehicle manufacturers learn how to make hybrid vehicles more cheaply, making the HEV platform relatively cheaper and more attractive to consumers over time. As the fraction of HEVs in the fleet increases, so does the average fuel economy of the vehicle fleet, leading to a reduction in the total quantity of gasoline fuel demanded by drivers. A modest reduction in the number of gas stations occurs over time as a result (Figure 5, (d)), because falling gasoline demand causes declining profitability that pushes some stations out of the market.
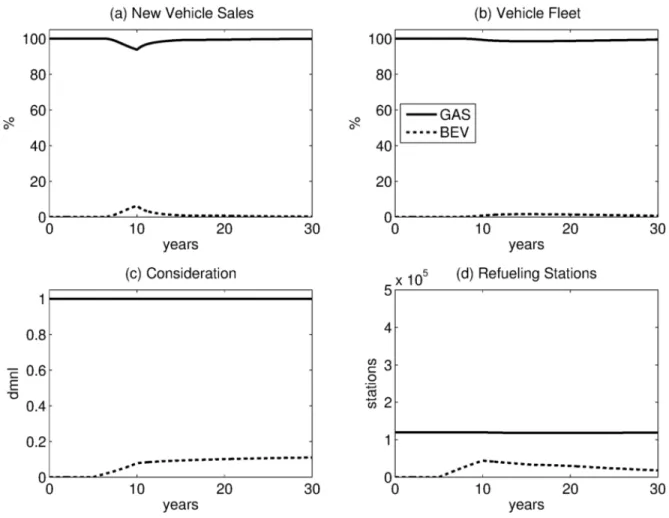
Scenario 2: Infrastructure Coevolution – Sizzle and Fizzle
We next consider a scenario in which the single entrant platform is BEVs, incompatible with the existing gasoline infrastructure. The BEV platform is energy-efficient but has a high initial price, due to the cost of batteries, and requires the development of a new refueling infrastructure (recharging stations). Similar to scenario 1, we introduce the BEV platform in year five, supported by a targeted advertising campaign for the first five years. In addition, we assume that governments introduce two policies to incentivize BEV adoption that are maintained for the first five years following the launch of BEVs: (i) a vehicle purchase incentive is offered to consumers for BEV adoption, to offset the high cost of BEVs, and (ii) a modest infrastructure construction program is undertaken to ensure that some charging stations exist to support early BEV adopters.
In this market, BEV sales grow strongly early on, reaching nearly 10% of new vehicle sales in year 10. However, sales collapse subsequently when government policy support for BEVs is removed, the classic failure mode of behavior that we describe as “sizzle and fizzle” (Figure 6(a)). In years 5-10, BEVs grow with increasing consumer consideration and falling BEV cost, as in Scenario 1. However, the market is fragile, because recharging of BEVs remains costly, and recharging stations are, on average, underutilized and not profitable. When the government policies are removed in year 10, the availability of recharging stations falls, because the government stops introducing new recharging stations, and existing unprofitable stations are not replaced at the end of their useful life. Falling infrastructure availability makes the adoption of BEVs less attractive, exacerbating the removal of government purchase incentives for BEVs, and resulting in even less demand for recharging, a vicious reinforcing feedback. New sales of BEVs collapse, and the BEV platform exits the market, leaving behind billions of dollars spent on infrastructure development and vehicle incentives.
Figure 6. Simulation Results – Scenario 2
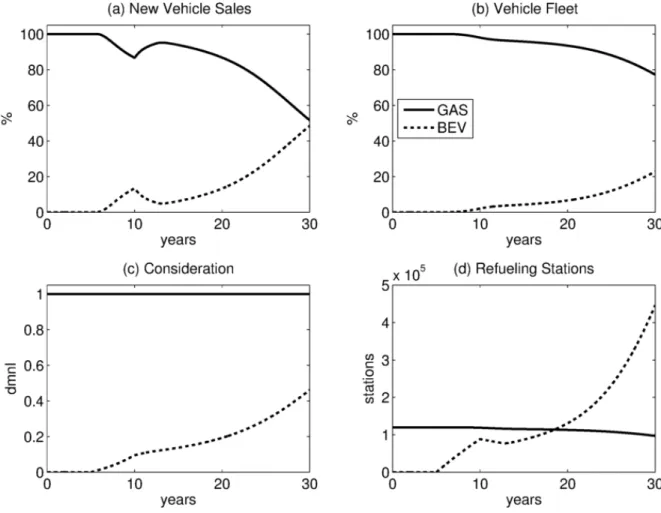
Scenario 3: Infrastructure Coevolution - Breakthrough
In response to the failure of the BEV market in Scenario 2, we now consider whether more aggressive development of recharging infrastructure can overcome the tipping point needed to creating a sustaining market for BEVs. Here the market is identical to Scenario 2, except that we build more refueling stations during the first five years following the introduction of the BEV platform, reducing the refueling costs of BEV drivers (searching for a
recharging station and waiting to recharge) and increasing the utility of the BEV platform for prospective buyers. In this scenario, sales of the BEV platform grow even more strongly than in Scenario 2 between years 5 and 10, building a larger stock of BEVs in the vehicle fleet (Figure 7(a) and (b)). When the government policies are removed in year 10, sales
drop sharply as in Scenario 2, but now recover in approximately year 13, returning to a pattern of logistic sales growth and overtaking gasoline vehicles in new vehicle sales by year 30. As in Scenario 2, recharging stations are not yet profitable in year 10 when the infrastructure development program ends, and the number of available recharging stations initially begins to fall. However, at this point, greater demand for charging exists compared with Scenario 2 with more BEVs on the road, and the exit of some unprofitable recharging stations results in the remaining stations becoming profitable in year 15. While the market share of BEVs falls between years 10 and 15, the installed base of vehicles continues to grow, and the resulting growth in demand for recharging now triggers the construction of new recharging stations after year 15 (Figure 7(d)), which in turn make BEV adoption more attractive, leading to growth in BEV sales, a virtuous reinforcing feedback. The number of recharging stations needed to support the fleet of BEVs is significantly greater than the number of gas stations needed to refuel conventional gasoline vehicles due to the slower refueling time for BEVs. The same feedback that led to the collapse of the BEV market in Scenario 2 now drives the breakthrough of BEVs, supported by a profitable recharging infrastructure market.
Figure 7. Simulation Results – Scenario 3
Scenario 4: Multiple Competing Platforms
Finally, we consider a scenario in which two distinct AFV platforms enter the market in year five: the HEV platform from scenario 1, and the BEV platform from scenario 3. We preserve all assumptions from those two scenarios here, including the more aggressive recharging infrastructure development program. However, whereas a successful market for BEVs forms in Scenario 3, we now see the stagnation of the BEV platform in Scenario 4 (Figure 8(a) and (b)), in the presence of increased competition from the HEV platform. As in Scenario 3, the recharging infrastructure market is able to reach profitability in year 15, with increasing recharging demand and falling recharging supply increasing the utilization of recharging infrastructure. However, growing consumer consideration of HEVs leads to
growth in HEV sales at the same time (Figure 8(c) and (d)), and the BEV platform is now unable to return to the pattern of sales growth observed in Scenario 3. Further, many of the technological improvements accruing the BEV platform, such as power electronics and unit battery costs electric controls, electric system for drive convenience, also benefit the HEV platform (but conventional gasoline vehicles much less so). These spillovers suppress the relative utility of BEVs, becoming relatively less competitive than they otherwise would have been. Comparing scenarios 3 and 4, the introduction of the HEV platform creates sufficient competition for new vehicle sales to stifle the emergence of the BEV platform, which allows the HEV platform to eventually dominate the market as in Scenario 1.
Comparison of Environmental Impacts
The model facilitates the comparison of energy and environmental impacts under different market scenarios. To illustrate, we compare the impact of the four scenarios shown here in terms of fleet-average fuel economy and greenhouse gas emissions (GHGs), using simple assumptions including constant fuel economy by platform, and GHG emissions factors from the United States, including conventional electricity sourced from the US grid mix of generation sources. While the greatest transition away from conventional gasoline vehicles occurs in Scenario 4, the average fuel economy (FE) of the fleet eventually grows highest in Scenario 3, due to the high energy-efficiency of BEVs (Figure 9). The increase in fleet-average fuel economy in Scenarios 1, 3 and 4 takes decades to be realized, despite AFVs comprising a significant fraction of new vehicle sales, because high vehicle durability limits the rate of fleet turnover (Figure 5, Figure 7, and Figure 8). Turning to greenhouse gas (GHG) emissions (Figure 10), we observe that the higher fuel economy in Scenario 4 does not necessarily translate to the greatest reduction in GHG emissions, depending on the generation source of electricity used to charge the BEV fleet. Currently, grid electricity in the US is sourced mostly from fossil fuel generation, having a higher carbon content than gasoline on a ‘gallon of gasoline equivalent’ basis. Taking the higher efficiency of BEVs into account, BEVs charged with grid electricity and HEVs have nearly identical GHG emissions per mile. If the BEV fleet is charged with grid electricity, the greatest reduction in fleet GHG emissions is achieved with the diffusion of HEVs in Scenario 1, due to the greater transition away from gasoline vehicles, substantially outperforming the emissions reduction achieved deploying BEVs in Scenario 3. Only when BEVs are charged with electricity sourced from zero-carbon renewable generation sources such as solar and wind are the full benefits of the BEV platform realized, leading to significant further reductions in GHG emissions in Scenarios 3 and 4. This result highlights the critical importance of transitioning to low-carbon vehicle fuels as well as AFVs if substantial reductions in automotive GHG emissions are to be achieved.
Figure 9. Fleet-Average Fuel Economy by Scenario
Figure 10. Greenhouse Gas Emissions by Scenario
Discussion
The diffusion of alternative fuel vehicles remains a critical topic of research if a successful transition to sustainable mobility is to be achieved. Demand for automobile travel is
growing globally, and the transition to low-carbon fuels is essential if meaningful
reductions in greenhouse gas emissions are to be achieved. Numerous previous efforts to introduce AFVs have failed, and the trajectory of the latest push to introduce electric vehicles globally remains uncertain, with a substantial drop in oil prices making gasoline vehicles attractive for most buyers. Dynamic models can make a vital contribution to understanding how ecologically and economically sustainable markets for AFVs form, explaining how complex patterns of diffusion are an endogenous consequence of the structure of a system governed by multiple non-linear feedbacks, and allowing for strategy and policy analysis.
The broad boundary model we describe here captures the interactions of consumers, automobile manufacturers, fuel providers, and the environment in a behavioral realistic manner. The model captures several of the most important feedbacks governing AFV diffusion, including the turnover of the vehicle fleet, the accumulation of consumers’ willingness to consider purchasing new vehicle platforms, technological change, and the coevolution of refueling infrastructure with fuel demand. The generalized model is flexible and can readily be extended to address important policy and strategy questions. We propose the following research opportunities, as topics of particular relevance given the current state of the global automotive market:
• Automated and Shared Mobility: The rapid emergence of automated vehicle
technologies that take over some or all of the responsibilities of driving, and on-demand mobility platforms that provide access to automobile usage without ownership, have the potential to fundamentally change how automobiles are used (Fagnant & Kockelman, 2013; Sprei, 2017). Innovations that make driving cheaper and easier may reduce the per-mile impacts of automobile travel (e.g. optimizing eco-driving and platooning with other vehicles in highways), making driving more attractive, and resulting in an
increase in vehicle miles travelled (Brown, Gonder, & Repac, 2014; Wadud,
MacKenzie, & Leiby, 2016). Alternatively, automated vehicles could also enable shared use that increases vehicle utilization and reduces the number of vehicles needed, while making the adoption of EVs with low operating costs more attractive (Fulton, Mason, &
Meroux, 2017; Sprei, 2017). Modeling the diffusion of automated vehicles can inform under what conditions automated vehicles contribute a net reduction in gasoline use and greenhouse gas emissions (Naumov, Keith, & Fine, 2019), and to what extent shared rides are going to be popular among commuters (Naumov & Keith, 2019).
• Diffusion of Related Vehicle Platforms: The majority of government support for AFVs is currently centered on the electric drive pathway, from gasoline-hybrid vehicles to plug-in hybrid and battery-electric vehicles, and hydrogen vehicles that have an electric motor powered by a hydrogen fuel cell. These multiple AFV platforms are in competition with each other and with conventional gasoline vehicles for market share. However, these AFV platforms also share key components and consumer-facing attributes, suggesting that the diffusion of these platforms is mutually dependent, with multiple modes of interaction possible. Understanding the conditions under which hybrid vehicles help versus hinder the transition to electric vehicles, and how the relative attractiveness of plug-in hybrid and battery-electric vehicles changes over time, is critical for understanding the potential for deep cuts in oil consumption and
greenhouse gas emissions.
• Infrastructure Deployment Strategies: While the availability of refueling
infrastructure is known to be a critical enabler of AFV adoption, the business case for infrastructure deployment can be challenging. A near-ubiquitous refueling
infrastructure network is needed to support the first vehicle buyers, meaning that refueling stations are likely to be under-utilized in the early stages of a newly launched AFV platform. These dynamics are particularly important for platforms such as hydrogen fuel-cell vehicles that are fully incompatible with existing gasoline and electricity infrastructure, and for which infrastructure development is costly. Behavioral dynamic modeling can inform how the timing and location of infrastructure deployment influences consumer adoption of AFVs, the subsequent driving patterns of adopters, and the financial return on infrastructure investments, taking consumer behavioral decision-making into account. For example, when the fuel supply is limited it may be rational for drivers to increase their buffer, leading to more frequent refueling and
increased queuing (Figure 4). However, increased queuing may contribute to the perception of scarcity, further increasing pressure to increase the buffer – triggering a downward spiral. Moreover, as drivers perceive low fuel availability, they may be cautious in their driving patterns and refuel close to home, concentrating demand in population-dense hotspots, and making the undersupply of refueling stations in remote locations a self-fulfilling prophecy (Struben, 2006b). Analysis of these issues can therefore benefit from spatiotemporal representations.
• Energy and Environmental Policy Analysis: Stringent energy and environmental policies, such as the Corporate Average Fuel Economy (CAFE) standard and the Zero Emissions Vehicle (ZEV) mandate in the United States, are a major influence on the technology strategies of automotive manufacturers. Often, multiple technological pathways exist that could lead to regulatory compliance, involving increased
deployment of AFVs alongside significant improvements in the efficiency of gasoline internal combustion engines. However, these pathways have distinct implications for firm R&D investments, manufacturing supply chains, and marketing strategies. In addition, the future of these policies themselves is uncertain given shifts in government objectives (Keith et al., 2019). Dynamic modeling can inform the robustness of these pathways for firms under uncertainty about future gas prices, technology costs, and consumer preferences.
Transformation of the automobile system is slow due to the highly durable nature of modern automobiles and the multiple chicken-and-egg feedback involved in shifts towards alternative platforms. Substantial uncertainty is inherent in the decades-long time horizon needed to facilitate any automotive technological transition. As a result, any effort to accurately forecast the future of the market is destined to be wrong (Forrester, 2007). The emphasis of AFV modeling efforts should be to understand the behavior of the market, and design robust strategies and policies that lead to more desirable market outcomes. To this end, efforts that build improved mental models about the dynamics governing AFV diffusion are also important. Coordination between automakers, fuel providers, and
policymakers is essential, with commitment to a shared goal, if sustaining markets for AFVs are to emerge.
References
Al-Alawi, B. M., & Bradley, T. H. (2013). Review of hybrid, plug-in hybrid, and electric vehicle market modeling Studies. Renewable and Sustainable Energy Reviews, 21, 190–203. http://doi.org/10.1016/j.rser.2012.12.048
Argote, L., & Epple, D. (1990). Learning Curves in Manufacturing. Science, 247(4945), 920–924. http://doi.org/10.1126/science.247.4945.920
Bass, F. M. (1969). A New Product Growth for Model Consumer Durables. Management Science, 15(5), 215–227. http://doi.org/10.1287/mnsc.15.5.215
Ben-Akiva, M., & Lerman, S. R. (1985). Discrete Choice Analysis: Theory and Application to Travel Demand. Cambridge: MIT Press.
Berry, S., Levinsohn, J., & Pakes, A. (2004). Differentiated Products Demand Systems from a Combination of Micro and Macro Data: The New Car Market. Journal of Political Economy, 112(1), 68–105. http://doi.org/10.1086/379939
Brown, A., Gonder, J., & Repac, B. (2014). Road Vehicle Automation. (G. Meyer & S. Beiker, Eds.). Cham: Springer International Publishing. http://doi.org/10.1007/978-3-319-05990-7
Brownstone, D., Bunch, D. S., & Train, K. (2000). Joint mixed logit models of stated and revealed preferences for alternative-fuel vehicles. Transportation Research Part B: Methodological, 34(5), 315–338. http://doi.org/10.1016/S0191-2615(99)00031-4 Cahill, E. C. (2002). Strategies for the introduction of advanced fuel/vehicle systems to the
mass market. Massachusetts Institute of Technology. Retrieved from https://dspace.mit.edu/handle/1721.1/29177
Caiazzo, F., Ashok, A., Waitz, I. A., Yim, S. H. L., & Barrett, S. R. H. (2013). Air
pollution and early deaths in the United States. Part I: Quantifying the impact of major sectors in 2005. Atmospheric Environment, 79, 198–208.
http://doi.org/10.1016/j.atmosenv.2013.05.081
Cyert, R. M., & March, J. G. (1963). A behavioral theory of the firm. Prentice-Hall international series in management.
http://doi.org/10.1016/j.mechmachtheory.2018.10.002
EPA. (2018). Fast Facts on Transportation Greenhouse Gas Emissions. Retrieved from https://www.epa.gov/greenvehicles/fast-facts-transportation-greenhouse-gas-emissions Eppstein, M. J., Grover, D. K., Marshall, J. S., & Rizzo, D. M. (2011). An agent-based
model to study market penetration of plug-in hybrid electric vehicles. Energy Policy. http://doi.org/10.1016/j.enpol.2011.04.007
Fagnant, D. J., & Kockelman, K. M. (2013). Preparing a nation for autonomous vehicles. Transportation Research Part A Journal, 77(October), 1–32.
Flynn, P. C. (2002). Commercializing an alternate vehicle fuel: lessons learned from natural gas for vehicles. Energy Policy, 30(7), 613–619.
http://doi.org/10.1016/S0301-4215(01)00122-7
Forrester, J. W. (2007). System dynamics—the next fifty years. System Dynamics Review, 23(2–3), 359–370. http://doi.org/10.1002/sdr.381
Fulton, L., Mason, J., & Meroux, D. (2017). Three Revolutions in Urban Transportation. Retrieved from https://www.itdp.org/3rs-in-urban-transport/
Hård, M., & Knie, A. (2001). The Cultural Dimension of Technology Management: Lessons from the History of the Automobile. Technology Analysis & Strategic Management, 13(1), 91–103. http://doi.org/10.1080/09537320120040464
Hauser, J. R., Urban, G. L., & Weinberg, B. D. (1993). How Consumers Allocate Their Time When Searching for Information. Journal of Marketing Research, 30(4), 452– 466. http://doi.org/10.1177/002224379303000405
Hauser, J. R., & Wernerfelt, B. (1990). An Evaluation Cost Model of Consideration Sets. Journal of Consumer Research, 16(4), 393. http://doi.org/10.1086/209225
IEA. (2017). Energy Technology Perspectives 2017. Retrieved from http://www.iea.org/etp/
Janssen, A., Lienin, S. F., Gassmann, F., & Wokaun, A. (2006). Model aided policy development for the market penetration of natural gas vehicles in Switzerland. Transportation Research Part A: Policy and Practice, 40(4), 316–333.
http://doi.org/10.1016/j.tra.2005.06.006
Kay, J. H. (1997). Asphalt nation: how the automobile took over America, and how we can take it back. New York: Crown Publishers.
Keith, D. R. (2012). Essays on the Dynamics of Alternative Fuel Vehicle Adoption: Insights From the Market for Hybrid-Electric Vehicles in the United States. Massachusetts Institute of Technology. Retrieved from https://dspace.mit.edu/handle/1721.1/79546 Keith, D. R., Houston, S., & Naumov, S. (2019). Vehicle fleet turnover and the future of
fuel economy. Environmental Research Letters, 14(2), 021001. http://doi.org/10.1088/1748-9326/aaf4d2
Keith, D. R., Naumov, S., & Sterman, J. (2017). Driving the Future : A Management Flight Simulator of the US Automobile Market. Simulation & Gaming, 48(6), 735–769. http://doi.org/10.1177/1046878117737807
Keith, D. R., Sterman, J. D., & Struben, J. (2017). Supply constraints and waitlists in new product diffusion. System Dynamics Review. http://doi.org/10.1002/sdr.1588
Keith, D. R., Struben, J., & Sterman, J. D. (2015). Understanding Spatio-temporal Diffusion of New Products: The Toyota Prius Hybrid-Electric Vehicle in the United States.
of a hydrogen economy in New Zealand using UniSyD. International Journal of Hydrogen Energy. http://doi.org/10.1016/j.ijhydene.2009.01.063
Mahajan, V., Muller, E., & Wind, Y. (Eds.). (2000). New-Product Diffusion Models (International Series in Quantitative Marketing). Springer.
McFadden, D. (1981). Econometric Models of Probabilistic Choice. In C. F. Manski & D. L. McFadden (Eds.), Structural Analysis of Discrete Data and Econometric
Applications (pp. 198–272). Cambridge: MIT Press.
Metcalf, S. S. (2001). A system dynamics exploration of future automotive propulsion regimes. Massachusetts Institute of Technology. Retrieved from
https://dspace.mit.edu/handle/1721.1/34716
Meyer, P. E., & Winebrake, J. J. (2009). Modeling technology diffusion of complementary goods: The case of hydrogen vehicles and refueling infrastructure. Technovation, 29(2), 77–91. http://doi.org/10.1016/j.technovation.2008.05.004
Miller, D. (Ed.). (2001). Car cultures (Materializing Culture). Berg Publishers.
Morecroft, J. D. W. (1985). Rationality in the Analysis of Behavioral Simulation Models. Management Science, 31(7), 900–916. http://doi.org/10.1287/mnsc.31.7.900
Naumov, S., & Keith, D. R. (2019). Hailing Rides Using On-Demand Mobility Platforms: What Motivates Consumers to Choose Pooling?
Naumov, S., Keith, D. R., & Fine, C. H. (2019). Unintended Consequences of Automated Vehicles and Pooling for Urban Transportation Systems.
NHTSA. (2006). Vehicle Survivability and Travel Mileage Schedules. National Highway Traffic Safety Administration, (January), 22. http://doi.org/DOT HS 809 952
Norton, J. A., & Bass, F. M. (1987). A Diffusion Theory Model of Adoption and
Substitution for Successive Generations of High-Technology Products. Management Science, 33(9), 1069–1086. http://doi.org/10.1287/mnsc.33.9.1069
Offer, G. J., Howey, D., Contestabile, M., Clague, R., & Brandon, N. P. (2010).
Comparative analysis of battery electric, hydrogen fuel cell and hybrid vehicles in a future sustainable road transport system. Energy Policy, 38(1), 24–29.
http://doi.org/10.1016/j.enpol.2009.08.040
Robertson, B. I., & Beard, L. K. (2004). Lessons Learned in the Deployment of Alternative Fueled Vehicles. In The Hydrogen Energy Transition (pp. 181–190). Elsevier.
http://doi.org/10.1016/B978-012656881-3/50013-7
Romm, J. J. (2004). The hype about hydrogen. In Issues in Science and Technology. http://doi.org/10.1017/CBO9781107415324.004
Santini, D. J., & Vyas, A. D. (2005). Suggestions for a New Vehicle Choice Model Simulating Advanced Vehicles Introduction Decisions (AVID): Structure and Coefficients. Argonne, IL.
Potential impact of transition to a low-carbon transport system in Iceland. Energy Policy, 69, 127–142. http://doi.org/10.1016/j.enpol.2014.03.013
Shafiei, E., Davidsdottir, B., Leaver, J., Stefansson, H., & Asgeirsson, E. I. (2015). Comparative analysis of hydrogen, biofuels and electricity transitional pathways to sustainable transport in a renewable-based energy system. Energy, 83, 614–627. http://doi.org/10.1016/j.energy.2015.02.071
Shafiei, E., Davidsdottir, B., Leaver, J., Stefansson, H., Asgeirsson, E. I., & Keith, D. R. (2016). Analysis of supply-push strategies governing the transition to biofuel vehicles in a market-oriented renewable energy system. Energy.
http://doi.org/10.1016/j.energy.2015.11.013
Shafiei, E., Stefansson, H., Asgeirsson, E. I., Davidsdottir, B., & Raberto, M. (2013). Integrated Agent-based and System Dynamics Modelling for Simulation of Sustainable Mobility. Transport Reviews, 33(1), 44–70.
http://doi.org/10.1080/01441647.2012.745632
Shepherd, S., Bonsall, P., & Harrison, G. (2012). Factors affecting future demand for electric vehicles: A model based study. Transport Policy.
http://doi.org/10.1016/j.tranpol.2011.12.006
Simon, H. A. (1959). Theories of Decision-Making in Economics and Behavioral Science Herbert. The American Economic Review. http://doi.org/10.1257/aer.99.1.i
Sperling, D., & Gordon, D. (2010). Two Billion Cars: Driving Towards Sustainability (First Edit). New York: Oxford University Press.
Sprei, F. (2017). Disrupting mobility. Energy Research & Social Science, (October), 1–5. http://doi.org/10.1016/j.erss.2017.10.029
Sterman, J. D. (1989). Modeling Managerial Behavior: Misperceptions of Feedback in a Dynamic Decision Making Experiment. Management Science, 35(3), 321–339. http://doi.org/10.1287/mnsc.35.3.321
Sterman, J. D. (2000). Business Dynamics: Systems Thinking and Modeling for a Complex World. Boston: Irwin McGraw-Hill. http://doi.org/10.1057/palgrave.jors.2601336 Struben, J. (2006a). Essays on transition challenges for alternative propulsion vehicles and
transportation systems. Massachusetts Institute of Technology. Retrieved from https://dspace.mit.edu/handle/1721.1/37159
Struben, J. (2006b). Identifying Challenges for Sustained Adoption of Alternative Fuel Vehicles and Infrastructure. SSRN Electronic Journal.
http://doi.org/10.2139/ssrn.927012
Struben, J., & Sterman, J. D. (2008). Transition Challenges for Alternative Fuel Vehicle and Transportation Systems. Environment and Planning B: Planning and Design, 35(6), 1070–1097. http://doi.org/10.1068/b33022t
Supple, D. R. (2007). Managing the Transition toward Self-Sustaining Alternative Fuel Vehicle Markets: Policy Analysis Using a Dynamic Behavioral Spatial Model.
Massachusetts Institute of Technology.
Train, K. E. (2009). Discrete choice methods with simulation. Cambridge university press. Retrieved from https://eml.berkeley.edu/books/choice2.html
Wadud, Z., MacKenzie, D., & Leiby, P. (2016). Help or hindrance? The travel, energy and carbon impacts of highly automated vehicles. Transportation Research Part A: Policy and Practice, 86, 1–18. http://doi.org/10.1016/j.tra.2015.12.001
Yeh, S. (2007). An empirical analysis on the adoption of alternative fuel vehicles: The case of natural gas vehicles. Energy Policy, 35(11), 5865–5875.
http://doi.org/10.1016/j.enpol.2007.06.012
Zhang, Q. (2008). Analysis and Calibration of Social Factors in a Consumer Acceptance and Adoption Model for Diffusion of Diesel Vehicle in Europe. Massachusetts Institute of Technology.
Zhang, T., Gensler, S., & Garcia, R. (2011). A Study of the Diffusion of Alternative Fuel Vehicles: An Agent-Based Modeling Approach*. Journal of Product Innovation Management, 28(2), 152–168. http://doi.org/10.1111/j.1540-5885.2011.00789.x