The Assessment of Battery-Ultracapacitor Hybrid
Energy Storage Systems
by
Yiou He
B.E., Tsinghua University, Beijing, China (2012)
Submitted to the Department of Electrical Engineering and Computer Science in partial fulfillment of the requirements for the degree of
Master of Science
MASSACHUSETTS 1WTffTE
at the OFLECHNOLOGY
JUN 3
02014
MASSACHUSETTS INSTITUTE OF TECHNOLOGY
LIBRARIES
June
2014C
Massachusetts Institute of Technology 2014. All rights reserved.Author:
Signature redacted
Department of Electrical Engineering and Computer Science May 21, 2014
Certified
Signature
redacted-by:
John G. Kassakian Professor of Electrical Engineering and Computer Science Thesis Supervisor
Accepted
Signature redacted
by:
/
)
(rofessor Leslie A. Kolodziejski Chair, Department Committee on Graduate ThesesMassachusetts Institute of Technology
The Assessment of Battery-Ultracapacitor Hybrid
Energy Storage Systems
by
Yiou He
Submitted to the Department of Electrical Engineering and Computer Science on May 21, 2014, in partial fulfillment of the requirements for the degree of
Master of Science
ABSTRACT
Battery-ultracapacitors hybrid energy storage systems (ESS) could combine the high power density and high life cycle of ultracapacitors with the high energy density of batteries, which forms a promising energy storage system.
In this thesis, an assessment of the benefits of the hybrid ESS relative to its battery-only counterpart in pulse-load applications is investigated for both Nickel-Metal Hydride (NiMH) batteries and Lithium-ion (Li-ion) batteries, and under different load profiles. Specifically, the hybrid ESS in this assessment is of the simplest type - paralleling the ultracapacitors across the batteries without any power electronics interface between them.
To quantify this assessment, Discharge Capacity(0) is defined as the amount of energy one can draw out of an ESS per unit charge supplied by this ESS. The metric for quantifying the benefits is energy efficiency gain, defined as the percentage increase in the discharge capability of the hybrid ESS over its battery-only counterpart.
The investigation proves that the hybrid system is more beneficial over the battery-only system in terms of how much energy it can output at a specific state-of-charge level. Among the test cases covered by this thesis, the increase in the output energy of Li-ion battery systems by incorporating ultracapacitors can reach to 17% and that of Ni-MH battery systems can reach to 33%.
This thesis also shows that the benefits of paralleling ultracapactors across batteries depended upon the discharge profile of the load, the battery type and the capacitance. The benefits increase quadratically with the pulse amplitude, decreases linearly with the duty cycle and inverse with the pulse period. Moreover, capacitors with higher capacitance and lower ESR yield to larger benefits. And for batteries with a higher ESR, the ultracapacitors will show more benefits than for batteries with low ESR.
Acknowledgement
In retrospect, the past two years at MIT has been a great fortune and an invaluable experience for me. There are many people have helped me, encouraged me and contributed to this thesis, and I could hardly find words to express my gratefulness to them.
First of all, my deepest gratitude is to my advisor, Professor John G. Kassakian, for giving me this opportunity to explore and enjoy the energy and power electronics world. His patience, his immense amount of knowledge, and the way of thinking have given me a precious guidance not only in research, but also in life, and in how to become a better person. I couldn't feel more fortunate and grateful to be his student.
I must extend my thanks to Mr. Otten and Richard Zhang, for giving me so many valuable instructions on circuit design and numerical simulation respectively. They have shared their vast amount of knowledge with me so generously, and have "unstuck" me from problems again and again. This thesis could not be finished without your help.
I would also like to sincerely thank my lab mates in LEES. Thanks to Minjie, Nelson, Juan and Jorge, for listening to my grumble as well as happiness in countless days, and for giving me valuable advice and suggestions. Thanks to Lisa, for accompanying me so many times for lunch and going through the darkness together. Thanks to Wei, Kendall, Seungbum, Alex, John and little John, Youngjin, Mark, Anas, Matt, Wardah, Jimmy Peng and everybody else in 10-061 and 10-050, for bringing sunshine and memorable moments to the basement of the MIT dome. Special thanks to Sam Gunter. Without her super computer, I would have spent weeks to run the simulation and process my data.
In addition, I would like to thank all my dear friends in or outside of MIT. A particular thank to Jiankang, Mie, Sumaiya, Xiaoxue, Nahan and Yihui, for caring me so much, calming me down and teaching me to enjoy research and enjoy life. I greatly value their friendship and deeply appreciate their understanding and patience to me. Thanks to my friends in MIT Energy Club and Ashdown House, for making my two years at MIT a rich and rewarding experience. Thanks to all my friends and mentors back in China who have been so supportive and have my back.
Most importantly, I want to express my deep gratefulness to my parents, my
grandparents and my cousins, for their forever support and love. My study in the US would have been impossible without the love, concern and patience from you. May this thesis serve as a dedication to the values that I learned from you, my families.
Contents
Chapter 1 Introduction ... 8
1 .1 M o tiv atio n ... 8
1.2 Literature Review and Previous Work ... 9
1.3 Statem ent of the Thesis...11
Chapter 2 Background...14
2.1 Characteristics and Applications of Ultracapacitors ... 14
2.2 M odeling of Ultracapacitors ... 16
2.3 M odeling of Batteries...18
Chapter 3 Design of Experiments... 21
3.1 Discharge Capacity ... 21
3.2 Energy Gain and Normalized Energy Gain... 24
3.3 Theoretical Analysis...25
3.4 Design of Experiments...27
3.4.1. Devices for the Experim ents ... 27
3.4.2. Design of Pulse Loads ... 28
Chapter 4 Experim ental Apparatus ... 31
4.1 Design and Im provement of Charging and Discharging Circuit ... 32
4.2 Design of the M easurem ent and Control Circuit ... 37
4.3 Battery Charging Strategy ... 40
4.4 Data processing and M easurement Points... 44
4.5 Sources of Errors...47
4.5.1. Errors in 0 ... 47
4.5.2. Errors of 80...48
Chapter 5 M odeling and Sim ulation ... 49
5.1 M odeling of Ultracapacitor... 49
5.2 M odeling of Lithium Ferro Phosphates (LiFePO4) battery ... 51
5.3 Sim ulation of Li-ion Battery-Ultracapacitor Hybrid System ... 59
Chapter 6 Results...62
6.1 Trend of Discharge Capacity ... 62
6.2 Trend of Norm alized Energy Gain (60) ... 67
Chapter 7 Conclusions and Future W orks ... 73
7.1 M etrics...73
7.2 M ethodology ... 73
7.3 Results ... 74
7.4 Future W orks ... 74
Appendix 1 Theoretical analysis... 76
Appendix 2 Differential equation of the ultracapacitor m odel ... 78
Appendix 3 Differential equation for the hybrid system...80
Appendix g ... 84
Appendix 5 M atlab codes for processing experim ental data ... 109
Appendix 6 M atlab codes for sweeping sim ulation, com pare and plot results ... 116
List of Figures
Fig. 1- 1 Pulse and Constant Current Comparison ... 7
Fig. 1- 2 Charging and discharging circuit (left) and its experiment PCB board (right) [12]...10
Fig. 1- 3 Information of pulse load profile... 11
Fig. 2 - 1 Theory of electrical double layer [16]...13
Fig. 2 - 2 Energy density and power density comparison using Ragone plot...14
Fig. 2 - 3 Equivalent circuit model for EDLC proposed in [30]...16
Fig. 2 - 4 Single pulse charge experiment for EDLC parameter identification ... 17
Fig. 2 - 5 Circuit Model for batteries proposed by [35]...18
Fig. 3- 1 Trajectory on the v - q plane for a pulse load application... 21
Fig. 3- 2 Trajectory of the termial voltage of an ESS vs SoC of the ESS...22
Fig. 3- 3 Discharge Capacity 0 - SoC Trajectory...23
Fig. 3- 4 A simple model of battery-ultracapacitor parallel system ... 24
Fig. 3- S Possible changes of 60 versus different variables...25
Fig. 3- 6 Devices used in the investigation ... 27
Fig. 3- 7 Examples of using the last 10 pulses to calculate 0 and 60...29
Fig. 4 - 1 Block diagram of the experimental apparatus...31
Fig. 4 - 2 The constant current source used in the charging/discharge circuit... 32
Fig. 4 - 3 Circuit diagram of the charging and discharging circuit...33
Fig. 4 - 4 Frequency responses of the constant current source...34
Fig. 4 - 5 Offset adjustment using potentiometer and Op-amp...36
Fig. 4 - 6 CAD layout of the printed circuit board... 37
Fig. 4 - 7 Flow map of the program...38
Fig. 4 -8 Data sampling example -battery current and battery voltage in a hybrid ESS experiment (discharge at a load profile of 8A, pulse period 400ms, duty cycle 10%) ... 38
Fig. 4 - 9 HEX coding of the UART data transfer... 39
Fig. 4 - 10 UART receiver interface...39
Fig. 4 - 11 Charging characteristics of NI-MH and LI-ion batteries...41
Fig. 4 - 12 Verification of different charging test...42
Fig. 4 - 13 Measurement points and conditioning circuits ... 43
Fig. 4 - 14 Experimental apparatus...45
Fig. 5- 1 Four-branch model for the Ultracapacitor ... 49
Fig. 5- 2 Simulation and experimental comparison for the ultracapacitor model...51
Fig. 5- 3 Test steps of parameter extraction experiments for Li-ion batteries ... 52
Fig. 5- 4 The tested SOC-OCV curve of Li-ion batteries used in the investigation...53
Fig. 5- 5 The Li-ion battery model used in the simulation (Four RC-pair) ... 55
Fig. 5- 6 Simulations and experiments comparison using parameters from Table 5-4...56
Fig. 5- 7 Simulations and experiments comparison using parameters from Table 5-4...57
Fig. 5- 9 Simulations and experiments comparison of the hybrid model...59
Fig. 6- 1 Discharge capacity decreases linearly as pulse amplitude increases...63
Fig. 6- 2 Discharge capacity decreases as pulse duty cycle increases ... 64
Fig. 6- 3 Discharge capacity changes not significantly with pulse period ... 65
Fig. 6- 4 Normalized energy gain increases quadratically as the pulse amplitude increases ... 67
Fig. 6-5 Normalized energy gain decreases linearly as the duty cycle increases ... 69
Fig. 6- 6 Normalized energy gain changes mildly with pulse period...70
List of Tables
Table 1- 1 Energy efficiency gain of hybrid ESS over battery-only ESS (period: 400ms) [12]...10
Table 2- 1 Comparison of Specs of different energy storage device [21] [22]...16
Table 2- 2 Comparison of different parameter extraction methods of batteries ... 20
Table 3 - 1 Specifications of devices used in the investigation...28
Table 3 - 2 Pulse load profiles in the hardware experiments...29
Table 4- 1 Device value and part number ... 36
Table 4- 2 Charging Specifications of Batteries ... 41
Table 4- 3 Measurement Points of 8 Channels into ADC... 44
Table 5-1 Parameters of Ultracapacitor model...50
Table 5- 2 Parameter extraction experiments sets for Li-ion batteries ... 53
Table 5- 3 SoC-OCV of the Li-ion battery look-up table...54
Chapter 1 Introduction
1.1 MotivationPulse current or power releases the stored energy in a concentrated short-period pulse or pulses. Numerous processes and applications in industrial production and daily life involve or could be seen as pulse current loads. For example, wireless sensor signals or communication signals of electronics devices often consist of pulses of milliamp and milisecond periods [1]; power tools such as metal cutters, power drills, which usually cut materials or drill a screw in several seconds and rests in between for minutes [2]; an automotive engine starter, which requires an initial high power pulse of hundreds of amperes [3]; fluctuations and faults in electronics systems could also be seen as pulsed loads.
Batteries are known for their high energy density and have been widely used as the main energy source in many pulsed load applications. However unlike running at constant load, when high current pulses are impressed on batteries, the relatively large internal resistance of the batteries will create a voltage drop, which may cause the output voltage unable to hold as required. Moreover, it will generate heat inside the batteries, reduce the available state-of-charge (SoC) window and decrease the life time.
Thus, batteries are usually not capable of running the same time length under pulsed loads, comparing to under the constant load which have the same average current, as shown the run-time comparison in Fig. 1-1 [4]. Considering the high usage rate of batteries in pulse load applications, how to improve their run-time and discharge efficiency has become a critical issue.
10
-Pulsed current Constant currrent
6... .... .... 6 - - - - - 269 1 e 3.5 kJ4.3 kJ at4 1 2 3 4 5
Discharge time (min)
Fig. 1- 1 Pulse and Constant Current Comparison
(Discharging at a 6C constant current and 12C pulsed current of a 20 s period and a 50% duty cycle) [4]
The ultracapacitor, or more descriptively the electrochemical double-layer capacitor (EDLC), is a capacitor having an extremely high capacitance and a very low equivalent series resistance (ESR) comparing with an electrolytic capacitor of similar physical size. It is not a new technology but has advanced rapidly in recent several years, and has been widely exploited to mitigate pulse load applications using batteries [4], [5].
Many investigations of battery-ultracapacitors hybrid systems have focused on combining EDLCs with batteries through a power electronics interface, such as a dc-to-dc converter [6]. The most popular application of ultracapacitors is in the field of hybrid/electric vehicles (HEV/EV) [5], [7]. Other research is being conducted on integrating battery-ultracapacitors hybrid systems into renewable generation systems, mostly solar arrays [8]. With the use of power electronics as the interface, it has been shown that adding an ultracapacitor to batteries (or other energy storage systems) can relieve the stress on the battery by sharing the load current.[6], [8].
1.2 Literature Review and Previous Work
Little research has been done on quantifying the benefits of the simple battery-ultra-capacitor paralleled systems [9], [10], [11].
Reference [9] describes a similar pulse-load application but only through simulation and lacks hardware experiments. Besides, the models of the battery and ultracapacitor were the ideal 'ESR-only' models which can only show a general approximation of actual results.
Reference [10] focused on transient load suppression - the voltage drop due to a transient current load (single pulse). Experiments were run on a 10.8 V Li-Ion laptop battery, which was discharged by low current pulses of 2 A. The voltage drop during discharge pulses decreased from 0.7 V to 0.08 V after adding a 7 F ultracapacitor. The unique point in [10] is that they also conducted the same experiments with tantalum electrolytic capacitors, which shows that the ultracapacitor has great advantages over normal capacitors in terms of suppressing voltage drop, as well as size and volume. The results in [10] are very helpful to explain the theory of how paralleled ultracapacitors benefit the battery, but it lacks a direct explanation of energy efficiency saving and neglects the importance of long-time experiment. In addition, there is no further analysis to correlate benefits with the load characteristics.
Researchers in [11] focused on improving battery lifetime with a hybrid energy storage system, and shared similar goals with this thesis. Both experiments and simulations were
increase could reach 12%. However, the simulation results in their investigation, which are respectively 3.6% and 6%, differ substantially from their experimental results,. This is due to the models of batteries and ultracapacitors in their simulation being Thevenin ESR-only circuit models which provide simplicity but sacrifies accuracy. These models do not take the transient behaviors of batteries and ultracapacitors into consideration. The battery's ESR-only model used in [11] also cannot describe the characteristics of battery's open circuit voltage changing with its state-of-charge in a long-term run.
This thesis will continue investigating based on the previous work done by Ian Smith from 2010 to 2012 [12]. His experiments also consisted of applying a pulsed current load to both hybrid ESS and battery-only ESS and measuring the energy delivered to the load as well as the charge drawn from the batteries. His charging and discharging circuit and experimental board are shown in Fig. 1-2. The experiments were done by paralleling three 25 F ultracapacitors (equivalent 8.33 F) with five 1.5 V Ni-MH batteries in series (equivalent 7.5V), under four different discharging current profiles. Results are listed in Table 1-1. It shows that the hybrid ESS can provide significant efficiency gains over the battery-only ESS, which could be as high as 35% (when the load current is 16 A, 10% duty cycle, 400 ms period).
His experimental results were also used to verify a circuit model for the hybrid ESS, allowing for future testing and design based upon simulation.
Table 1- 1 Energy efficiency gain of hybrid ESS over battery-only ESS (period: 400ms) [12]
Amplitude 8 A 16 A
10% 13% 35%
051V
Fig. 1- 2 Charging and discharging circuit (left) and its experiment PCB board (right) [12] 1.3 Statement of the Thesis
This thesis assesses benefits of battery-ultracapacitor parallel energy storage systems (ESSs) in pulsed load applications. For an electric vehicle, people care most about how long their battery can run from one charge; for a power drill, people care about how many more
screws it could drill before recharging. These all depend on how much energy one could get out of the batteries before depletion.
Thus the main benefit this thesis investigates is dischargeable energy, i.e., how much more energy the hybrid ESSs can draw out of the same capacity batteries comparing to the
battery-only ESSs. This could also be seen as a type of "energy density". By simply
paralleling the EDLCs across batteries, they absorb high frequency and Large peak current, and thus reduce the current as well as the energy loss inside the batteries. In addition, there will also be benefits in terms of cost, volume, temperature and complexity.
This thesis will focus on investigating the benefits in high-current low-frequency pulsed load applications, with pulse amplitudes from 3A to 20A, pulse periods from 50 ms to 400 ms and duty cycles from 5% to 50%. These load profiles can be seen in power tools and power equipment, and if the power and voltage level were extended further, the
The assessment of the benefits covers two different types of rechargeable batteries: the nickel-metal hydride (Ni-MH) battery and the lithium ion (Li-ion) battery (particularly lithium iron phosphate battery, LiFePO4). The former one is of relative high energy density, safe and environment friendly, widely used in telecommunication, wireless communication and automotive industry [13], [14]. The latter one is one type of Li-ion batteries, with longer life time, higher power density and more safety than commonly used LiCo02 batteries [15].
The investigation also covers several other degrees of freedom, including various capacitance values of ultracapacitors, as well as the period, the duty cycle and the amplitude of the pulse loads, as illustrated in Fig. 1-3. Both experiments and simulations were conducted in these several degrees of freedoms.
Results of this thesis reveal how much more energy one could get out of batteries by paralleling ultracapacitors across them, which relates to how much longer the batteries could run. The results also show the trend of the benefits and give a guideline of how to select proper ultracapacitors for a certain load profile to get higher efficiency.
Pulse Number
I.
Pulse Width Pulse Amplitude/Amp
a a Time
Duty Cycle " Pulse Width
Pulse Period/seconds Pulse Period
Fig. 1- 3 Information of pulse load profile
This thesis consists of five chapters. Chapter 2 covers background information and knowledge, including the chemical characteristics of EDLCs, the modeling of Li-ion batteries and ultracapacitors. Chapter 3 presents the design of experiments, including how the metrics of this assessment were defined and how the investigation process was planned. A simple theoretical analysis is also presented to analyze what variables will influence the metrics and how the metrics will change with these variables. Chapter 4 describes the design of the hardware apparatus and hardware experiments. A test rig was designed in order to draw the desired current profiles and measure the critical variables of
the energy storage systems. In Chapter 5, a circuit model for the hybrid ESSs was built and verified by the hardware experiment, and it was further used to simulate more sets of experiments and helped further study the trend of the benefits over different degrees of freedom. Chapter 5 compares and interprets both experimental and simulation results, as well as addresses future work.
Chapter 2 Background
2.1 Characteristics and Applications of Ultracapacitors
The capacitors generally can be classified into three different types: electrostatic capacitors, electrolytic capacitors and electrochemical capacitors. The electrostatic capacitors are simply formed by two metal electrodes with non-conductive dielectric between them. In the electrolytic capacitors, the dielectric is replaced by a much thinner oxide layer coated on one of the metal electrodes, and a conductive soaked paper inserted between the oxide layer and another metal electrode, serving as the electrolyte [16]. At a macroscopic level, both these capacitors can be evaluated using the equation
A
C Oc-d
Where C is the capacitance, A is the surface area of one plate of either positive or negative charges and d is the distance between positive and negative plates.
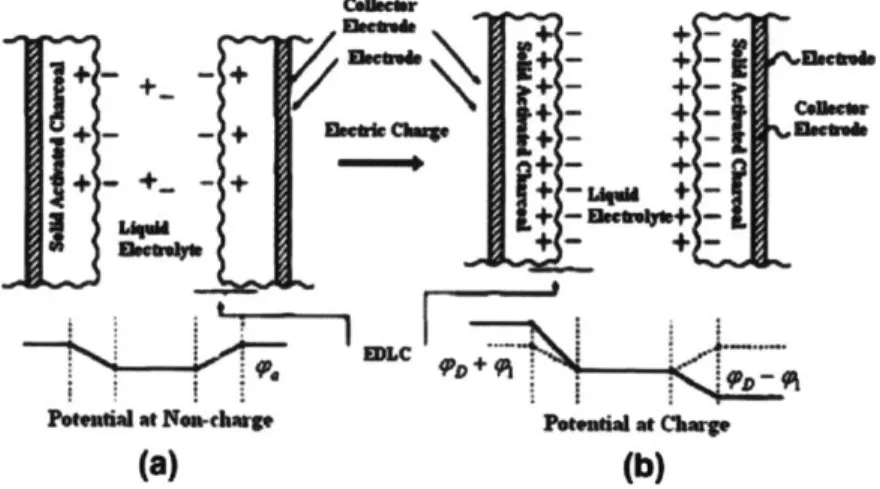
The electrochemical double-layer capacitor (EDLC) is a type of electrochemical capacitors built based on the theory of "electrical double layer effect". The "electrical double layer effect" actually appears at every boundary between two dissimilar materials, which means that there always exists an array of charged particles and dipoles at the interface of two different materials [17] [18]. Specifically if the two materials are electrode and electrolyte, when impressing an electric field across their boundary, the charge accumulates and forms a strong internal electric field, illustrated in Fig. 2-1. This charge and the generated electric field form an equivalent capacitor. As with traditional capacitors, this capacitance is given by (1).
C U -+ Iu + -+ -UPa Nhtmd at Nmwchwp (a)
Fig. 2 -1 Theory of ele
Pots"~a ot CbMp
(b)
ctrical double layer [16] sEwer heoub
(1)
The extremely high capacitance of EDLCs is a result of using porous (active) electrode material such as carbon and metal-oxides. The surface area of these materials is on order of 105 times that of smooth electrodes, which brings the surface area A to the extreme. And the very low ESR comes from the use of a high conductivity electrolyte, such as organic and aqueous [16] [19] [20].
Because the energy stored in a capacitor increases linearly with its capacitance, and the low ESR allows high currents to go through which means it can also provide higher peak power, the EDLC combines both high power density and a relatively high energy density. The Ragone plot shown in Fig. 2-2 gives a qualitative comparison of the energy and power
densities of batteries, traditional capacitors and EDLCs. The EDLCs can be seen as transitional between traditional capacitors and batteries.
Ragone Diagram of Various Energy Storage Technologies
+ Maxwel 0 Nesscap vEpcos 6 Cm Itor 10 DLC 10 10 104 10 10' 102 10 Specific Energy [WkgJ
Fig. 2 -2 Energy density and power density comparison using Ragone plot (conventional capacitors, EDLCs and batteries) [19]
Other promising advantages of ultracapacitors include their long lifetime as well as strong reversible storing and releasing charge capabilities. They are capable of withstanding a large number of charge/discharge cycles without sacrificing the available total state of charge [16]. A comparison table of the specifications of ultracapacitors, Ni-MH batteries and Li-ion batteries is shown in Table 2-1, from which one can get a general overview of how the energy density, the life cycle and the power density of these three energy storage devices compare.
Table 2- 1 Comparison of Specs of different energy storage device [21] [22]
Ni-MH battery Li-ion battery
Ultracapacitors
(typical) (typical) (typical)
Power density (kW/kg) 0.25 -1 0.3 8 -15
Longevity (cycles) 102 - 103 102 - 103 105 - 106
103 - 104
The history of ultracapacitors is summarized in reference [16]. They were first designed for military uses such as power sources for electronic fuses and arming devices, missile guidance systems and laser weapons [17]. Then, the EDLCs were used as the standby power for integrated circuit memories, power systems and electronic devices [23], [24]. However, the energy density of EDLCs is still relatively low compared with that of commonly used batteries, thus rather than being used as a main source of energy, the EDLCs are most beneficial when used as a complement power source for other energy sources, typically batteries, fuel cells, etc. A good example of using the EDLCs to complement batteries is regenerative braking in the automotive industry, such as electric vehicles [25] [26] and subway transportation systems [27]. The EDLCs are used to capture the energy at very high power normally lost during braking and reuse it. In this way, ultracapacitors help to both save total energy and to drive the engine during peak power demand, thus improving the power density of the whole energy storage system.
2.2 Modeling of Ultracapacitors
A number of electric circuit models for EDLCs have been developed for simulation purposes and to better understanding their behavior. Characteristics and trade-offs of different types of models are compared in [16], [23], [28]. Depending on their application and desired accuracy, the models for EDLCs can vary from very simple to very complex.
Because the charge diffuses at different speeds based on the different physical sizes of the pores in the active electrode, RC pairs with different time constants are typically used to model the charge balancing inside the EDLCs [29], [30], [31]. Different models chose various combinations of RC pairs (in series, in parallel, or in transmission line form), however, different RC pairs usually represent distinct time constants with an order of magnitude separation from each other.
- The EDLCs have been observed to have voltage-dependent capacitance due to the interfacial tension in the double layer [32], which is usually modeled as a nonlinear
capacitor. In addition, the ESR and the capacitance of EDLCs are also changing with frequency and temperature, the effect of which has also been modeled [33], [34].
Based on the goal of this particular investigation, several requirements were considered when selecting the model, as listed below:
>
The model needs to accurately simulate the performance of EDLCs in the pulse period range of 1 ms to 10 s. Because the pulse period of interest was designed to be from 50 ms to 400 ms, the upper and lower boundaries were selected to leave some space to guarantee accuracy. The accuracy outside of this pulse period range could be compromised.>
The model should not be too complicated or contain too many components. On the other hand, it should not be too simple to fail to represent crucial characteristics of the EDLCs, for example, the nonlinear capacitance behavior.>
Frequency and thermal effects on the EDLCs will not be considered. A fan was designed to cool down the EDLCs, Li-ion batteries and the switches and keep the temperature almost constant (details in Chapter 4).The model proposed by Zubieta [30], shown in Fig. 2-3, contains three branches of RC pairs, a leakage resistor and a nonlinear capacitor. Because it provides a simple circuit configuration and relatively accurate representation of the EDLC's performance, this investigation will model the EDLCs based on this equivalent circuit.
RO R1 R2
Vc +
C0 C O Cl C2
VE:O
Fig. 2 - 3 Equivalent circuit model for EDLC proposed in [30]
Parameter Identification Methods for EDLC models:
EDLC is monitored during a long duration. The values of all R and C will be calculated by analyzing the voltage waveform. The parameter extraction experiments were also conducted on the same hardware board, and described in detail in Chapter 5.
Rated Voltage
Capacitor Voltage
Charge Current Pulse
lime
Fig. 2 - 4 Single pulse charge experiment for EDLC parameter identification
2.3 Modeling of Batteries
There are three popular types of existing battery circuit models which are compared in [35] [36]. Each of them features short-term time domain, frequency domain and long-term time domain characteristics of a single-cell battery.
A battery can be simply modeled as a Thevenin equivalent with an open circuit voltage source and series resistor or impedance. In a long time period, the open circuit voltage (OCV) V,, changes according to the change of the state-of-charge (SOC) of the battery, thus
V, could be modeled as a charge-dependent (or current-dependent) voltage source.
Since the goal of this thesis cares about both long-term and short-term performance of the batteries and how much overall benefits the ultracapacitors could bring to the batteries from fully charged to fully discharged, the widely adopted runtime model proposed by [35] was used, as shown in Fig. 2-5. The left part of the model represents long-term
performance of the battery, which consists of the self-discharge resistance Rself-discharge
and the capacitor Ccapacity indicating total capacity of the battery. The right part of the model consists of the equivalent series resistance (ESR) R5, and RC pairs modeliing
transient performance at different time constant. Two or three pairs of RC are usually used in most models.
Voltage-Current Characteristics
>
II
I
Fig. 2 -5 Circuit Model for batteries proposed by [35]
The selected battery model has been widely revised and tested for commonly used 4.2 V Li-ion batteries, Lithium Polymer batteries and Nickel-metal Hydride battery (Ni-MH) and Lead-acid batteries [35], [37], [38]. Relatively less research has been conducted to verify whether the model would fit for LiFePO4 batteries [39], [40]. Even though some results indicate that there are errors in the model when LiFePO4 batteries are discharged to low SOC [39], for this investigation, because the 90% SOC to 20% SOC part of the performances influences most to our results, the accuracy is acceptable and the model proposed in [35] is used, but with different experimental sets to extract parameters.
Parameter Identification Methods for Battery models:
Based on Fig. 2-5, there are several parameters whose values need to be determined through parameter identification experiments: Rself-discharge, Ccapacity, SOC - OCV relationship, series resistance Rs, short-time transient RC pair Rts/Cts, long-time transient RC pair Rt1/Ctj, and other possible time constant RC pairs. By assuming the self-discharge
resistance will not influence the performance over a times on the order of an hour, and ignoring capacity decreases, we will set Rself-discharge infinite and Ccapacity equal to 1.
In general, all parameters could be extracted by proper pulse-charging experiments from deep discharge to fully charge or vice versa. To get a sense of how to better design the experiments, several different processes described in existing papers have been compared in Table 2-2 [35], [39], [41]. Because this investigation cares more about discharge behavior of batteries, the test steps were designed based on pulse discharge experiments only, and the discharge current amplitude, duty cycle and period were designed to accommodate our experiments. Details of the parameter extraction process are described in Chapter 5.
Table 2- 2 Comparison of different parameter extraction methods of batteries
[35] [39] [41]
Conducted Tests Pulse discharge tests. Continuous Pulse charge tests; pulse
discharge; pulse discharge tests discharge
Discharge/Charge 0.1C, 0.3C, 0.7C,1C 0.5C, 0.75C, 1C 0.33C, 1C
Current Level
Pulse Width Each pulse discharges 30 min First pulse discharges
(for pulse tests) 0.lAh lAh, then every pulse
discharges 1OAh.
Rest Width 10 min 2 hours 1min
How to define Regression based on Regression based on Average of both charge
SOC-OCV curve? discharge curve discharge curve curve and discharge curve
How to get RC Calculation based on the Calculation based on Calculation based on the
parameters? average of different different discharge first pulse
Chapter 3 Design of Experiments
One way of evaluating the effectiveness of a battery is to consider the amount of energy that can be drawn from it, i.e., its energy capacity. As previously discussed, the energy capacity can be enhanced, in specific scenarios, by paralleling an ultracapacitor across the battery. Accordingly, the objective of this thesis is to quantify the improvement in energy capacity, between a battery-ultracapacitor hybrid system versus the battery used on its own.
Ideally, the energy capacity could be measured directly. For example, one may discharge the battery, or the hybrid system, from its fully-charged state to depletion, and record the total output energy. The issue with such an approach is the amount of time required. Each instance of the experiment could take on the order of hours. Time would become a bottleneck, preventing us from conducting experiments at a wide variety of load conditions.
Instead, in this thesis, we propose a proxy metric for energy, named the discharge
capacity, denoted as 0. As discussed in Section 3.1, the discharge capacity indicates the
effectiveness of an energy storage system, in a similar manner to the energy capacity described above. However, and most importantly, the discharge capacity can be measured in a shorter time, thus allowing for more data to be gathered in a given time period.
To compare the effectiveness of two different energy storage systems, a second metric
normalized energy gain is defined in Section 3.2, denoted as 60. It can be used to describe
the difference between the effectiveness of two energy storage systems, or more intuitively, the "gain" in energy capacity of one energy storage system over another.
3.1 Discharge Capacity
The Discharge Capacity of an energy storage system, with units of Joule/Coulomb, is
defined as the amount of energy delivered to the load per unit charge drawn out of the ESS during the discharge, as shown in (2),
t2
AE
fa v(t)i(t)dt
(2)product of load voltage, v(t), and load current, i(t), over time. The latter is computed by integrating the load current over time.
The derivation of discharge capacity is justified by the conservation of charge and energy between a battery (or a hybrid system) and its load. Ignoring aging effect, it can be shown that any given battery contains a fixed total amount of charge. Eventually, all of this charge will be transferred from the source to the load, and the energy transfer that results is by definition,
E =fvdq.
(3)It implies a phase plane of v and q, and energy is the area enclosed by any v(q) curves and the q axis. For a pulse load application, an example of forming a trajectory on the v - q plane is shown in Fig. 3-1. The load voltage v(t) and the load current i(t) are measured, and the charge is computed as the integral of the current. One can see that on the v - q trajectory, the voltage waveform has separate impulses along on the smooth
curve.
Puise Load Current
) 0.2 0.4 0.6 0.8 1
Load Charges
0 0.2 0.4 0.6 0.8
/s
0
Terninal Votage of an ESS
0 0.2 0.4 0.6 0.8 1
U/s
Vokage -Charge Refationship
Li
W
3i
Charges/cotomb 'I Fig. 3- 1 Trajectory on the v - q plane for a pulse load application
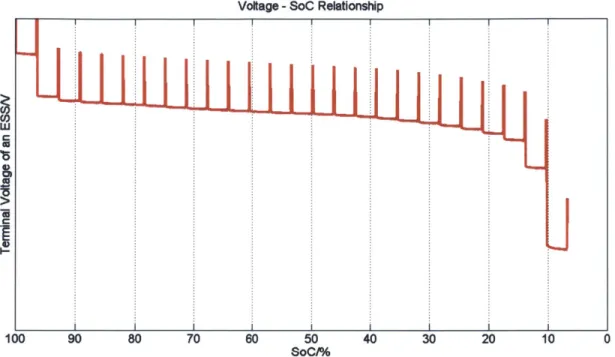
The load charge is equivalent to the SoC of the energy storage system, thus the trajectory of the terminal voltage of the ESS versus its SoC on the v - q plane can be shown as Fig. 3-2.
0
'I,
.9 0
Voltage -SoC Relationship
100 90 80 70 60 50
SoC/%
40 30 20 10 0
Fig. 3- 2 Trajectory of the termial voltage of an ESS vs SoC of the ESS
The spikes on the curve have zero width and a height equal to the voltage between two current pulses. There is no area in these spikes thus no change in energy. We pick the
discharge capacity 0 such that at these spikes, the derivative of 0 over q is finite and at
other places, 0 is equal to the terminal voltage v. Thus 0 is a smooth function of q, and
E = f0(q)dq = fvdq
Since 0(q) is smooth, using the mean value theorem,
q2
AE =
f
0(q)dq
~
O(q')(q2
- q1),Thus there comes our definition of discharge capacity,
AE
0(q)
= -Iq
AQ
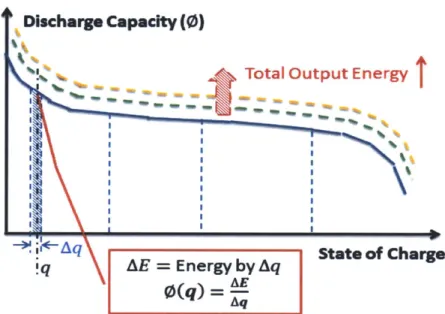
q' E [ql, q2] W C (4) (5) (6)An example curve of 0 versus SoC is shown in Fig. 3-3. For a certain state-of-charge, the higher 0 is, the greater the area is beneath the 0 - q curve, meaning more energy can be supplied to the load by the ESS.
The discharge capacity is a metric fully relating energy and charge, and itself could be a function of temperature, pulse profiles, battery type, etc.
Discharge Capacity (0)
Total Output Energy
Aq State of Charge
!q AE
=Energy
by Aq(q) =
-Fig. 3- 3 Discharge Capacity 0 - SoC Trajectory
3.2 Energy Gain and Normalized Energy Gain
The energy gain is defined as the absolute difference between discharge capacities of a
hybrid energy storage system, (DH, and its battery-only counterpart, DB, under the same SoC, denoted as AO and shown in (7). It indicates the absolute value of how much more energy one could draw out from the hybrid ESS than the battery-only ESS.
A0Iq
= 0HIq - 0 BIq (7)To have a standard for comparing the energy gain under different conditions (such as different pulse loads, battery types, etc.), a percentage number rather than the absolute value is used. The normalized energy gain is denoted as 60 and defined in (8). It can also be translated to an increase in percentage of the ability to output more energy with the same amount of charge.
4
0|q
=
-
qOB
0HIq
- OBIq
B Iq
A positive 80 indicates an improved performance by incorporating EDLCs in the system. The larger the 80 is, the more improvements the hybrid energy storage system has.
3.3 Theoretical Analysis
There are many variables that potentially influence the two metrics defined above. A few examples are the pulse load profile, the battery's state-of-charge, the temperature and the discharge rate.
A theoretical analysis was conducted to shed light on what these possible variables are and their influence on the trend of the metrics. The analysis also gives instructions to the design of the experiments.
The simplest Thevenin models for both batteries and ultracapacitors were used: a voltage source or a capacitor with its series resistance, as shown in Fig. 3-4. The load current i is the periodically pulsed load, with a duty cycle D and period T:
0
t DT t>DT (9) i i Rc + ic ccap+ IC Rb Vb VocvFig. 3- 4 A simple model of battery-ultracapacitor parallel system
Considering the circuit entering in its periodic steady state, the discharge capacity of the hybrid energy storage system and the battery-only system can be calculated as in (10) and (11) respectively. The derivation process is described in detail in Appendix 1.
(8)
.
I,
_f(vbi)dt-Vo,-0 Battery-Only
- - ocv - RI (10)
DT -(1-D)T
0Hybrid
= f(vbidt V - Rb fo ibdt - R[I RI Rb( e - ( 1 -T
f idt Ocv DT DT -T
eTeq - 1
(11) Where Teq = C(Rb + Rc). And the normalized energy gain is
-(1-D)T 0 Hybrid Rb2 ! 1 e Teq 1-DT j50 = _-1 -- -( )(1 -e eq) 0 Battery-Only OCV -Rb I DT -T e Teq-1
From (12), the normalized energy gain depends on the pulse information (duty cycle D, period T, pulse amplitude I), and battery parameters (ESR Rb, open circuit voltage Voc,) and ultracapacitor parameters (ESR Rc and capacitance C). As previously mentioned, Vc, and Rb are changing with the battery' SoC, temperature, frequency, etc. The parameters of the ultracapacitor are also changing with its SoC, temperature and frequency. The trends of the 80 when changing these seven variables are shown in Fig. 3-5.
(12)
Normalized EG vs Pulse Ampliude Normrlized EG vs Duty Cycle
10 20 3
Pulse Amplitude/A
Normtahzed EG vs Open Circt Voltage
4 6 8 10 12 14
Open Circuit VoitageN
0 20 4O 8) 80 100 Duty Cycle% Normalized EG vs Btery ESR
0 100 200 300 40 500 Btery ESRnohm
Fig. 3- 5 Possible changes of
Normlized EG vs Pulse Period
0 0.05 0.1 0.15 0.2
Pulse Periodlms
Normalized EG vs Capackibce Normalized EG vs Capacitor ESR
0 5 10 15 20 0 0.1 0.2 0.3 0.4 0.5
Capacitance/F Capacitor ESR/mohm
80 versus different variables i
This trend is not very accurate because in reality the changes of open circuit voltage and battery ESR, as well as the changes of capacitance and its ESR could not be separated. For example, typically for ultracapacitors, larger capacitance value corresponds to a smaller capacitor ESR. And the sharp change in the plot "normalized EG vs Battery ESR" is a mathematical artifact.
But still one can find important trends such as: the normalized energy gain will increase as pulse amplitude increases, and will decrease as duty cycle and period increases. It will increase as the open circuit voltage decrease and decrease when the capacitance increases. 3.4 Design of Experiments
The theoretical analysis gives some direction as to what to choose as the variables for this investigation.
For pulse information, pulse amplitude, duty cycle and period were chosen. For ultracapacitors, since its capacitance and ESR could not be separated, various values of capacitors were chosen.
For batteries, two types of batteries (Ni-MH and Li-ion) were chosen to provide different ESR values. And to match the open circuit voltages for these two types of batteries, different numbers of cells were put in series.
In addition, because of the impossibility of controlling RC parameters and the open circuit voltage of the batteries, a specific final SoC level was chosen. The assumption of this choice is that the open circuit voltages and the battery RC parameters will stay relatively unchanged at this SoC.
Therefore, there are six degrees of freedom in the experiments: pulse amplitude, pulse frequency, pulse duty cycle, capacitance, battery type and SoC. Hardware experiments as well as simulations based on a more accurate model were designed to reveal the exact trend of 0 and 60.
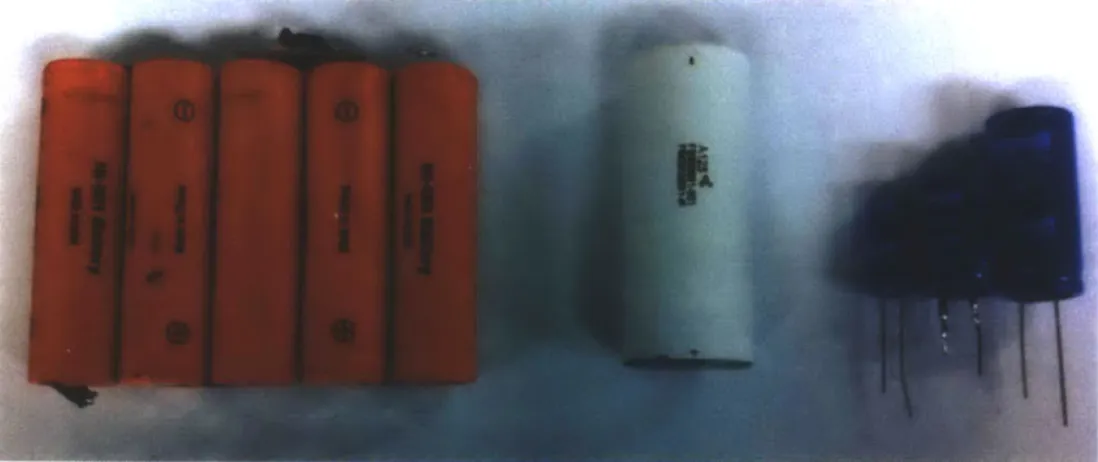
3.4.1. Devices for the Experiments
The devices for the experiments are one type of Nickel-metal Hydride battery (Ni-MH), one type of Lithium Ferro Phosphate battery (LiFeP04) and three values of ultracapacitors. The Ni-MH battery pack consists of five 1.2 V Panasonic HHR370AH cells in series connection, with a total voltage of 7 V. The Lithium-ion battery pack consists of two 3.3 V A123 ANR26650 cells in series connection, to get a comparable total voltage of 6.6 V. The
batteries and the ultracapacitors are shown in Fig. 3-6 and their specifications from
datasheets are listed in Table 3 - 1.
Fig. 3- 6 Devices used in the investigation Ni-MH battery pack, Lithium-ion battery pack and
ultracapacitor cell (left to right: 5F, 25F, 50F)
Table 3 -1 Specifications of devices used in the investigation
Ni-MH [42] LiFePO4 [43] Ultracapacitors [44]
Norminal 2.7V Voltage/cell 1.2 V 3.3 V 2.7 V 2.7 V Capacity/cell 3.5 Ah 2.3 Ah -Capacitance/cell - 5F 25F 50 F Estimated ESR/cell 20 mQ 10 ml 170 ml 42mf 2Omf Diameter/cell 18.2 mm 26 mm 10 mm 16 mm 18 mm Length/cell 67 mm 66.5 mm 20 mm 26 mm 40 mm Mass/cell 60 g 70 g 2.3 g 7.5 g 13 g
Manufacturer Panasonic A123 Maxwell
Part number HHR370AH ANR26650-M1 BCAP0005 BCAP0025 BCAP0050
Cells in Series 5 2 3 3 3
3.4.2. Design of Pulse Loads
As mentioned in section 1.1, this investigation is interested in A to 20 A, and pulse periods from 50 ms to 400 ms and duty cycles
pulse amplitudes from 3 mainly from 5% to 50%. For the hardware experiments, discrete numbers in these ranges and different combinations of these numbers were selected. As discussed in Section 3.1, the SoC level to which the two ESSs will discharge needs to be specified. Considering the time limitation of
experiments, the SoC level of 99% was chosen. Depending on the SoC level, pulse numbers for different pulse load profiles were decided.
The specified pulse load profiles are listed in Table 3-2. Pulse numbers are calculated based on the 99% SoC level. However to simply the hardware experiments, each of the
pulse load profile takes 2000 or 4000 pulses. And in the latter data processing part, a desired number of pulses were separated and the two metrics were calculated based on these pulses. For example, for a pulse load with the pulse amplitude of 8 A, duty cycle of 20% and a pulse period of 100 ms (as in No. 8 in the Table 3-2), the desired pulse number is 500. We first took 2000 pulses data, then calculate 0 and 60 based on the first 500 pulses.
Because the discharge capacity (0) is the derivative of energy with respect to charge at a given charge level, 0 and 80 were both calculated based on the last 10 pulses of the total
desired pulses. An example is shown in Fig. 3-7.
Table 3 -2 Pulse load profiles in the hardware experiments
No. Amplitude /A Period /ms Duty Cycle /% Pulse number Capacitance /F
1 4 100 10% 2000 2 4 200 10% 1000 3 8 50 5% 4000 4 8 50 10% 2000 5 8 50 20% 1000 6 8 100 5% 2000 7 8 100 10% 1000 8 8 100 20% 500 9 8 200 2.5% 2000 1.667/8.333/16.667 10 8 200 5% 1000 11 8 200 10% 500 12 8 200 20% 250 13 8 200 50% 100 14 8 200 75% 67 15 8 400 10% 250 16 12 100 10% 667 17 12 200 10% 333 1.667/8.333/16.667 18 16 50 5% 2000 19 16 50 10% 1000 20 16 50 20% 500 1.667/8.333/16.667
-
Amplitude = fA Period = lOOms; Duty Cyde =10%S Amplitude = A; Perod = 100ms; Duty Cyde = 20%
BatteryVoltage
desired pulse nwnber 1000 pulse
calculate 0 and 60
A= 10 pulse
State of Charge
BatteryVoltage
desired pulse number = 500 pulse I
k
calculate 0 and 60State of Charge A= 10 pulse
Fig. 3- 7 Examples of using the last 10 pulses to calculate 0 and 60
23 16 100 20% 250 24 16 200 2.5% 1000 25 16 200 5% 500 26 16 200 10% 250 27 16 200 20% 125 28 16 200 50% 50 29 16 200 75% 34 30 16 400 10% 125 4
:11
Chapter 4 Experimental Apparatus
The experimental apparatus was designed and improved based on the system in [12]. To freely control different degrees of freedom, a discharging circuit and a measurement circuit were designed; to guarantee each discharging experiment starts at the same fully charge point, and give us freedom to charge different types and combinations of batteries, a charging circuit was also designed and implemented.
The core of the test rig is a microcontroller, which controls the charging and discharging circuit as well as takes measurements. There are several requirements that the rig must meet:
>
To be able to source/sink current in a range of 0 to 20 A, and provide good accuracy;>
To precisely sample data as well as output pulses with various duty cycles and periods.This is critical for conducting any sort of experiments sweeping along pulse amplitude, frequency and duty cycle.
>
Experiments on batteries often run for hours, thus the apparatus needs to record a large amount of data, which requires either separate SRAMs on the printed circuit board or communication with a personal computer.Several improvements need to be considered for the new apparatus compared to the previous test rig in [12]:
>
The microcontroller based measurement system needs to be improved in terms of clock accuracy, sampling frequency, analog-to-digital converter (ADC) accuracy as well as the speed of data transfer. The previous test rig was designed with an 8 MHz internal clock, a 10-bit internal ADC and a Universal Asynchronous Receive/ Transmit (UART) rate of 115200 BAUD, which were all proved to be not sufficient.>
The flow map of the program needs to be redesigned to guarantee a more accurate timing and achieve a more efficient data sampling process. In the previous work, the period and width of the pulsed load was substantially differenent from what we expected and programed in the microcontroller.>
The floating ground problem needs to be solved. Since there was no isolation between the digital communication circuits and the high-current-side circuit, there was an analog ground shift caused by closing the loop from the high side power supply ground,through the USB port. This floating ground increases the noise on the ADC data collection, and shifts the signals up by over 10 mV.
The discharge part of experiments was also conducted later on a borrowed Agilent Advanced Power System (APS) N7951A to verify the accuracy of the experimental results.
Fig. 4-1 shows the block diagram of the new test rig. The Atmel microcontroller ATxmegal92A3U was chosen and put in the center of the diagram. Its internal 12-bit Digital-to-Analog Converter (DAC) was used to generate proper analog signals to control the current level of charging or discharging. The microcontroller also controls a separate 8-channel 16-bit ADC (Analog Device Inc., AD7606) to conduct simultaneous sampling. Furthermore, it communicates and transfers data to the personal computer through a UART-to-USB chip FTR232R.
UART - use FT-3ZRIS3A,
Analog current value/
Timing Charge/oWschr. I Nodov gE circuits Batterya Uatrcapcitor I16-bit ADC Op-amp Conditioning
Fig. 4 - 1 Block diagram of the experimental apparatus
4.1 Design and Improvement of Charging and Discharging Circuit
General Circuit:
The charging circuit and the discharging circuit were both designed based on the same theory to function as constant current sources, as shown in Fig. 4-2 [12], [45]. The operational amplifier (Op Amp) U, serves as a controller, compares the desired current value with the measured current value to set the gate signal to the power switch
Q.,
whichK$iEE
<
O
operates in its saturation region and can be considered as a voltage-controlled current source. UIA is an instrumentation amplifier, serving as both a signal conditioner and a
filter of ground floating noise.
Vcharge/ C Me Vdischarge +V. d UC Cc --- -- Vu Icharge/ Rc+V Idischarge U~LA R9g R Vcc -Vbattery, Vbattery
Fig. 4 - 2 The constant current source used in the charging/discharge circuit The difference between the charging and discharging circuits is the static operating point voltage between source and drain of the power switch: for the former one it is Vcc minus the battery's terminal voltage and for the latter one it is the battery's terminal voltage.
Comprehensively considering the pulse amplitude we would like to achieve, and the upper limit of the reference current signal (set by the DAC of the microcontroller to 1.0 V), the shunt resistor was chosen as 10 mfl and the gain of the instrumentation amplifier U2 was set to 4.984. This number was determined by the gain equation of the instrumentation amplifier when choosing a precise gain resistor of 12.4 kfl, as shown in (13).
49.4 kU
GAIN = RG + 1 (13)
Then the relationship between input analog signal Vcharge or Vdischarge and the output current Icharge or Idischarge is
Idis/charge =
O.Os/ch
=
19.984V8is/charge (14)By staging two switches into a half bridge, the upper MOSFET functions as a charging circuit and the lower MOSFET functions as a discharge current source, as shown in Fig. 4-3. All devices with index 1 are for the discharging circuit and those with index 2 are for the charging circuit. The only exceptions are that the shunt resistor R1 is for the discharge circuit, R2 is for the current measurement in the capacitor branch, and R3 is for the charge circuit. RC2C oCARGING SGNAL VCC1 Cc A
-n-i
UC
A1I
U.JA2 -VC A" R3 RZFig. 4 - 3 Circuit diagram of the charging and discharging circuit
Both Uc and UTA are selected as dual-supply devices, so that they can either control and measure currents during both the charging and the discharging processes. In addition, the input range and the output range of Uc and UIA can reach exactly zero without a close-to-rail problem of many single supply amplifiers, which improves the accuracy of controlling and measuring small current signals.
The disadvantage of the dual-supply devices is that during discharging, the current in the R3 branch (i.e., battery branch) is opposite to the charging direction, thus the output of
UIA2 will be negative and accordingly the inverting input of UC2 is also driven negative.
However the non-inverting input of Uc2 is constrained by the microcontroller to have a
lowest value of 0 V (neglecting any offset), thus the gate signal of Qs2 will be positive and Qs2 will be on instead of off as it should be. An external circuit was added to manually short the output of Uc2 to ground during discharging to guarantee that Qs2 turns off.
Compensation:
The power MOSFET has capacitance Cgs between gate and source, which can be seen as a capacitive load to the Op Amp U,. When driving capacitive loads, an Op Amp tends to have peaking and oscillation problems and may cause reduced bandwidth and additional phase shift [46].
By analyzing the mathematical model and the open-loop transfer function of the constant current source circuit, the frequency response is plotted in Fig. 4-4. It can be seen that without any compensation, the phase margin of the open-loop transfer function is only 180. A feedback compensation between Uc's output and its inverting input needs to be designed to add more phase margin at the crossing frequency [47], [48].
Three different feedback compensations have been simulated: resistive feedback, capacitive feedback and integrator feedback. It shows that the integrator feedback can
increase the phase margin to 67* without a large influence on the dc performance. Thus the compensation resistor-capacitor pairs Rc1/CC1 and Rc2/Cc 2 in Fig. 4-3 were added.
Bode Diagram of Open-Loop Transfer Function under dfMerent compensation
150-Origial 100-- -. -. -. - .- RIstiveFeedBck -IntegratorFeedback 50- -.-... - Res+ rtegratorFeedBack - -- CapFeedback a -5 0 - - -.. - -. - - . .. ..-.. .. . .. ... .... .. 15 -180 - -.-.--270 - --- -- --- ---360 ... .... . ... . ... -1012 10 1010 Frequency (Hz)
The charging circuit needs to output current from 50 mA to at least 3 A for reasons discussed in section 4.1.3, however the output Op Amp of the built-in DAC of the microcontroller is not able to reach down to its rail [49]. The lowest voltage it can output is 16 mV, which according to (14) still gives the battery branch a 0.3 A charging current. Thus a subtraction circuit was added to the non-inverting input of UC2 to guarantee the
charging current can go below 50 mA, as shown in Fig. 4-5(a).
The discharging circuit needs to output currents up to 20 A during pulses and also shut down completely in between the pulses. However, the input offset voltages of the Op Amp and the instrumentation amplifier, even though only typically 80 [iV [50], prevent the MOSFET from completely turning off when we program the analog signal Vdischarge to zero.
An offset of minus 2 mV was added through a potentiometer to the inverting input of Uc1
to guarantee the circuit can output zero current, as shown in Fig. 4-5(b).
The specifications of devices used in the circuit Fig. 4-3 and Fig. 4-5 are listed in Table 4-1. Because of the symmetry, most devices are the same in the charging and discharging circuits.
Table 4- 1 Device value and part number
Device Function Part number/value
Ucontrol Low-offset precise operational amplifier AD8671 U_InstruAmp Instrumentation amplifier AD8221
Qswitch Power MOSFET ST43MN60N
Rshunt Precise shunt resistor (FPR 2 - T218) 10 mfl + 0.5%
Rdamp Damping resistor 10
Rcompensation Compensation resistor 10 kfl
Ccompensation Compensation capacitor 270 pF Roffsetl Offset resistor for discharging circuit 10 Mfl Roffset2 Offset resistor for charging circuit 100 fl Rpot1/Rpot2 Potentiometers for offset adjustment 2 kfl Uoffset Subtraction operational amplifier AD8672
RoWs Rpot2ve uersVt+Rd Qs2 Vcharge + Ua +Uc2 A Rd V-Rc2 U-IA2" Rg2 Rs2 -V A"
(a) Offset adjustment for charging circuit
Vdischarge We RC vec Vee Rpot I Rofs I + Rdl L Ccl -- -- vc + --
F
-V(b) Offset adjustment for discharging Circuit
Fig. 4 - 5 Offset adjustment using potentiometer and Op-amp
4.2 Design of the Measurement and Control Circuit
To improve the accuracy and guarantee simultaneous sampling of data, a separate 16-bit 8 channel analog-to-digital converter (ADC) AD7606 is used. It can sample eight inputs simultaneously at a maximum rate of 4 gs, and outputs 16-bit digital data, which we use parallel data bus to transfer to the microcontroller.
![Fig. 1- 2 Charging and discharging circuit (left) and its experiment PCB board (right) [12]](https://thumb-eu.123doks.com/thumbv2/123doknet/14105604.466036/12.918.95.796.88.465/fig-charging-discharging-circuit-left-experiment-board-right.webp)

![Fig. 2 - 2 Energy density and power density comparison using Ragone plot (conventional capacitors, EDLCs and batteries) [19]](https://thumb-eu.123doks.com/thumbv2/123doknet/14105604.466036/16.918.241.651.389.720/energy-density-density-comparison-ragone-conventional-capacitors-batteries.webp)
![Fig. 2 - 5 Circuit Model for batteries proposed by [35]](https://thumb-eu.123doks.com/thumbv2/123doknet/14105604.466036/20.918.185.703.89.320/fig-circuit-model-batteries-proposed.webp)