HAL Id: hal-01633706
https://hal.archives-ouvertes.fr/hal-01633706
Submitted on 30 Jan 2018
HAL is a multi-disciplinary open access
archive for the deposit and dissemination of
sci-entific research documents, whether they are
pub-lished or not. The documents may come from
teaching and research institutions in France or
abroad, or from public or private research centers.
L’archive ouverte pluridisciplinaire HAL, est
destinée au dépôt et à la diffusion de documents
scientifiques de niveau recherche, publiés ou non,
émanant des établissements d’enseignement et de
recherche français ou étrangers, des laboratoires
publics ou privés.
Metrological Analysis of the DIC Ultimate Error Regime
Michel Bornert, Pascal Doumalin, Jean-Christophe Dupré, Christophe
Poilane, Laurent Robert, Evelyne Toussaint, Bertrand Wattrisse
To cite this version:
Michel Bornert, Pascal Doumalin, Jean-Christophe Dupré, Christophe Poilane, Laurent Robert, et al..
Metrological Analysis of the DIC Ultimate Error Regime. 1st Annual International Digital Imaging
Correlation Society Conference, Digital Imaging Correlation Society, Nov 2016, Philadelphie, PA,
United States. pp.191-193, �10.1007/978-3-319-51439-0_45�. �hal-01633706�
M
ETROLOGICAL
A
NALYSIS OF THE
DIC
U
LTIMATE
E
RROR
R
EGIME
M.
B
ORNERT,
Université Paris-Est, Laboratoire Navier (UMR 8205), CNRS, ENPC, IFSTTAR, Marne-la-Vallée, FranceP.
D
OUMALIN,
Institut P’, UPR 3346 CNRS, Université de Poitiers, SP2MI, Futuroscope Chasseneuil, FranceJ.-C.
D
UPRE,
Institut P’, UPR 3346 CNRS, Université de Poitiers, SP2MI, Futuroscope Chasseneuil, FranceC.
P
OILANE,
Normandie Univ, ENSICAEN, UNICAEN, CEA, CNRS, CIMAP, 14000 CaenL.
R
OBERT,
Université de Toulouse, Mines Albi, INSA, UPS, ISAE, ICA (Institut Clément Ader), Albi, FranceE.
T
OUSSAINT,
Institut Pascal, UMR6602, Université Blaise Pascal – IFMA, Aubière, FranceB.
W
ATTRISSE,
LMGC, univ. Montpellier, CNRS, Montpellier, FranceABSTRACT
In DIC, the “ultimate error regime” corresponds to situations for which the shape function used to describe the material transformation perfectly matches the actual one. We propose to confront results obtained from numerically-shifted images with the predictions of theoretical models developed in the literature to describe bias and random error evolutions with respect to the imposed displacement. Results show the overall good predictions of these models but small deviations arise, mainly around integer values of imposed displacements for noisy images. These deviations are interpreted as the unrepresentativeness of the underlying hypotheses of the theoretical models in these particular cases.
Keywords: Digital Image Correlation, Metrology, Ultimate Error Introduction
The characterization of metrological performances of DIC techniques has been widely studied from experimental and theoretical point of view. Due to the complexity of the problem, these approaches generally deal with a limited number of parameters of the overall DIC problem. The first theoretical approaches proposed a noise propagation analysis in DIC procedure [1]. They were later complemented by adding the effect of image interpolation [2]. The collaborative work carried out by the workgroup “Metrology” of CNRS research network 2519 aims at contributing to a systematic approach to this question by dissociating the elements of the measurement chain. In [3], the effect of the image transformation was investigated. Two error regimes can be encountered: (i) the ultimate error regime, when the shape function is rich enough to represent the actual the displacement field, (ii) the shape function mismatch regime, when the shape function is too poor to reproduce the real displacement field on the chosen subset.
We propose to compare the predictions of theoretical models used to describe the random and bias errors to results obtained on translated computer-generated images. In these situations, the image transformation is perfectly known and the displacement measurements correspond to the ultimate error regime (no shape-function bias).
Theoretical models for random and systematic errors
The first theoretical analysis was proposed by Roux and Hild [1]. It consists in a statistical description of the sensitivity of displacement measurements with respect to superimposed image noise. This approach requires major hypotheses: perfect reconstruction of the grey level images (I being the initial image and T the final one), optical flow conservation and statistical model of the image noise (a zero-mean with a n standard deviation uniform white noise). Authors suggested an image noise
propagation in an analytical description of the correlation criterion (namely, the classical “Sum of Squared Difference” SSD criterion). In this case the bias error is null. Using similar hypotheses, Wang et al [2] consider an imperfect reconstruction based on some interpolation of grey levels. The expression of random (u) and systematic ( ) errors is then: u
2 2 2 2 ) ( ) ( I f I I h u I d n i n u (1)
where d stands for the subset size, I the grey level gradient. In this model, the random error u is independent of the actual
displacement. It has the same expression than the one obtained in [1]. The first part of the expression (denoted Einterp) of the bias error is noise-independent and shows a dependence with the fractional part of the imposed displacement through the local grey level residual h() at the correlation optimum. The second part (denoted Enoise) shows a quadratic dependence with noise. Function fi depends on the chosen grey level interpolation: it has been shown to be linear in case of a linear interpolation and quintic for a cubic one. Note that in this expression A stands for the average of A over the given subset for a set of drawing. It should be emphasized that this way of defining the bias error differs from the classical approaches where it is averaged over all the subset realizations, with various grey level and random noise distributions.
Experimental results
Figure 1 represents the evolution of both random and bias errors determined from computer-generated images obtained using the TexGen software for different levels of superimposed noise. Contrary to the predictions of Equation (1), the random error is not constant with respect to the imposed displacement for a given noise level. But the value of the plateau linearly increases with the imposed noised in accordance with Equation (1), and the slope of this evolution is consistent with the expression given in Equation (1) for the tested image and the chosen subset size. Figure 1.b illustrates the evolution of the bias error with the imposed displacement for a linear interpolation scheme. Classical S-shaped curves are obtained, with an inversion of concavity when increasing noise level. Whatever the noise level, the systematic error is null for integer imposed displacements.
Figure 1.a – Evolution of the random error u and 1.b – evolution of the bias error as a function of imposed u
displacement for different noise levels n for d = 16 px.
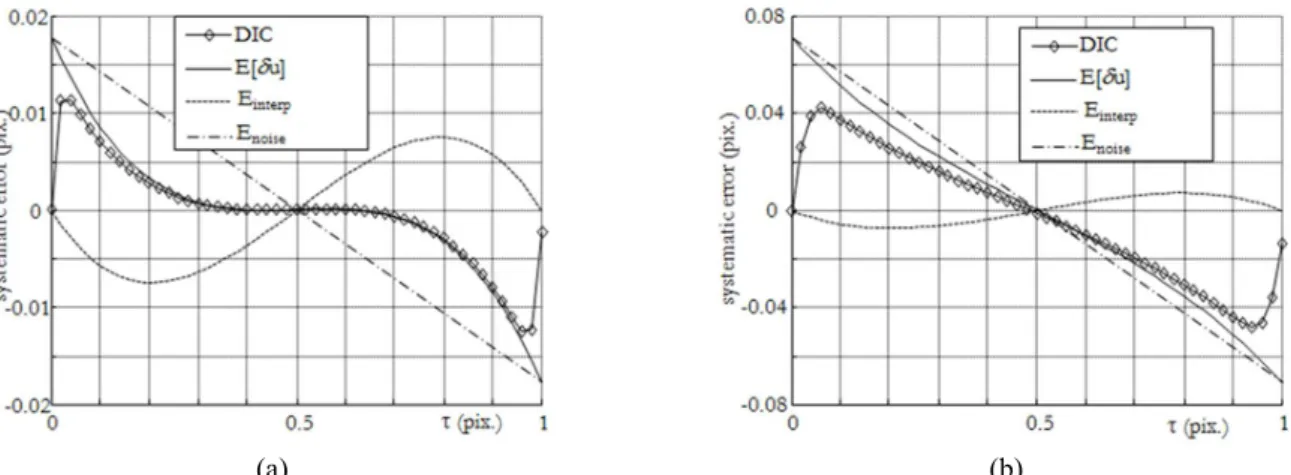
Figure 2 compares the experimental bias error and the theoretical expression given in Equation (1). When considering un-noised images, the results are perfectly consistent. When introducing image noise, some discrepancies appear: the experimental bias error is null for a null displacement while it is not null in the analytic expression. The difference is higher for higher noise levels.
(a) (b)
Figure 2 – Comparison of the experimental (DIC) and the theoretical (E[u]) bias errors as a function of imposed displacement for n 4GL (Figure 2.a) and n 8GL (Figure 2.b)
Conclusions
The theoretical model given in Equation (1) gives very satisfactory results for the description of the random and bias errors as a function of image characteristics (gray level gradients, noise), DIC parameters (subset size, interpolation scheme) and imposed displacement as long as the imposed displacement is not “too close” to integer values for noisy images. The discrepancy is related to the hypotheses made in the expectancy computations which are obtained on a fixed subset for several realizations of image noise with the model, while they are determined on various subsets for one realization of image noise for the experimental data. In practice, this latter method is more representative of displacement fields computed on a pair of images. Theoretical models should be complemented to account for these experimental observations.
Acknowledgements
On behalf of the Workgroup “Metrology” of the French CNRS research network 2519 “Mesures de Champs et Identification en Mécanique des Solides / Full-field measurements and identification in solid mechanics”. This work is dedicated to our colleague Laurent Robert who passed away in 2015.
References
[1] S. Roux, F. Hild. (2006) Stress intensity factor measurements from digital image correlation: post-processing and integrated approaches. Int. J. Fract. 140, 141-157.
[2] Y. Q. Wang, M. A. Sutton, H. A. Bruck, H. W. Schreier. (2009) Quantitative Error Assessment in Pattern Matching: Effects of Intensity Pattern Noise, Interpolation, Strain and Image Contrast on Motion Measurements. Strain 45, 160-178.
[3] M. Bornert, F. Brémand, P. Doumalin, J.-C. Dupré, M. Fazzini, M. Grédiac, F. Hild, S. Mistou, J. Molimard, J.-J. Orteu, L. Robert, Y. Surrel, P. Vacher, B. Wattrisse, B. (2009) Assessment of Digital Image Correlation measurement errors: methodology and results. Exp. Mech. 49, 353-370.