A tool to design steel elements submitted to compartment fires-OZone V2.
Part 2: Methodology and application
J-F. Cadorin, D. Pintea, J-C. Dotreppe, J-M. Franssen
Département de Mécanique des matériaux & Structures, Université de Liège, Bât. B52I3, Chemins des Chevreuils, 1, 4000 Liège, Belgium Abstract
The methodology implemented in the tool OZone V2 to design steel elements submitted to compartment fires is presented. Input needed to define a fire compartment are first quoted. The procedure to define the design fire is then explained. This procedure enables to take into account the benefits of active measures on the fire safety. The combined use of a two- and a one-zone model is then presented. A particular attention is given to the criteria of choice of the model and to the different scenarios that can occur. The calculation of steel element temperature is then explained. The proposed procedure takes into account the localised effect of a fire with the help of Hasemi's model. The fire resistance is then calculated with the EUROCODE 3 methods. An application is finally
presented.
Keywords: Compartment fire; Zone model; Localised fire; Design fire; Steel elements; Fire resistance
1. INTRODUCTION
Prescriptive codes for structural fire resistance tend to be replaced by performance-based codes. Yet, particularly in Europe, structural engineers are not used to model fires and their effect on structures. The tool presented in this paper has thus been elaborated to help them to design structural steel elements submitted to compartments fires. Basic knowledge and understanding has been gained over the last decades by specialists in fire modelling. Other specialists in the structural behaviour of buildings submitted to the fire have also made progress in their field. Too often yet, very little communication has taken part between these two fields of fire safety engineering; whereas the former used to think of the structural problem only in terms of a critical temperature of, say, 540°C, the latter used to represent the fire by a single nominal time-temperature curve, either the ISO 834 or the ASTM El19 curve.
Most of the knowledge is thus present allowing to make a real engineering analysis of the structural aspects related to fire safety in buildings. This analysis requires the determination of the fire development in the
compartment, then of the temperatures in the structural elements and, finally, of their mechanical behaviour. This knowledge was yet disseminated and it was not straightforward for a single individual to integrate all these notions for use in a practical, although simple application.
OZone V2 has been developed as a practical design tool to realise a performance-based analysis of the behaviour of simple steel elements in a compartment fire situation. Some particular new features have been introduced, the most significant being that the user has not to make a predetermined choice as to the description of the situation of the fire in the compartment: one-zone or two-zone model? The model is able to consider the initial phase of the fire as a localised fire with a two-zone development and, under certain circumstances, to switch later automatically to a one-zone description if required.
The aim of this paper is to present the methodology used in this tool and to show an example of application. The formulation of the compartment fire model is given in the companion paper [1].
Nomenclature
1ZM One-zone model 2ZM Two-zone model
ε* Relative emissivity of steel profile-gas interface γ partial safety factor
γq,1 partial safety factor associated with the floor area of the compartment γq,2 partial safety factor associated with the danger of fire activation γn,i i= 1-10; partial safety factor associated with the active measures p∞ density of ambient air (kg/m3)
σ constant of Stefan-Boltzman (5.67 x 10⁻⁸)
a1 fraction of the height of the compartment
a2 fraction of the floor area of the compartment
Af floor area of a compartment (m2)
Afi horizontal burning area of fuel (m2)
Afi,max maximum horizontal burning area of fuel (m2)
D fire diameter (m)
g gravitational acceleration constant (m/s2) h convective heat transfer coefficient (W/mK) H height of the compartment (m)
Hc,eff effective combustion heat of fuel (J/kg) Hc,net complete combustion heat of fuel (J/kg)
Hc,net,i complete combustion heat of fuel of type i (J/kg) HF vertical distance between the burner and the ceiling (m)
Hq height of fuel (m)
LH horizontal flame length (m)
m combustion efficiency factor mfi total mass of fuel (kg)
pyrolyssis rate (kg/s) Mi mass of fuel of type i (kg)
pfi probability of getting of fully developed fire
pf,fi probability of structural failure in case of fire
pt target probability
q" heat flux to the boundaries of a steel element (W/m2) qf fire load density (per unit floor area of compartment) (J/m
2
) qf,k characteristic fire load density (J/m2)
qf,k,eff effective characteristic fire load density (J/m2)
qf,k,net net characteristic fire load density (J/m2)
qf,,net net fire load density (J/m2)
qf,d design fire load density (J/m2)
qnet net heat flux at the boundaries of a steel profile (W/m2)
Q* Froude number Q*H Froude number
r horizontal distance between the burner and steel element (m) RHR rate of heat release (W)
RHRf,eff effective rate of heat release per unit floor area of compartment (W/m2)
t time (s)
tα time at which RHR equal 1 MW (defining the growing phase of a fire) (s) T∞ ambient temperature (K)
Tf1 temperature at which flashover occurs (K)
Tg temperature of the gas (1ZM) (K)
Tign ignition temperature of fuel (K)
Tloc fictive temperature for localised effect of fire (K)
Ts temperature of the section (K)
Tu & TL temperatures of the gas of, respectively, the upper and lower layer (2ZM) (K)
Tz temperature of a zone (K)
y nondimensional ratio between the distance from the virtual source and the total length of the flame z' position of the virtual source (m)
2. OVERVIEW OF THE METHODOLOGY
The methodology of the design can be divided in six main steps. The steps are: 1. description of the compartment;
2. definition of design fire;
3. calculation of the temperatures in the compartment; 4. temperature of the steel section
(a) definition of the thermal and mechanical section properties, of the thermal properties of the insulation material if the section is protected and of the thermal boundary conditions of the section;
(b) calculation of the temperature of steel elements, taking into account if necessary, the localised effect of the fire with the help of Hasemi's model;
5. fire resistance of the member
(a) definition of the dimensions, the effects of actions, and static boundary conditions of the member; (b) calculation of the fire resistance of the steel element;
6. acceptance or not of the fire resistance obtained in step 5. If the fire resistance is not accepted, the section or the thermal resistance of the insulation has to be increased and the process must be restarted from step 4. These steps are described in the subsequent sections of this paper.
3. COMPARTMENT
The compartment is described by: • its plan and elevation dimensions;
• the partition characteristics: layers thickness and thermal properties of materials;
• the size and position of openings: vertical and horizontal openings and forced vents can be modelled. 4. DESIGN FIRES
The basic input to define the fire [1] are the rate of heat release RHR(t) [W], the pyrolysis rate (t) [kg/s] and the fire area Afi(t) as functions of time. This section presents the definition of design fire proposed as standard
options in the software. In this context, the expression "Design fire" refers to the definition of the fire source development (RHR(t) mainly) and not to temperature-time curves. The procedure is based on the "Natural Fire Safety Concept" method which is first briefly presented. All the values proposed in the code may be changed by the user. Other design fire curves, with any shape, may also be defined.
4.1. Probabilistic basis of the method "Natural Fire Safety Concept"
The procedure to define the design fires is a semiprobabilistic approach developed in the research project "Competitive Steel Structures through Natural Fire Safety Concept" [2,3]. From pure probabilistic calculations, some partial safety factors γ on the fire load have been evaluated. The design fire load density is obtained by multiplying the characteristic fire load by the partial safety factors. The probability of structural failure due to a fire during the whole life of a structure, pf, can be obtained from the theorem of conditional probabilities given in
Eq. (1). The probability pt is acceptable if it is lower than a target value, pt,
Pf(failure from a fire) =Pfi(getting a fully developed fire)
The methodology used was to (a) collect statistics;
(b) from these statistics, deduce probabilities that: • a fire starts;
• the occupants fail in stopping the fire;
• the automatic active measures to extinguish the fire fail in stopping the fire; • the fire brigade does not succeed in stopping the fire;
(c) from these probabilities, calculate partial safety factor with the method of Annex A of ENV 1991-1 [4]. The design fire load density is given by Eq. (4) of Section 4.2.
4.2. Construction of the design fire
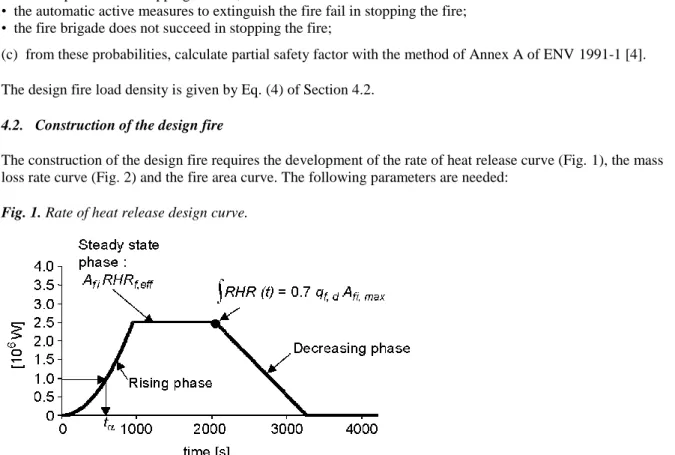
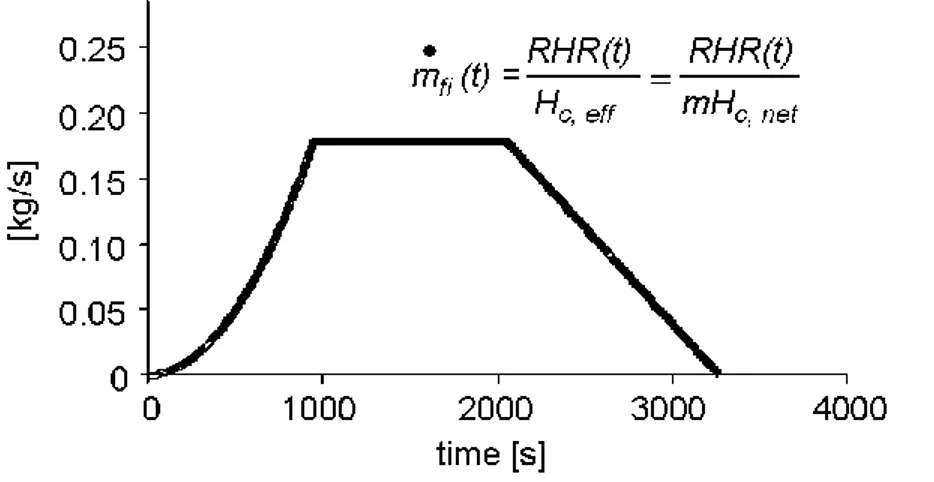
The construction of the design fire requires the development of the rate of heat release curve (Fig. 1), the mass loss rate curve (Fig. 2) and the fire area curve. The following parameters are needed:
Fig. 1. Rate of heat release design curve.
Net versus effective parameters: When talking about combustion heat, fire load or rate of heat release, it is important to know whether the combustion efficiency is taken into account in the value or not and this is not always clearly stated in the tables found in the literature. The combustion efficiency represents the fact that a unit mass of fuel releases less energy in real fires than in an oxygen bomb calorimeter. A net value of a parameter is related to the estimation of the parameter with the net combustion heat (evaluated in bomb calorimeter
conditions) while an effective value is related to the estimation of the parameter with the effective combustion heat (expected to occur in real fire conditions). For example, qf,k,net, the net characteristic fire load density is
linked to qf,k,eff,, the effective characteristic fire load density, by Eq. (2). m is the combustion efficiency factor (m
factor)
Fire load density-qf. The characteristic fire load density qfk considered in the NFSC Design Fire is the 80%
fractile of the fire load distribution obtained by survey in real compartments. Data are available for different types of occupancies of compartments. In order to obtain these data, the mass of all types of combustible present in compartments has been measured. Eq. (3) gives the net fire load density
The influence of the compartment area on the probability of starting of a fire is taken into account by γq1 factor. The influence of the danger of fire activation on the probability of fire start is taken into account by γq2 factor. The danger of fire activation is related to the type of occupancy of the building. The influence of active measures are taken into account by γn,i factors. The active measures are: Automatic Water Extinguishing System;
Automatic Fire Detection by Heat; Automatic Fire Detection by Smoke; Automatic Alarm Transmission to Fire Brigade; Work Fire Brigade; Off Site Fire Brigade.
Fig. 2. Rate of pyrolysis design curve.
The value of the different partial safety factors can be found in [3] for different types of building occupancy and fire safety measure.
Fire growth rate-tα: The growing phase of fire is assumed to follow the t2 evolution, characterised by the fire
growth rate tα, which is the time at which the fire area Afi has grown to a value leading to an effective rate of heat
release of 1 MW. The rate of heat release during the growth phase is given by
Rate of heat release per unit area of fire-RHRf,eff: The effective rate of heat release per unit area of fire RHRf,eff is
the maximum quantity of energy which can be released by unit area of fire in steady-state situation on the assumption that the available ventilation does not limit the rate of heat release [2,5]. This quantity, RHRf,eff is
given in the literature for different types of compartment occupancies. The values of RHRf,eff are for real fires
and take into account the incomplete combustion. This quantity is assumed to be constant during the fire. Maximum fire area-Afi,max: The maximum fire area is the area of floor on which combustible is present.
Steady-state phase of the fire development: The steady-state phase is reached when the maximum fuel area is involved. It is the maximum rate of heat release that can be encountered for a given design fire. This phase may stand during a certain amount of time or may not exist if the decreasing phase begins during the growth phase
Decreasing phase: The decreasing phase of the fire starts when 70% of the design fire load is consumed. This phase is considered to be linear. Pyrolysis rate: The pyrolysis rate is given at any time by
Design fire curves: The design fire curves can be built as shown in Figs. 1 and 2. 4.3. Comments
(A) With the proposed procedure, the rate of heat release curve is first built; the pyrolysis rate curve and the fire area curve are then deduced from the rate of heat release curve. This is due to the fact that in the literature fire sources are found in terms of energy, and thus data are expressed in terms of energy. In fact RHR is the only data which is needed for the fire hazard assessment in the early stages of the fire and is the most important data for all types of fire.
Since the parameters used to define the fire are either effective parameters (tα and RHRf) or net parameters (qf),
modifying the combustion efficiency in the design procedure will not change the rate of heat release curve during the growth and the steady-state phases but will modify the design fire load and thus modify the fire duration. It will also modify the rate of mass loss curve. For example, when decreasing the m factor for a constant energy release rate, the fire duration will be decreased and the rate of mass loss will be increased. The physical meaning of this is the following: to release the same quantity of energy, more fuel is needed if the combustion efficiency is lower.
(B) This design fire curve is based on the hypothesis that the heat release rate density is constant during the whole fire duration and therefore any modification of the heat release rate is due to a variation of fire area. This assumption may be quite crude, particularly in the early fire stages, but should have a small influence on the overall design process.
(C) If some parameters taken from literature are used, the users must check whether the values are either effective or net.
(D) The "extended fire duration" combustion model, see [1], is recommended for a design procedure; when all of the oxygen initially present in the compartment has been consumed and when all of the oxygen entering the compartment is directly consumed by combustion within the compartment, the rate of heat release will be controlled by the ventilation and the fire duration will be extended so that all the energy of the fuel will finally be released inside the compartment. The strategy of calculation may also influence the rate of mass and the rate of heat release as explained in Section 5.3.
5. GAS TEMPERATURE
The evaluation of the gas temperature in the compartment is made by the zone model described in [1]. Inputs are described in the two previous sections. The purpose of this section is to explain the strategy of the calculation, i.e., when the 2ZM and when the 1ZM are to be used, what are the criteria to be adopted to decide which model has to be applied, when and how the input rate of heat release has to be modified. Eventually, the different scenarios that may be encountered are presented.
5.1. Application field of two- and one-zone models
Two- and one-zone models are based on different hypotheses and one cannot say that one is better than the other. Indeed they correspond to different types of fires or different stages of the same fire. They simply have different application domains and in fact they are complementing each other. When modelling a fire in a given
compartment, it is important to know whether a two- or a one-zone model is most appropriate.
A first important remark has to be made on the fire load distribution. The fire load can be considered to be uniformly distributed if the real combustible material is present more or less on the whole floor surface of the fire compartment and when the real fire load density (quantity of fuel per floor area) is more or less uniform. In contrast, the fire load is localised if the combustible material is concentrated on a quite small surface compared to the floor area, the rest of the floor area being free of fuel.
A. Uniformly distributed fire load: Fire ignitions are in most cases localised and therefore a fire remains localised during a certain amount of time. If temperatures are sufficiently high to induce spontaneous ignition of all the combustibles present in the compartment, a fully engulfed fire occurs. Generally, two-zone models are valid in case of localised fires or pre-flashover fires and one-zone models are valid in case of fully engulfed fires or post-flashover fires.
If the thickness of the lower layer is small compared to the height of the compartment, the two-zone assumption is no longer applicable and a one-zone model is more appropriate.
Finally, if the fire area is large compared to the floor area, the one-zone model assumption is better than the two-zone one.
These considerations imply that to model fires in a compartment with uniformly distributed fire load, a two-zone model is well adapted for the first stages of the fire and then a one-zone model will be a better assumption if some conditions on temperatures, fire area and smoke layer thickness are encountered.
B. Localised fire load: In case of localised fire load, when the temperature of the upper layer is sufficiently high to ignite the fuel by radiation, all the fuel starts to burn and the rate of heat release is modified. If the fire remains localised and two different zones remain, a two-zone model is thus still appropriate. In this case a one-zone model can be more appropriate only if the thickness of the upper layer is large compared to the height of the compartment.
5.2. Choice of the model
In many cases, it is difficult to know a priori whether a fire will remain localised during its entire course or whether flashover will happen, and, in general, to know whether a two- or a one-zone model is more appropriated.
An automatic strategy has been implemented to determine which model has to be used at any time within the course of the fire. With this strategy, the simulation always begins with the two-zone model assumption and if one of the above-described conditions is encountered, the simulation will switch from the two- to the one-zone model and/or will modify the mass and energy released by the fire.
The modifications of the main variables and of the basic equations when the switch to the one-zone model occurs are presented in [1]. The consequences of flashover on the fire source model and the criteria of transition from two- to one-zone are discussed in Sections 5.3 and 5.4 hereafter.
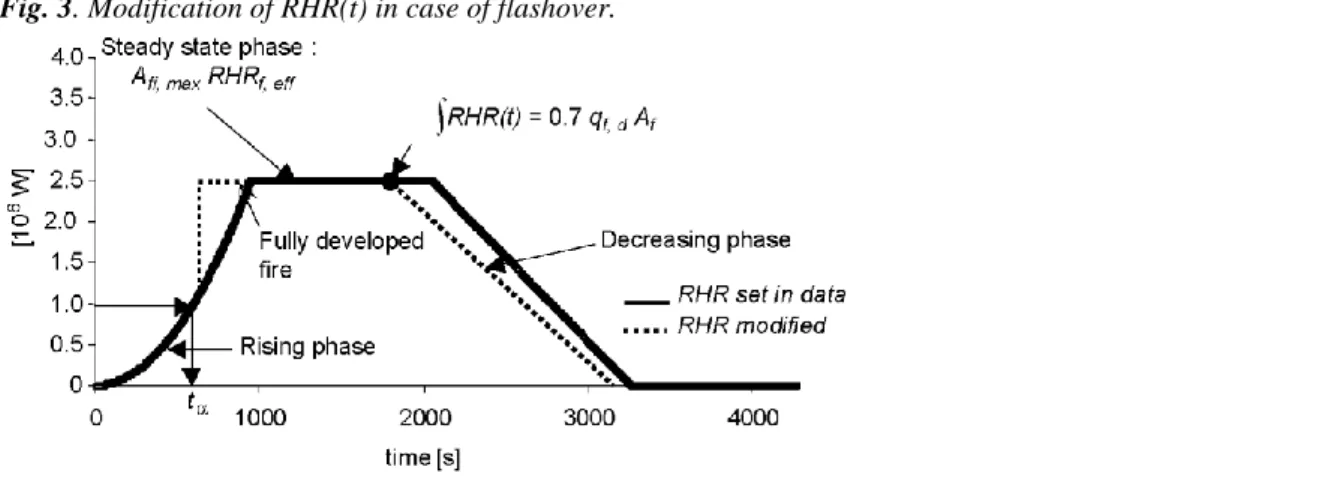
5.3. Fully developed fire
If a fire is modelled in the data by the plain curve of Fig. 3, the growing phase, represented here by a t2 curve, is reaching a maximum at the time at which all the fire area has been ignited. If the fuel ignition happens only by flame spread, the maximum is reached without modification of the initial t2 curve. If the temperature of hot gases of the upper layer reaches a sufficiently high level (in the range 500-700°C), flashover will occur. This
modification is made by modifying the initial rate of heat release curve as indicated by the dotted line in Fig. 3. At the flashover time, the input RHR curve is abandoned and RHR goes to its maximum value equal to the maximum fire area multiplied by the rate of heat release density RHRf,eff.
If the gases in contact with the fuel reach a temperature of about 300°C, the fuel also ignites and the rate of heat release increases as stated for the flashover phenomena.
The decreasing phase is assumed to be linear and to start when 70% of the design fire load is consumed.
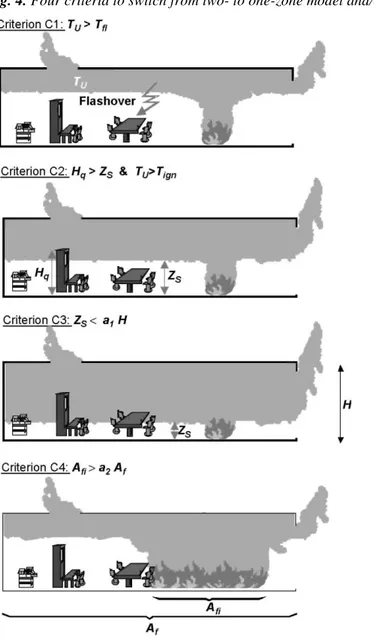
5.4. Criteria of transition from two- to one-zone model and/or of modification of the input of energy
The criteria of transition from two- to one-zone and/or of modification of the fire source are as follows. Criterion 1 (C1). TU > Tfl: High temperature of the upper layer gases, composed of combustion products and
entrained air, leads to a flashover. All the fuel in the compartment is ignited by radiative flux from the upper layer.
Criterion 2 (C2). Zs < Hq and Tz > Tign: If the gases in contact with the fuel have a higher temperature than the
ignition temperature of fuel (Tign), the propagation of fire to all the combustibles of the compartment will occur
by convective ignition. The gases in contact (at temperature Tz) can belong either to the lower layer of a
two-zone model, to the upper layer if the decrease of the interface height Zs leads to put combustible in the smoke
Fig. 3. Modification of RHR(t) in case of flashover.
Criterion 3 (C3). Zs < α1 H: The interface height goes down and leads to a very small lower layer thickness,
which is not representative of two-zone phenomenon.
Criterion 4 (C4): Afi > α2 Af: The fire area is too high compared to the floor surface of the compartment to
consider a localised fire.
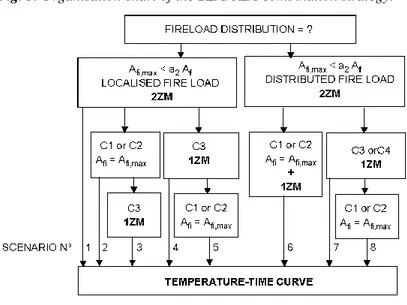
Criteria 1 and 2 lead necessarily to a modification of the rate of heat release as specified in Section 5.3. If the fire load is localised, the simulation will continue using a 2ZM and if the fire load is uniformly distributed, a 1ZM will be considered. If one of the criteria C3 or C4 is fulfilled, the code will switch to a one-zone model but the RHR will not be modified, except if criterion C1 or C2 happens simultaneously. Table 1 and Fig. 4 summarise the four criteria.
The default values of Tfl, Tign, α1 and a2 proposed in the code are given in Table 2 but users can modify any of
them.
5.5. Fire scenarios
During the course of a simulation, the different criteria may or may not be encountered. Eight different possibilities exist: five if the fire load is localised; three if the fire load is uniformly distributed. Localised fire load:
Scenario 1- No criterion is encountered, the model will remain with two zones and the RHR curve will not be modified until the end of the fire.
Scenario 2- Criterion C1 or C2 is first encountered, leading to an RHR modification. Criterion C3 is not encountered, the model remains atwo-zone one.
Scenario 3- Criterion C1 or C2 is first encountered, leading to an RHR modification. Criterion C3 is then encountered and the model switches from a two-zone to a one-zone.
Scenario 4- Criterion C3 is first encountered, the model switches from a two-zone to a one-zone. The criteria C1 and C2 are not encountered, leading to no RHR modification.
Scenario 5- Criterion C3 is first encountered, the model switches from a two-zone to a one-zone. Criterion C1 or C2 is then encountered, leading to an RHR modification
Uniformly distributed fire load:
Scenario 6- Criterion C1 or C2 is encountered, leading to an RHR modification and a simultaneous switch from a two- to a one-zone model.
Scenario 7- Criterion C3 or C4 is first encountered, the model switches from a two-zone to a one-zone. The criterion C1 and C2 are not encountered, leading to no RHR modification.
Scenario 8- Criterion C3 or C4 is first encountered, the model switches from a two-zone to a one-zone. Criterion C1 or C2 is then encountered, leading to an RHR modification.
Table 1. Summary of transition criteria
Criteria Effect
Localised qf Distributed qf
C1: TU>Tfi Afi= Afi,max 1ZM and Afi= Afi,max
C2: Zs < Hq and TU > Tign (2ZM)
or Zs > Hq and TL > Tign (2ZM)
or Tg>Tign (1ZM)
Afi = Afi,max 1ZM and Afi= Afi,max
C3: Zs < α1H 1ZM 1ZM
C4: Afi > α2Af — 1ZM
Fig. 4. Four criteria to switch from two- to one-zone model and/or modify the rate of heat release.
Table 2: Parameter value of transition criteria
Criteria Parameter value
C1 Tfl=500°C
C2 Tign=300°C
C3 α1=0.2
Fig. 5 shows the organisation chart of the different scenarios a simulation can follow.
As the definition of the limit between uniformly and localised fire load is based on criterion C4, it is obvious that criterion C4 is never encountered in case of localised fire load. For the same reason, in case of uniformly distributed fire load, criteria C4 will undoubtedly be fulfilled and therefore a simulation with uniformly distributed fire load will always switch to one-zone model.
Fig. 5. Organisation chart of the 2ZM/1ZM combination strategy.
6. Heating of steel profile
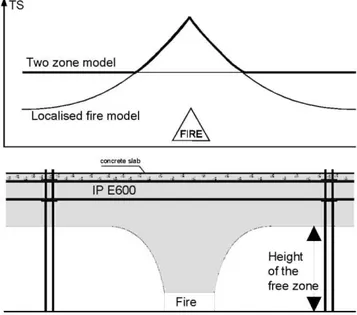
The upper zone temperature which is calculated in a two-zone fire situation can be considered as the average value of the temperature field in the gas of the upper layer. In fact, the thermal impact of a localised fire can be much more severe on structural elements located in the vicinity of the flames than the impact coming from the fire gases at the average temperature. As a consequence, if the failure of the structural elements located close to a fire may be critical for the stability of the whole structure, then the localised effect of the fire must be taken into account.
The correlation formula proposed by Alpert [6] allows to calculate the maximum gas temperature in the ceiling jet flow which forms when a vertical buoyant fire plume impinges on a horizontal ceiling and the gases spread laterally. Yet, as indicated by the title of Alpert's publication, his work was done with the objective of predicting response times of detectors and not the structural behaviour of the structure. Whereas the local gas temperature is a good indication for the response time of a detector, temperature of a structure, which is here of interest, is not only influenced by the temperature of the gases flowing on its surface but also, via radiation, by the fire itself. If the temperature of a structure has to be calculated, it is therefore preferable to use a model giving directly the heat flux received by the surface.
Hasemi has proposed such an empirical model based on tests in which the flux were directly measured [7-10]. Franssen et al. [11-13] have modified somewhat the original model in order to have a better fit with the original tests. Franssen et al. also compared the modified model to four full-scale tests and found reasonable agreement [11].
Myllymäki and Kokkala [14] made 10 additional tests, compared the results to calculations with the improved model and found that the improved model gives safe estimation of the tests results.
The combination of the local (Hasemi) and the global (2ZM) effect of a fire on a steel element is shown in Fig. 6. The heat transfer to the steel profile located near the fire source is estimated with the Hasemi model, while in the far field it is estimated as the thermal solicitation due to the upper layer temperature. It has to be noted that this model does not take into account longitudinal heat fluxes in the steel elements.
The heat flux to the element q" is given by the Hasemi's model in function of the heat released by the fire, RHR, the diameter of the fire, D and of the relative position of the steel element and the fire, r. The formulation of the Hasemi model is given in the next section.
6.1. Nondimensional model of Hasemi for localised fires
The model is based on nondimensional coefficients. Hasemi uses the Froude number, given by
Fig. 6. Combination of localised fire model and zone model for thermal impact on steel beam.
Introducing, in Eq. (9), the appropriate values for the specific mass, specific heat and room temperature of air as well as the acceleration of the gravity leads to the more convenient form of
This variable is used to estimate the vertical position of the virtual source with respect to the surface of the fire. This position is the one where a virtual point source would produce the same effects as the real fire. The position of the virtual source z' is calculated according to
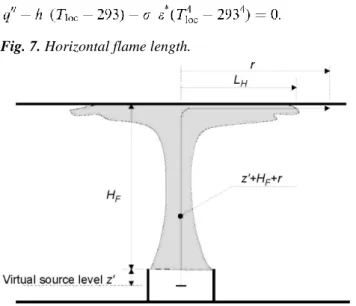
When the flame impinges on the ceiling, it is deflected and develops horizontally on a distance LH, see Fig. 7.
Whereas the position of the heat virtual source has to do with the dimension of the burner, D in Eq. (10), the relative length of the flame with respect to the compartment is linked to the vertical distance between the burner and the ceiling, HF on Fig. 7. The Froude number that gives indications on the length of the flame is therefore
calculated according to Eq. (12), very similar to Eq. (10)
It is observed during the tests that the ratio of the length of the flame from the burner, HF+LH, and the burner to
y is the nondimensional ratio between the distance from the virtual source and the total length of the flame
The heat flux to the element is given by
The net heat flux at the boundaries of a steel profile qnet, taking into account the flux lost due to the temperature
of the section, is given by
It is possible to deduce a fictitious gas temperature Tloc that has the same effect on steel elements as the net heat
flux calculated with this method. It is indeed the temperature of steel profile with a very high massivity. This steel profile has a temperature which is very close to the gas temperature, thus we have: Tloc=Ts.Tloc is then
obtained by solving Eq. (17). This temperature does not actually exist in the compartment, it is the temperature of gas surrounding a steel profile which would lead to the heat flux given by Hasemi model
Fig. 7. Horizontal flame length.
6.2. Heating
The temperature of unprotected or protected steel profile is calculated with the ENV1993-1-2 [15] methods. The temperature of the gas which heats the steel profile is the maximum between the upper zone temperature and the fictitious gas temperature obtained by Hasemi's method.
7. FIRE RESISTANCE
The fire resistance of members is determined based on the assumptions stated in ENV 1993-1-2, Section 2.4.4— Member analysis [15] using
where Efl,d is the design effect of actions for the fire situation, determined in accordance with ENV 1991-2-2; and
profile. The calculation of fire resistance is implemented for: • tension members (ENV 1993-1-2, Section 4.2.3.1);
• compression members with Class 1, Class 2 or Class 3 cross-section (ENV 1993-1-2, Section 4.2.3.2); • beams with Class 1, Class 2 or Class 3 cross-section (ENV 1993-1-2, Section 4.2.3.3 and 4.2.3.4). The fire resistance is the time at which Eq. (18) becomes unsatisfied.
8. Application
An academic example of application of this tool is presented in this section.
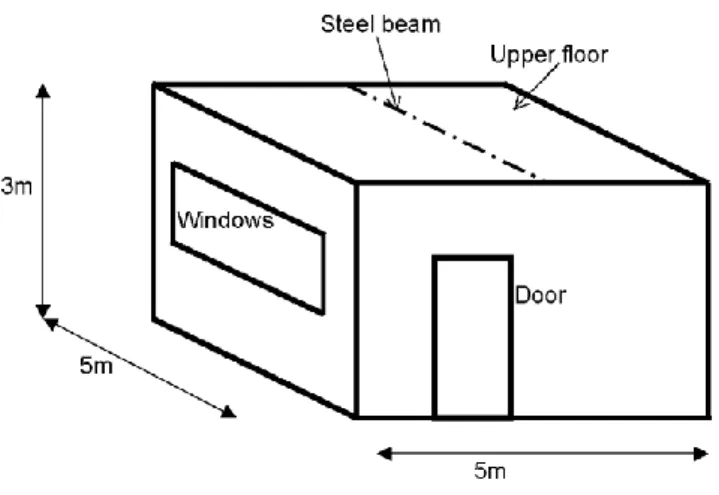
The fire resistance of a steel beam which supports a concrete slab (without composite action) in a compartment is estimated in case of an unprotected and a protected steel section (Fig. 8).
Fig. 8. Schematic view of the compartment.
The data are:
• The compartment is used as a library;
• The square floor is 5 m on 5 m wide. The height is 3 m (inner dimension);
• All partitions are made of normal weight concrete (unit mass: 2300 kg/m3; Conductivity: 2W/mK; specific
heat: 900J/kgK) and are 10 cm thick;
• There are two openings, one door (width: 1 m; height: 2 m) in first wall and one window (sill at 1m; soffit at 2 m; width: 4 m) in the third wall. Both openings are supposed to be opened from the beginning of the fire; • The beam is an IPE400. Steel S355;
• The beam is simply supported from the middle of wall one to the middle of wall three and the load is uniformly distributed;
• The design bending moment at mid span in the fire situation is 100 kNm;
• The protection material is sprayed vermiculite (unit mass: 350kg/m3; conductivity: 0.12W/mK; specific heat:
1200J/kgK).
Step 1: Define the compartment: The compartment is defined: internal dimensions, openings positions and sizes and partitions characteristics.
Step 2: Define the design fire: The suggested value of the NFSC method [1,3] for a library are: • Fire load uniformly distributed with a characteristic value qf,k= 1824 MJ/m2;
• Hc,net=17.5MJ/kg;m = 0.8;
• The fire growth rate is fast (1 MW is released by the fire after 150 s); • The maximum rate of heat release density is 500 kW/m2;
• The partial safety factor which consider the benefits of the automatic fire detection by heat is γn,3 = 0.87; • The partial safety factor which consider the benefits of off site fire brigade is γn,7 = 0.78;
• The fire risk area is equal to 25 m2 thus γ
q,1 = 1.12; • The danger of fire activation is medium thus γq,2 = 1 ;
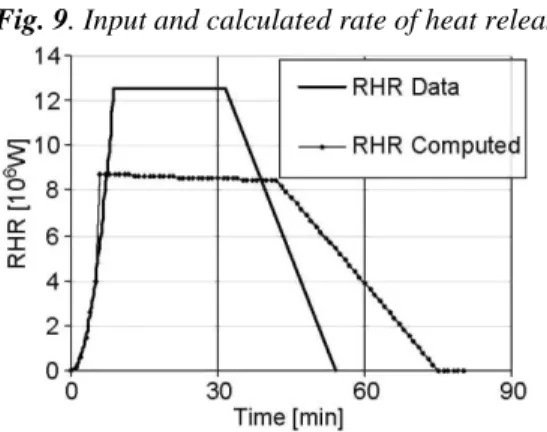
Fig. 9. Input and calculated rate of heat release.
Fig. 10. Calculated compartment temperatures.
The rate of heat release data curve is built automatically as shown in Fig. 9 (RHR data curve).
Step 3: Run the compartment fire model: The main output are the rate of heat release curve calculated (Fig. 9), the hot zone temperature and the cold zone temperature (Fig. 10).
The transition to the one-zone model happens at 4.5 min, time at which criterion C4 is encountered. The flashover happens at 5.6 min. At this time, the rate of heat release switches to its steady-state value of 12.5 MW. The oxygen inside the compartment is then quickly consumed. Thus a ventilation regime occurs, leading to a rate of heat release of 8.6 MW. The fire duration is increased. The areas below the two curves of Fig. 9 are equal, all the energy available is released inside the compartment.
Step 4: Calculate the steel temperature: The steel temperature is evaluated for the unprotected and protected section (Fig. 11).
In this case, the design temperature-time curve is the equivalent local temperature just above the fire source (Fig. 10), obtained with the Hasemi's model, until the switch to the one-zone model at 4.5 min. From 4.5 min to the end of the calculation, it is the one-zone model temperature.
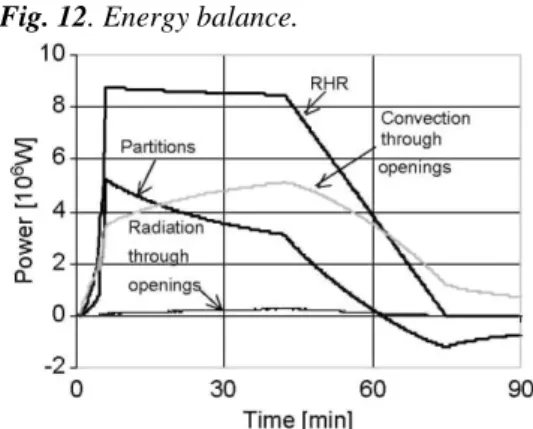
Fig. 12. Energy balance.
The drop in the design temperature-time curve which occur at 4.5min is due to the fact that, until this time, Hasemi's model is used and, afterwards, a one-zone model is used. This brief drop is of course not physical but the results of the design hypotheses which changes during a simulation. Moreover, just after flashover (at 5.6 min) the temperature is reaching approximately the same value as the one given by Hasemi model at 4.6 min. This is only fortuitous, in fact a bigger difference is possible.
Step 5: Calculate the member resistance: The fire resistance of the unprotected steel section IPE400 is 10.2min. With a protection thickness of 20 mm of spray vermiculite, the maximum steel temperature (472°C) is lower than the critical steel temperature (507°C) of the member. In other words, the member resists during the whole fire duration; no failure of the member will occur.
Energy balance: The energy balance for this example is presented in Fig. 12. The contribution of the vent and of the partition are on the same order of magnitude while the radiation through openings is quite small compared to the other terms. During the quasi-steady-state phase, which is driven by the ventilation, the rate of heat release is nearly constant (only a small decrease), the partition losses decreases faster and the convective heat losses through openings increase.
9. CONCLUSIONS
A computer tool has been developed to design steel elements submitted to compartment fires. This tool calculates successively:
• The design fire source (rate of heat release and rate of mass loss); • The gas temperature in the compartment;
• The temperature of a steel element in that fire compartment; • The structural fire resistance of this element.
The definition of the design fire source is made according to a semiprobabilistic method developed recently in a European research. This method enables to take into account active fire fighting measures.
The gas temperature calculation is made by a zone model. Different scenarios may occur depending on the results of the simulation. A two-zone model is first applied, a switch to a one-zone can occur if this model is more appropriate to the conditions inside the compartment. A modification of the rate of heat release may also occur if flashover conditions are encountered.
The temperature of steel section is calculated with the ENV1993-1-2 methods. The thermal solicitation is either the zone temperature or the equivalent localised temperature that includes the gas temperature and the direct radiant flux from a localised fire. The Hasemi's method has been implemented to evaluate this local effect. The structural fire resistance is evaluated according to ENV1993-1-2.
This tool has a quite large field of application, it is suitable for pre- and post-flashover conditions, localised or fully engulfed fires. Nevertheless, it is limited to:
• A single compartment with quite simple shape suitable for zone modelling; • A single fire source;
Even if the tool is primarily built to use the proposed design methodology, it remains open to other utilisations. Among other things, it enables to define new parameter values of the design fire curve, to modify the parameter values of the transition criteria or to build, point by point, other fire source (for example, to simulate fire tests or more sophisticated design fires). It is also possible to use a two-or a one-zone model for the entire duration of a fire.
A Graphic User Interface has been developed to define the input data and view the results. The code is a freeware and is available at the University of Liege for general public
(http://www.ulg.ac.be/matstruc/en/index.html).
The authors wish to advise users that even if the code is "user friendly" and is able to give results in a short time, fires are very complex phenomenon. It is thus essential that any user must have a good knowledge of the dynamic of fires and that any result is fully analysed and fully understood. Among other thing, a single simulation is not sufficient in a decision process, sensitivity studies have to be conducted [16]. Moreover the figures provided for the input data (for example, thermal properties, fire loads, rate of heat release, etc.) by the graphic interface are indicative values. They can be modified by the user who has full responsibility for the choice of these input data.
Acknowledgements
The work described in this paper was undertaken within the ECSC sponsored researches "Natural Fire Safety Concept" [2] and "Natural Fire Safety Concept: Full Scale Tests, Implementation in the Eurocodes and Development of a Userfriendly Design Tool" [17].
References
[1] Cadorin J-F, Franssen J-M. A tool to design steel elements submitted to compartment fires-Ozone V2-Part 1: pre and post flashover compartment fire model. Fire Safety J 2003;38:395-427.
[2] CEC Agreement 7210-SA/125/126/213/214/323/423/522/623/839/937. Competitive Steel Buildings through Natural Fire Safety Concept. Final report, March 1999.
[3] Schleich JB, Cajot L-G. Natural Fire Safety for Buildings. INTERFLAM 2001 Conference Proceedings, London: Interscience Communications Ltd., 2001. p. 359-68.
[4] ENV 1991-1: Basis of design and actions on structures-Part 1: basis of design. CEN, September 1994.
[5] NBN S 21-208. Ie éd.-protection incendie dans les bâtiments-conception et calcul des installations d'évacuation de fumées et de
chaleur-partie 1: grands espaces intérieurs non cloisonnés s'étendant sur un niveau. Bruxelles: Institut Belge de Normalisation, 1993. [6] Alpert RL. Calculation of response time of ceiling-mounted detectors. Fire Technol. 1972;8:181-95.
[7] Hasemi Y, Tokunaga T. Flame geometry effects on the buoyant plumes from turbulent diffusion flames. Fire Sci. Technol. 1984;4:15-26. [8] Hasemi Y, Yokobayashi S, Wakamatsu T, Ptchelintsev A. Fire safety of building components exposed to a localized fire-scope and experiments on ceiling/beam system exposed to a localized fire. First International ASIAFLAM Conference at Kowloon, London: Interscience Communications Ltd., 1995. p. 351-60.
[9] Ptchelintsev A, Hasemi Y, Nikolaenko M. Numerical analysis of structures exposed to localized fire. First International ASIAFLAM Conference at Kowloon, London: Interscience Communications Ltd., 1995. p. 539-44.
[10] Wakamatsu T, Hasemi Y, Yokobayashi Y, Ptchelintsev A. Experimental study on the heating mechanism of a steel beam under ceiling exposed to a localized fire. Second INTERFLAM 96 Conference. Cambridge, 1996. p. 509-18.
[11] Franssen JM, Cajot LG, Schleich JB. Natural fire in large compartment-effect caused on the structure by localised fires in large compartment. EUROFIRE, Brussels, 1998. p. 19 (CD-ROM).
[12] Franssen JM. Contributions à la modélisation des incendies dans les bâtiments et de leurs effets sur les structures. Thèse d'agr. de l'ens, sup., F.S.A., University of Liege, 1997.
[13] CEC Agreements 7210-SA/211/318/518/620/933. Development of design rules for steel structures subjected to natural fires in Closed Car Parks. Final Report, February 97.
[14] Myllymäki J, Kokkala M. Thermal exposure to a high welded I-beam above a pool fire. In: Franssen J-M, editor. Structures in fire: Proceedings of the First International Workshop, Copenhagen, Denmark, 19th and 20th of June, 2000: University of Liege, 2000. p. 211-24. [15] Draft ENV 1993-1-2. Eurocode 3: design of steel structures. Part 1.2: general rules. Structural Fire Design. CEN, Brussels, May 1995. [16] Beard AN. Fire model and design. Fire Safety J. 1997;28:117-38.
[17] CEC Agreement 7210-PA/PB/PC/PE/PF/PR-060. Natural fire safety concept-full scale tests, Implementation in the Eurocodes and Development of an User Friendly design tool. Final report, December 2000.